AirROI ranking · 202636 markets ranked
Best Places to Buy an Airbnb in Tennessee (2026)
Franklin is the best place to buy an Airbnb in Tennessee in 2026, according to AirROI's ranking of 36 markets. Its listings averaged $50,000 in revenue over the 12 months to October 2026 and were booked on 49% of nights. It leads on the blend rather than on any one measure, placing 2nd of 36 for occupancy, 4th of 36 for year-round demand and 6th of 36 for revenue growth. Sevierville and Nashville-Davidson come next.
- Markets tracked
- 169
- Active Airbnb listings
- 38,500
- Avg. revenue per listing
- $44,600
- Occupancy rate
- 43%
- Avg. nightly rate
- $335
- Revenue change, typical market
- +8%
The short answer
Tennessee Airbnb Market at a Glance
Across Tennessee, the 38,500 active Airbnb listings tracked by AirROI, a short-term-rental data firm, averaged $44,600 over the same period. They were booked on 43% of nights at about $335 a night; the ranking covers the 36 markets with at least 100 active listings. Revenue per listing rose in 32 of the 36 ranked markets with a comparable year of data, by 8% in the typical one.
The ranking weighs revenue per listing most, then occupancy and market size, then how evenly income spreads across the year and how it changed on the year. It reflects rental performance, not purchase prices or local short-term rental rules. How the ranking works.
Where the top 10 Airbnb markets in Tennessee are
Each dot is one of the 169 markets AirROI tracks in Tennessee (1 outlying one falls outside the map), sized by active listings and coloured by average revenue per listing. Select a number to jump to its profile.
Top 10
The Top 10 Airbnb Markets in Tennessee
Each profile draws on the market's full AirROI report: how it earns, when in the year, who books and what sells. Monthly figures are averages per listing active in that month, so twelve of them add up to more than the annual average, which also counts listings that operated for only part of the year.
| # | Market | Avg. revenue | Occupancy |
|---|---|---|---|
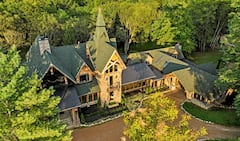 Franklin High occupancy · Year-round demand | $50,000 | 49% | |
 Sevierville Large market · High earnings | $60,000 | 45% | |
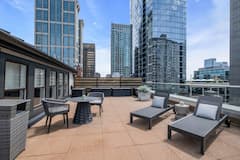 Nashville-Davidson Large market · High earnings | $50,200 | 44% | |
| 4 | 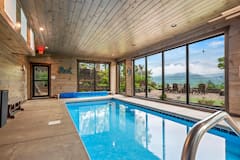 Gatlinburg Large market · High earnings | $54,900 | 44% |
| 5 |  Knoxville Large market · Year-round demand | $31,300 | 45% |
| 6 |  Pigeon Forge Large market · High earnings | $51,400 | 43% |
| 7 |  Chattanooga High occupancy · Large market | $31,300 | 45% |
| 8 |  Berry Hill High earnings · High occupancy | $55,100 | 44% |
| 9 |  Wears Valley High earnings · Growing revenue | $55,100 | 43% |
| 10 | 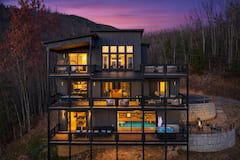 Pittman Center Growing revenue · High earnings | $48,400 | 41% |
1. Franklin
Known for: High occupancy · Year-round demand
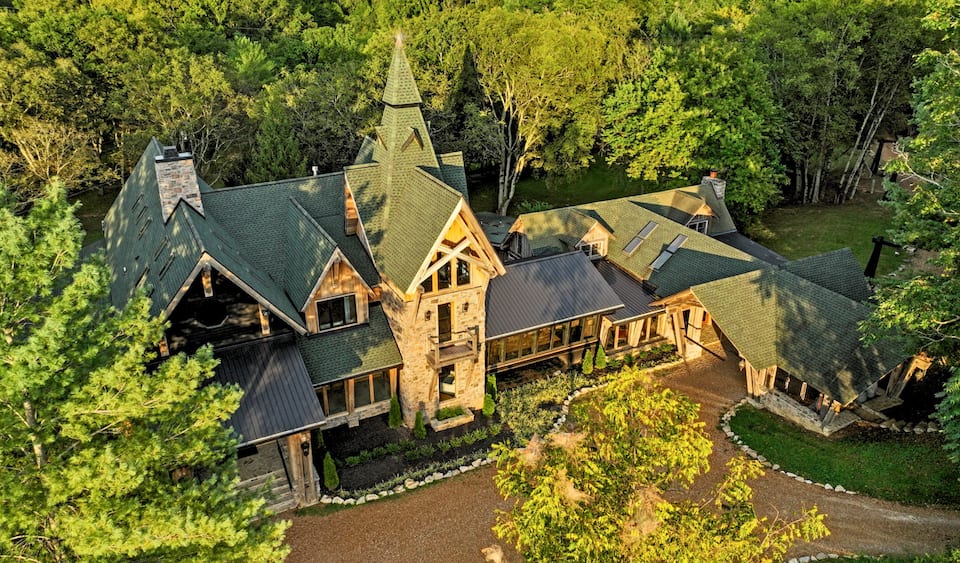
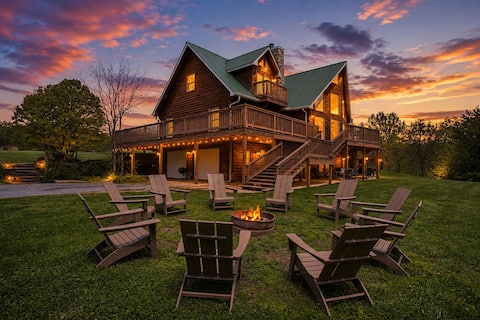
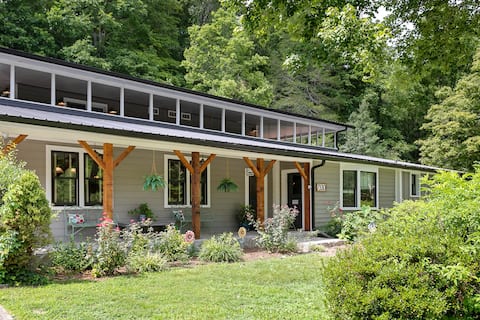
Top-earning Airbnb listings in Franklin - Avg. revenue
- $50,000 +19% vs. last year
- Occupancy
- 49%
- Nightly rate
- $340
- Active listings
- 409
Where it places among the 36 ranked markets in Tennessee
- Revenue 8th of 36
- Occupancy 2nd of 36
- Market size 11th of 36
- Year-round 4th of 36
- Growth 6th of 36
- How it earns
- Franklin fills more nights than most of Tennessee: 49% of them, the second-highest occupancy of the 36 ranked markets, at about $340 a night. That adds up to $50,000 per listing over the year, the eighth-highest of the 36 ranked markets. A typical listing takes in about $4,390 a month; the top quarter clear $6,850 or more. Revenue per listing rose 19% over the year, helped by nightly rates 18% higher.
- When it earns
- Demand in Franklin holds up through the year: January, the slowest month, still brings in about 61% of June's revenue.
- What sells
- The most common entire home has 3 bedrooms (33% of entire homes), and houses make up 71% of supply.
- Who it suits
- It suits buyers who want income that holds up all year.
Revenue per listing by month
$5,800 $3,550- Median listing
- $4,390/mo
- Top 25% of listings
- $6,850+/mo
- Booked ahead
- 48 days
- Average stay
- 5 nights
- Most common home size
- 3 bedrooms
- Superhosts
- 78%
Areas in the full report: Downtown Franklin · Battle Ground Academy Area · The Factory at Franklin
Full Franklin Airbnb report2. Sevierville
Known for: Large market · High earnings
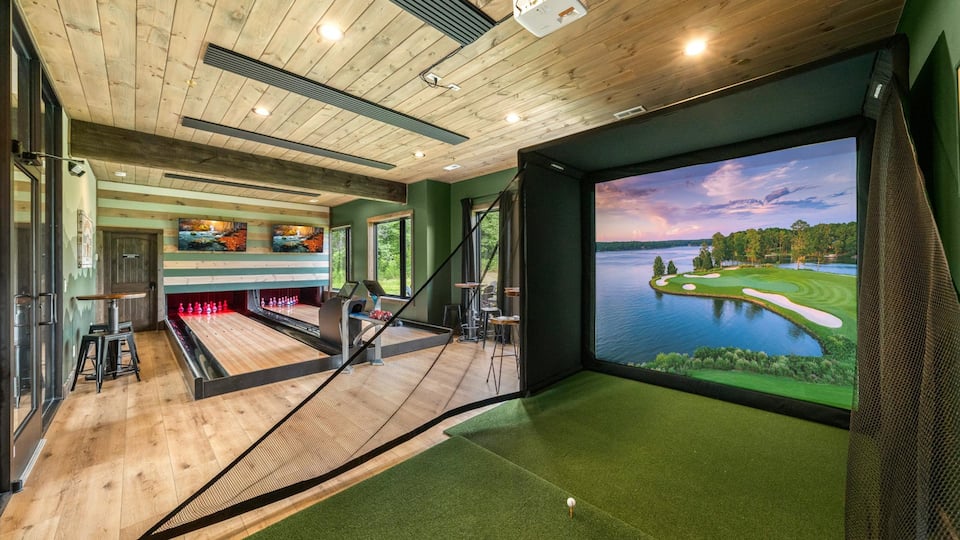

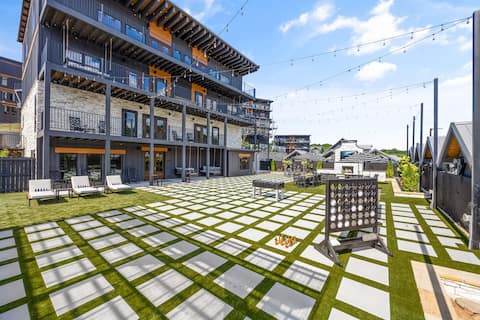
Top-earning Airbnb listings in Sevierville - Avg. revenue
- $60,000 +9% vs. last year
- Occupancy
- 45%
- Nightly rate
- $415
- Active listings
- 7,520
Where it places among the 36 ranked markets in Tennessee
- Revenue 2nd of 36
- Occupancy 8th of 36
- Market size 1st of 36
- Year-round 29th of 36
- Growth 17th of 36
- How it earns
- Sevierville is Tennessee's largest Airbnb market, with 7,520 active listings to price against. Average revenue per listing came to $60,000, the second-highest of the 36 ranked markets. In a typical month the median listing brings in about $5,090, and the best quarter clear $8,270. Revenue per listing rose 9% over the year, helped by nightly rates 17% higher, even as the number of listings grew 29%.
- When it earns
- Sevierville's season covers June and July, peaking in July at about $9,120 per listing; February, the quietest month, brings in about $3,180.
- The competition
- Professional managers run 44% of listings, against about 18% in the typical market in Tennessee, and the largest operator runs 182 listings, so new hosts compete with polished operations.
- Guest expectations
- Average ratings (4.78 stars) trail the typical market in Tennessee (4.86), which leaves room for a well-run listing to stand out.
- Who it suits
- Best for buyers who can carry costs through a quiet February and plan to use a professional manager or run a polished operation.
Revenue per listing by month
$9,120 $3,180- Median listing
- $5,090/mo
- Top 25% of listings
- $8,270+/mo
- Booked ahead
- 57 days
- Average stay
- 4 nights
- Most common home size
- 2 bedrooms
- Superhosts
- 62%
Areas in the full report: Pigeon Forge · Gatlinburg · Sevierville Historic District
Full Sevierville Airbnb report3. Nashville-Davidson
Known for: Large market · High earnings
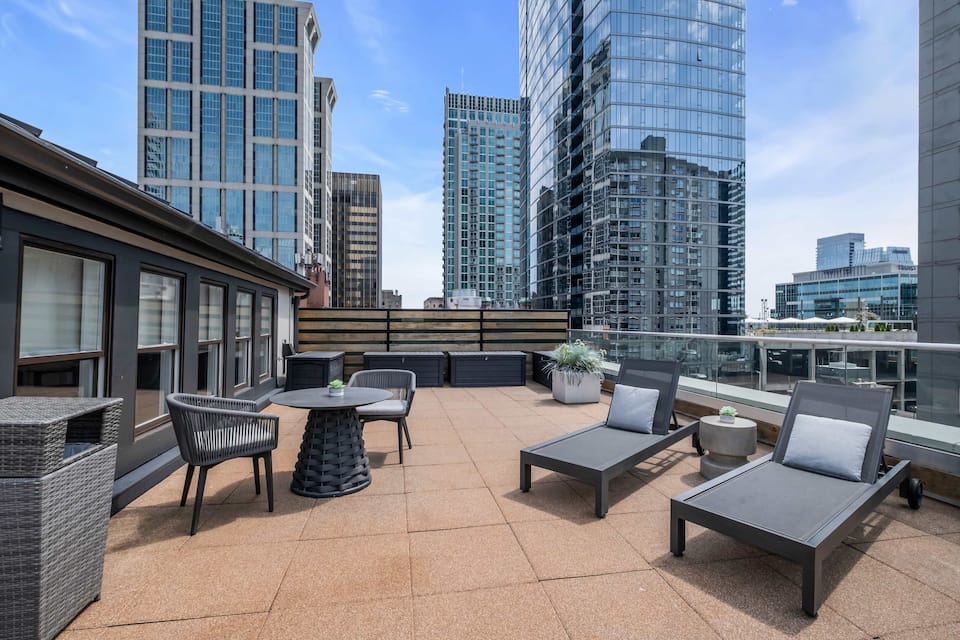


Top-earning Airbnb listings in Nashville-Davidson - Avg. revenue
- $50,200 +14% vs. last year
- Occupancy
- 44%
- Nightly rate
- $360
- Active listings
- 5,310
Where it places among the 36 ranked markets in Tennessee
- Revenue 7th of 36
- Occupancy 13th of 36
- Market size 2nd of 36
- Year-round 14th of 36
- Growth 11th of 36
- How it earns
- Nashville-Davidson is Tennessee's second-largest Airbnb market, with 5,310 active listings to price against. Listings averaged $50,200 in revenue over the year, the seventh-highest of the 36 ranked markets. Month to month, the median listing earns about $4,130 and a top-quarter listing $6,740 or more. Revenue per listing rose 14% over the year, helped by nightly rates 14% higher.
- When it earns
- Revenue in Nashville-Davidson concentrates from March to October: May earns about $6,240 per listing, about twice as much as January.
- Who books
- Guests are overwhelmingly domestic (93%); the most common home cities are Nashville, New York and Atlanta.
- What sells
- Two-bedroom homes lead the market (24% of entire homes), and houses make up 56% of supply.
Revenue per listing by month
$6,240 $3,100- Median listing
- $4,130/mo
- Top 25% of listings
- $6,740+/mo
- Booked ahead
- 57 days
- Average stay
- 4 nights
- Most common home size
- 2 bedrooms
- Superhosts
- 69%
Areas in the full report: Downtown Nashville · East Nashville · The Gulch
Full Nashville-Davidson Airbnb report4. Gatlinburg
Known for: Large market · High earnings
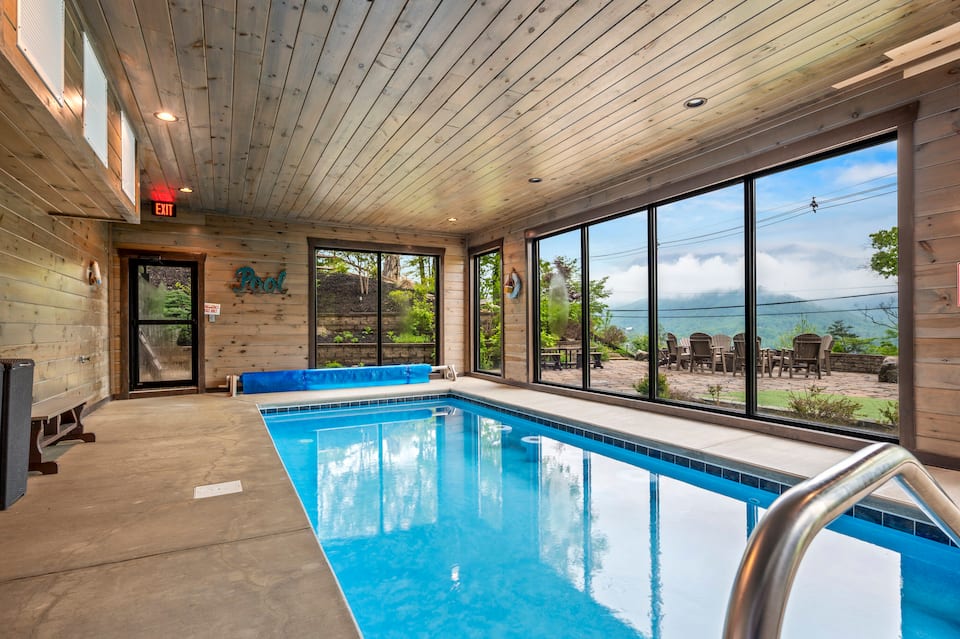
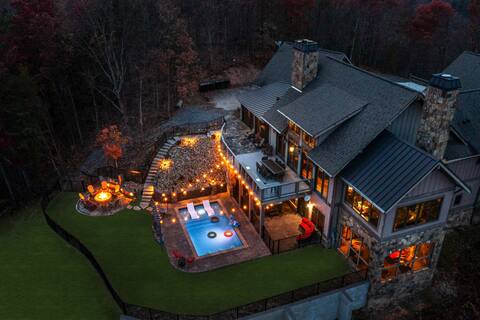
Top-earning Airbnb listings in Gatlinburg - Avg. revenue
- $54,900 +8% vs. last year
- Occupancy
- 44%
- Nightly rate
- $385
- Active listings
- 4,120
Where it places among the 36 ranked markets in Tennessee
- Revenue 5th of 36
- Occupancy 12th of 36
- Market size 3rd of 36
- Year-round 25th of 36
- Growth 18th of 36
- How it earns
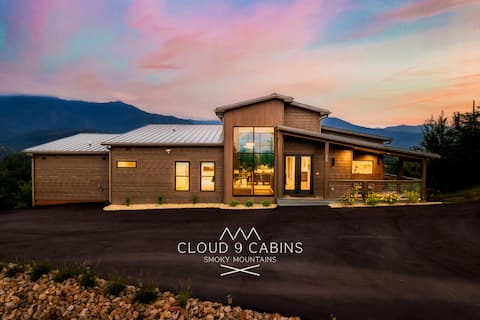
- Gatlinburg is Tennessee's third-largest Airbnb market, with 4,120 active listings to price against. Average revenue per listing came to $54,900, the fifth-highest of the 36 ranked markets. A typical listing takes in about $4,590 a month; the top quarter clear $7,800 or more. Revenue per listing rose 8% over the year, helped by nightly rates 11% higher, even as the number of listings grew 24%.
- When it earns
- Gatlinburg has two seasons, October–December and June–July. July is the strongest month at about $8,030 per listing, and February the quietest at about $3,020. Guests book early, about 60 days ahead against roughly 48 for the typical market in Tennessee, and stay about 4 nights.
- The competition
- Professional managers run 44% of listings, against about 18% in the typical market in Tennessee, and the largest operator runs 55 listings, so new hosts compete with polished operations.
- Guest expectations
- Average ratings (4.77 stars) trail the typical market in Tennessee (4.86), which leaves room for a well-run listing to stand out.
- Who it suits
- A good fit for buyers who plan to use a professional manager or run a polished operation and can ride out a slow February.
Revenue per listing by month
$8,030 $3,020- Median listing
- $4,590/mo
- Top 25% of listings
- $7,800+/mo
- Booked ahead
- 60 days
- Average stay
- 4 nights
- Most common home size
- 2 bedrooms
- Superhosts
- 57%
Areas in the full report: The Strip · Great Smoky Mountains National Park · Downtown Gatlinburg
Full Gatlinburg Airbnb report5. Knoxville
Known for: Large market · Year-round demand

Top-earning Airbnb listings in Knoxville - Avg. revenue
- $31,300 +7% vs. last year
- Occupancy
- 45%
- Nightly rate
- $235
- Active listings
- 1,160
Where it places among the 36 ranked markets in Tennessee
- Revenue 16th of 36
- Occupancy 9th of 36
- Market size 6th of 36
- Year-round 7th of 36
- Growth 21st of 36
- How it earns
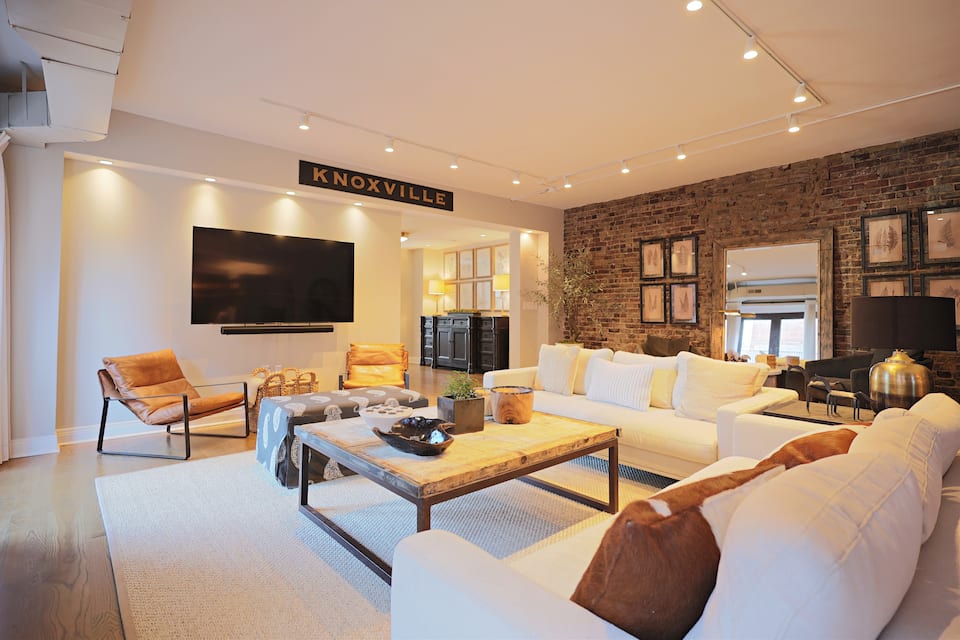
- Knoxville has a milder off-season than most of Tennessee: January, its slowest month, brings in about 59% of September's revenue. Moderate rates keep revenue per listing at $31,300, 30% below the Tennessee average. Its place at #5 rests on market size (6th of 36) and year-round demand (7th of 36) rather than on revenue per listing. In a typical month the median listing brings in about $2,810, and the best quarter clear $4,600. Revenue per listing rose 7% over the year, helped by nightly rates 19% higher, even as the number of listings grew 26%.
- When it earns
- In Knoxville, the months from May to November earn above the yearly average, led by September at about $3,830 per listing; January is the low point at about $2,270.
- What sells
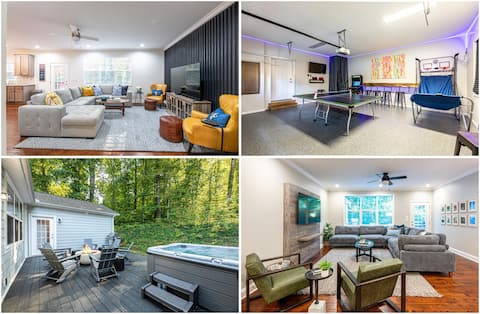
- The most common entire home has 2 bedrooms (33% of entire homes), and houses make up 60% of supply.
Revenue per listing by month
$3,830 $2,270- Median listing
- $2,810/mo
- Top 25% of listings
- $4,600+/mo
- Booked ahead
- 49 days
- Average stay
- 5 nights
- Most common home size
- 2 bedrooms
- Superhosts
- 69%
Areas in the full report: Downtown Knoxville · Old City · North Knoxville
Full Knoxville Airbnb report6. Pigeon Forge
Known for: Large market · High earnings


Top-earning Airbnb listings in Pigeon Forge - Avg. revenue
- $51,400 +7% vs. last year
- Occupancy
- 43%
- Nightly rate
- $370
- Active listings
- 3,410
Where it places among the 36 ranked markets in Tennessee
- Revenue 6th of 36
- Occupancy 16th of 36
- Market size 4th of 36
- Year-round 29th of 36
- Growth 23rd of 36
- How it earns
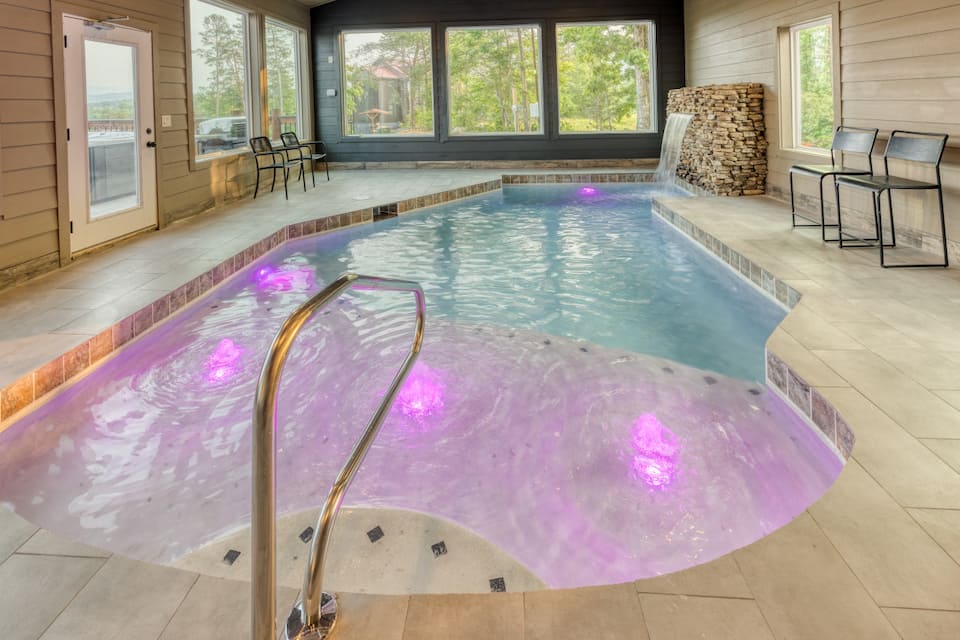
- Pigeon Forge is Tennessee's fourth-largest Airbnb market, with 3,410 active listings to price against. Average revenue per listing came to $51,400, the sixth-highest of the 36 ranked markets. Month to month, the median listing earns about $4,360 and a top-quarter listing $7,090 or more. Revenue per listing rose 7% over the year, helped by nightly rates 11% higher, even as the number of listings grew 22%.
- When it earns
- Revenue in Pigeon Forge peaks twice, over October–December and again over June–July; July leads at about $7,720 per listing, while February brings in about $2,690. Bookings arrive well in advance, about 60 days before check-in, so much of a season's calendar fills early; stays average 4 nights.
- The competition
- Professional managers run 47% of listings, against about 18% in the typical market in Tennessee, and the largest operator runs 106 listings, so new hosts compete with polished operations.
- Guest expectations
- Average ratings (4.76 stars) trail the typical market in Tennessee (4.86), which leaves room for a well-run listing to stand out.
- Who it suits
- It suits buyers who plan to use a professional manager or run a polished operation and are prepared for thin bookings around February.
Revenue per listing by month
$7,720 $2,690- Median listing
- $4,360/mo
- Top 25% of listings
- $7,090+/mo
- Booked ahead
- 60 days
- Average stay
- 4 nights
- Most common home size
- 2 bedrooms
- Superhosts
- 56%
Areas in the full report: The Parkway · Gatlinburg · Walden's Creek
Full Pigeon Forge Airbnb report7. Chattanooga
Known for: High occupancy · Large market


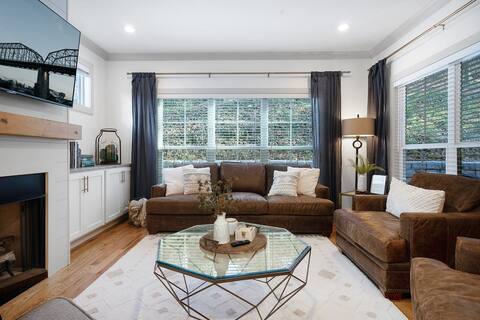
Top-earning Airbnb listings in Chattanooga - Avg. revenue
- $31,300 +8% vs. last year
- Occupancy
- 45%
- Nightly rate
- $210
- Active listings
- 1,090
Where it places among the 36 ranked markets in Tennessee
- Revenue 18th of 36
- Occupancy 6th of 36
- Market size 7th of 36
- Year-round 13th of 36
- Growth 19th of 36
- How it earns
- Chattanooga listings charge about $210 a night, 37% below the Tennessee average, and are booked on 45% of nights. Moderate rates keep revenue per listing at $31,300, 30% below the Tennessee average. Its place at #7 rests on occupancy (6th of 36) and market size (7th of 36) rather than on revenue per listing. A typical listing takes in about $2,850 a month; the top quarter clear $4,520 or more. Revenue per listing rose 8% over the year, helped by nightly rates 16% higher.
- When it earns
- Chattanooga has two seasons, May–July and September–October. July is the strongest month at about $4,260 per listing, and January the quietest at about $2,150.
- What sells
- Two-bedroom homes lead the market (35% of entire homes), and houses make up 58% of supply.
Revenue per listing by month
$4,260 $2,150- Median listing
- $2,850/mo
- Top 25% of listings
- $4,520+/mo
- Booked ahead
- 37 days
- Average stay
- 4 nights
- Most common home size
- 2 bedrooms
- Superhosts
- 70%
Areas in the full report: North Shore · Downtown Chattanooga · St. Elmo
Full Chattanooga Airbnb report8. Berry Hill
Known for: High earnings · High occupancy

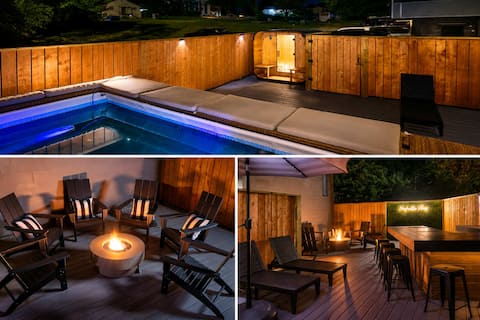
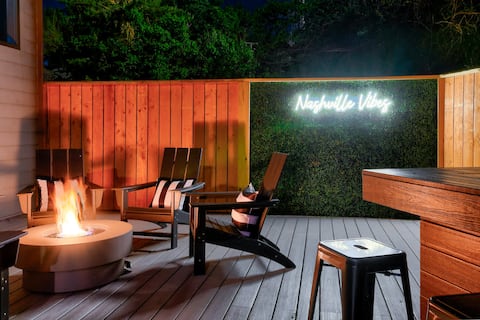
Top-earning Airbnb listings in Berry Hill - Avg. revenue
- $55,100 +13% vs. last year
- Occupancy
- 44%
- Nightly rate
- $365
- Active listings
- 133
Where it places among the 36 ranked markets in Tennessee
- Revenue 3rd of 36
- Occupancy 14th of 36
- Market size 28th of 36
- Year-round 16th of 36
- Growth 14th of 36
- How it earns
- Berry Hill books 44% of nights at about $365 a night, close to the typical market in Tennessee. Listings averaged $55,100 in revenue over the year, the third-highest of the 36 ranked markets. The gap between listings is wide: a typical one takes in about $3,720 a month, while the top quarter clear $7,610 and the top 10% $11,300, so pricing and presentation count for more here than in most of Tennessee. Revenue per listing rose 13% over the year, helped by nightly rates 11% higher. With 133 listings it is a small market, so its averages can move more from year to year.
- When it earns
- Berry Hill's season runs from May to October, peaking in October at about $6,330 per listing; January, the quietest month, brings in about $3,080.
- What sells
- Big homes set the market: 71% of entire homes have three or more bedrooms, against about 47% in the typical market in Tennessee, and houses make up 59% of supply.
- Guest expectations
- Average ratings (4.80 stars) trail the typical market in Tennessee (4.86), which leaves room for a well-run listing to stand out.
- Who it suits
- Best for buyers who want a large home for groups and families and plan to use a professional manager or run a polished operation.
Revenue per listing by month
$6,330 $3,080- Median listing
- $3,720/mo
- Top 25% of listings
- $7,610+/mo
- Booked ahead
- 48 days
- Average stay
- 4 nights
- Most common home size
- 4 bedrooms
- Superhosts
- 61%
9. Wears Valley
Known for: High earnings · Growing revenue


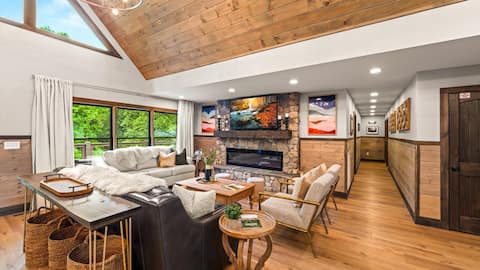
Top-earning Airbnb listings in Wears Valley - Avg. revenue
- $55,100 +15% vs. last year
- Occupancy
- 43%
- Nightly rate
- $365
- Active listings
- 172
Where it places among the 36 ranked markets in Tennessee
- Revenue 4th of 36
- Occupancy 17th of 36
- Market size 17th of 36
- Year-round 31st of 36
- Growth 10th of 36
- How it earns
- Wears Valley books 43% of nights at about $365 a night, close to the typical market in Tennessee. Average revenue per listing came to $55,100, the fourth-highest of the 36 ranked markets. In a typical month the median listing brings in about $4,340, and the best quarter clear $7,310. Revenue per listing rose 15% over the year, helped by nightly rates 15% higher. Its 172 listings make it one of the smaller ranked markets, so its figures are less settled than those of larger ones.
- When it earns
- Revenue in Wears Valley peaks twice, over October–December and again over June–July; July leads at about $8,160 per listing, while February brings in about $2,800. Guests book early, about 62 days ahead against roughly 48 for the typical market in Tennessee, and stay about 4 nights.
- The competition
- Professional managers run 49% of listings, against about 18% in the typical market in Tennessee, so new hosts compete with polished operations.
- Guest expectations
- Average ratings (4.81 stars) trail the typical market in Tennessee (4.86), which leaves room for a well-run listing to stand out.
- Who it suits
- A good fit for buyers who plan to use a professional manager or run a polished operation and can carry costs through a quiet February.
Revenue per listing by month
$8,160 $2,800- Median listing
- $4,340/mo
- Top 25% of listings
- $7,310+/mo
- Booked ahead
- 62 days
- Average stay
- 4 nights
- Most common home size
- 3 bedrooms
- Superhosts
- 67%
10. Pittman Center
Known for: Growing revenue · High earnings
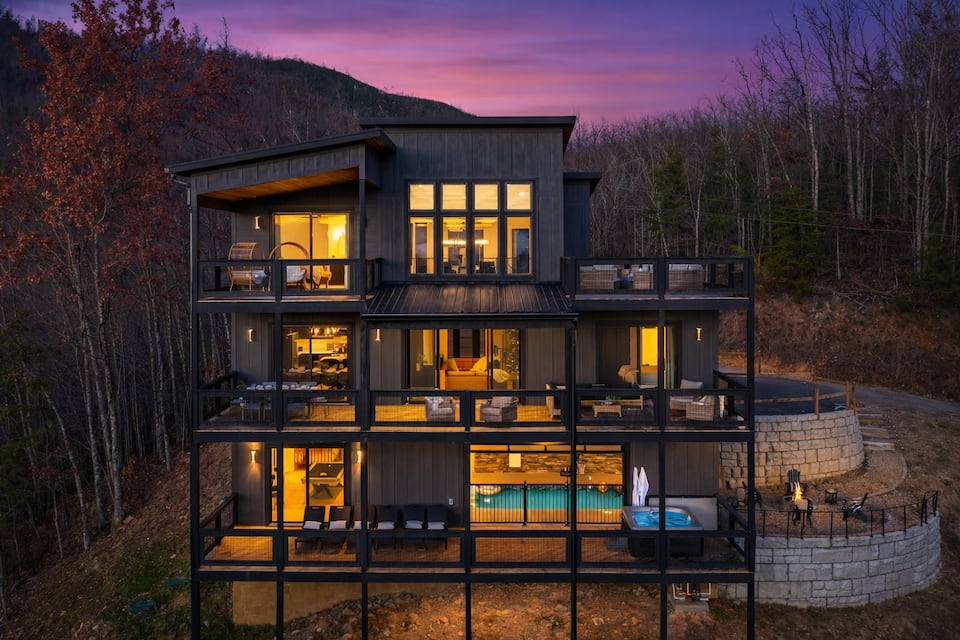
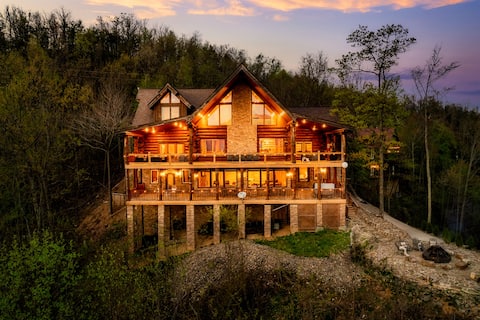
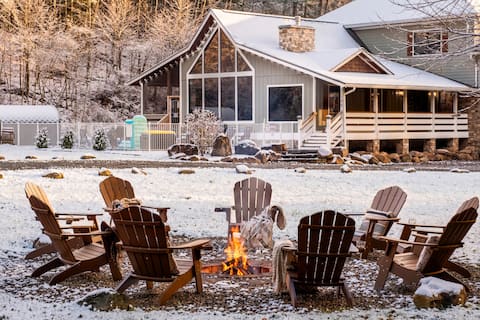
Top-earning Airbnb listings in Pittman Center - Avg. revenue
- $48,400 +18% vs. last year
- Occupancy
- 41%
- Nightly rate
- $345
- Active listings
- 289
Where it places among the 36 ranked markets in Tennessee
- Revenue 10th of 36
- Occupancy 22nd of 36
- Market size 13th of 36
- Year-round 22nd of 36
- Growth 8th of 36
- How it earns
- Pittman Center books 41% of nights at about $345 a night, close to the typical market in Tennessee. That adds up to $48,400 per listing over the year, the tenth-highest of the 36 ranked markets. Month to month, the median listing earns about $3,460 and a top-quarter listing $6,170 or more. Revenue per listing rose 18% over the year, helped by nightly rates 14% higher. With 289 listings it is a small market, so its averages can move more from year to year.
- When it earns
- Revenue in Pittman Center concentrates in June and July: July earns about $7,020 per listing, about 2.6 times as much as February. Bookings arrive well in advance, about 64 days before check-in, so much of a season's calendar fills early; stays average 4 nights.
- The competition
- Professional managers run 50% of listings, against about 18% in the typical market in Tennessee, so new hosts compete with polished operations.
- Guest expectations
- Average ratings (4.79 stars) trail the typical market in Tennessee (4.86), which leaves room for a well-run listing to stand out.
- Who it suits
- It suits buyers who plan to use a professional manager or run a polished operation and can ride out a slow February.
Revenue per listing by month
$7,020 $2,710- Median listing
- $3,460/mo
- Top 25% of listings
- $6,170+/mo
- Booked ahead
- 64 days
- Average stay
- 4 nights
- Most common home size
- 2 bedrooms
- Superhosts
- 61%
Full ranking
How All 36 Ranked Markets in Tennessee Compare
The overall ranking with the five measures behind it. "Slow month" is a market's weakest month of revenue as a share of its best, so a higher figure means steadier income. Select a column heading to re-sort.
| Franklin High occupancy, year-round demand | $49,960 | 49% | $340 | 61% | +19% | 409 | |
| Sevierville Large market, high earnings | $60,014 | 45% | $417 | 35% | +9% | 7,523 | |
| Nashville-Davidson Large market, high earnings | $50,246 | 44% | $360 | 50% | +14% | 5,305 | |
| 4 | Gatlinburg Large market, high earnings | $54,870 | 44% | $385 | 38% | +8% | 4,115 |
| 5 | Knoxville Large market, year-round demand | $31,331 | 45% | $235 | 59% | +7% | 1,162 |
| 6 | Pigeon Forge Large market, high earnings | $51,413 | 43% | $368 | 35% | +7% | 3,414 |
| 7 | Chattanooga High occupancy, large market | $31,302 | 45% | $212 | 51% | +8% | 1,086 |
| 8 | Berry Hill High earnings, high occupancy | $55,148 | 44% | $366 | 49% | +13% | 133 |
| 9 | Wears Valley High earnings, growing revenue | $55,095 | 43% | $367 | 34% | +15% | 172 |
| 10 | Pittman Center Growing revenue, high earnings | $48,407 | 41% | $346 | 39% | +18% | 289 |
| 11 | Murfreesboro High occupancy, large market | $27,561 | 44% | $215 | 52% | +14% | 381 |
| 12 | Maryville High occupancy, year-round demand | $29,034 | 50% | $185 | 56% | +17% | 126 |
| 13 | Townsend Large market, growing revenue | $36,960 | 42% | $281 | 37% | +12% | 479 |
| 14 | Gallatin High occupancy, growing revenue | $44,359 | 47% | $331 | 37% | +22% | 101 |
| 15 | Cosby Growing revenue, large market | $31,310 | 38% | $250 | 39% | +25% | 459 |
| 16 | Hendersonville High occupancy, growing revenue | $42,067 | 46% | $289 | 33% | +13% | 103 |
| 17 | Johnson City Year-round demand, high occupancy | $22,657 | 45% | $167 | 61% | −1% | 254 |
| 18 | Dandridge Growing revenue | $43,171 | 36% | $383 | 21% | +25% | 218 |
| 19 | Sevier County High earnings | $84,518 | 43% | $589 | 32% | −2% | 101 |
| 20 | Winchester Growing revenue, high earnings | $48,089 | 35% | $425 | 23% | +19% | 159 |
| 21 | Columbia Year-round demand, high occupancy | $26,432 | 43% | $208 | 55% | +5% | 150 |
| 22 | Cookeville Year-round demand, high occupancy | $21,549 | 46% | $171 | 67% | +10% | 126 |
| 23 | Kingsport Year-round demand, high occupancy | $21,944 | 45% | $179 | 60% | +8% | 137 |
| 24 | LaFollette Growing revenue, high earnings | $49,086 | 32% | $558 | 16% | +23% | 147 |
| 25 | Clarksville Year-round demand, large market | $20,935 | 41% | $183 | 66% | +1% | 464 |
| 26 | Memphis Year-round demand, large market | $20,579 | 39% | $200 | 64% | +5% | 1,733 |
| 27 | Bristol Year-round demand | $22,337 | 38% | $220 | 50% | +5% | 268 |
| 28 | Lebanon | $25,357 | 40% | $225 | 42% | +5% | 150 |
| 29 | Monteagle | $30,720 | 35% | $265 | 48% | +4% | 145 |
| 30 | Jackson Year-round demand | $16,591 | 37% | $185 | 56% | +7% | 170 |
| 31 | Smithville | $29,683 | 31% | $317 | 43% | +2% | 138 |
| 32 | Cleveland | $20,565 | 41% | $175 | 49% | −3% | 164 |
| 33 | Counce Growing revenue | $21,642 | 35% | $264 | 47% | +32% | 101 |
| 34 | Butler | $26,087 | 33% | $271 | 39% | +4% | 106 |
| 35 | Tracy City | $23,411 | 32% | $224 | 37% | +2% | 146 |
| 36 | Tellico Plains Year-round demand | $17,676 | 32% | $220 | 55% | −15% | 120 |
By measure
Tennessee Airbnb Markets Ranked by Revenue, Nightly Rate and Occupancy
The overall ranking balances five measures. These lists take one at a time, for buyers who care most about income, pricing power, bookings, a steady calendar, momentum or market size.
Highest-earning Airbnb markets in Tennessee
Average annual revenue per active listing over the past 12 months. Markets with at least 200 listings.
| # | Market | Revenue |
|---|---|---|
| Sevierville #2 overall | $60,000 | |
| Gatlinburg #4 overall | $54,900 | |
| Pigeon Forge #6 overall | $51,400 | |
| 4 | Nashville-Davidson #3 overall | $50,200 |
| 5 | Franklin #1 overall | $50,000 |
| 6 | Pittman Center #10 overall | $48,400 |
| 7 | Dandridge #18 overall | $43,200 |
| 8 | Townsend #13 overall | $37,000 |
| 9 | Knoxville #5 overall | $31,300 |
| 10 | Cosby #15 overall | $31,300 |
| 11 | Chattanooga #7 overall | $31,300 |
| 12 | Murfreesboro #11 overall | $27,600 |
| 13 | Johnson City #17 overall | $22,700 |
| 14 | Bristol #27 overall | $22,300 |
| 15 | Clarksville #25 overall | $20,900 |
| 16 | Memphis #26 overall | $20,600 |
Most expensive Airbnb markets in Tennessee by nightly rate
Average rate per booked night. A high rate earns most where occupancy holds up too. Markets with at least 200 listings.
| # | Market | Nightly |
|---|---|---|
| Sevierville #2 overall | $415 | |
| Gatlinburg #4 overall | $385 | |
| Dandridge #18 overall | $385 | |
| 4 | Pigeon Forge #6 overall | $370 |
| 5 | Nashville-Davidson #3 overall | $360 |
| 6 | Pittman Center #10 overall | $345 |
| 7 | Franklin #1 overall | $340 |
| 8 | Townsend #13 overall | $280 |
| 9 | Cosby #15 overall | $250 |
| 10 | Knoxville #5 overall | $235 |
| 11 | Bristol #27 overall | $220 |
| 12 | Murfreesboro #11 overall | $215 |
| 13 | Chattanooga #7 overall | $210 |
| 14 | Memphis #26 overall | $200 |
| 15 | Clarksville #25 overall | $185 |
| 16 | Johnson City #17 overall | $165 |
Highest-occupancy Airbnb markets in Tennessee
Share of available nights booked over the past 12 months. Markets with at least 200 listings.
| # | Market | Occupancy |
|---|---|---|
| Franklin #1 overall | 49% | |
| Chattanooga #7 overall | 45% | |
| Sevierville #2 overall | 45% | |
| 4 | Knoxville #5 overall | 45% |
| 5 | Johnson City #17 overall | 45% |
| 6 | Murfreesboro #11 overall | 44% |
| 7 | Gatlinburg #4 overall | 44% |
| 8 | Nashville-Davidson #3 overall | 44% |
| 9 | Pigeon Forge #6 overall | 43% |
| 10 | Townsend #13 overall | 42% |
| 11 | Clarksville #25 overall | 41% |
| 12 | Pittman Center #10 overall | 41% |
| 13 | Memphis #26 overall | 39% |
| 14 | Cosby #15 overall | 38% |
| 15 | Bristol #27 overall | 38% |
| 16 | Dandridge #18 overall | 36% |
Most year-round Airbnb markets in Tennessee
Revenue in the slowest month as a share of the best month, so a higher figure means steadier income. Markets with at least 200 listings.
| # | Market | Slow month |
|---|---|---|
| Clarksville #25 overall | 66% | |
| Memphis #26 overall | 64% | |
| Franklin #1 overall | 61% | |
| 4 | Johnson City #17 overall | 61% |
| 5 | Knoxville #5 overall | 59% |
| 6 | Murfreesboro #11 overall | 52% |
| 7 | Chattanooga #7 overall | 51% |
| 8 | Nashville-Davidson #3 overall | 50% |
| 9 | Bristol #27 overall | 50% |
| 10 | Cosby #15 overall | 39% |
| 11 | Pittman Center #10 overall | 39% |
| 12 | Gatlinburg #4 overall | 38% |
| 13 | Townsend #13 overall | 37% |
| 14 | Sevierville #2 overall | 35% |
| 15 | Pigeon Forge #6 overall | 35% |
| 16 | Dandridge #18 overall | 21% |
Fastest-growing Airbnb markets in Tennessee
Change in revenue per listing from the year before, among markets where it rose. Markets with at least 200 listings.
| # | Market | Change |
|---|---|---|
| Cosby #15 overall | +25% | |
| Dandridge #18 overall | +25% | |
| Franklin #1 overall | +19% | |
| 4 | Pittman Center #10 overall | +18% |
| 5 | Nashville-Davidson #3 overall | +14% |
| 6 | Murfreesboro #11 overall | +14% |
| 7 | Townsend #13 overall | +12% |
| 8 | Sevierville #2 overall | +9% |
| 9 | Gatlinburg #4 overall | +8% |
| 10 | Chattanooga #7 overall | +8% |
| 11 | Knoxville #5 overall | +7% |
| 12 | Pigeon Forge #6 overall | +7% |
| 13 | Bristol #27 overall | +5% |
| 14 | Memphis #26 overall | +5% |
| 15 | Clarksville #25 overall | +1% |
Largest Airbnb markets in Tennessee
Active listings. Bigger markets have more comparable rentals to price against and more buyers at resale.
| # | Market | Listings |
|---|---|---|
| Sevierville #2 overall | 7,520 | |
| Nashville-Davidson #3 overall | 5,310 | |
| Gatlinburg #4 overall | 4,120 | |
| 4 | Pigeon Forge #6 overall | 3,410 |
| 5 | Memphis #26 overall | 1,730 |
| 6 | Knoxville #5 overall | 1,160 |
| 7 | Chattanooga #7 overall | 1,090 |
| 8 | Townsend #13 overall | 479 |
| 9 | Clarksville #25 overall | 464 |
| 10 | Cosby #15 overall | 459 |
| 11 | Franklin #1 overall | 409 |
| 12 | Murfreesboro #11 overall | 381 |
| 13 | Pittman Center #10 overall | 289 |
| 14 | Bristol #27 overall | 268 |
| 15 | Johnson City #17 overall | 254 |
| 16 | Dandridge #18 overall | 218 |
| 17 | Wears Valley #9 overall | 172 |
| 18 | Jackson #30 overall | 170 |
| 19 | Cleveland #32 overall | 164 |
| 20 | Winchester #20 overall | 159 |
| 21 | Columbia #21 overall | 150 |
| 22 | Lebanon #28 overall | 150 |
| 23 | LaFollette #24 overall | 147 |
| 24 | Tracy City #35 overall | 146 |
| 25 | Monteagle #29 overall | 145 |
Seasonality
When Airbnbs in Tennessee Earn the Most
July is the best month for nearly six in ten ranked markets in Tennessee. January is the most common slowest month, in 22 markets.
July earns about 2.3 times what February does
Average revenue per listing across the 36 ranked markets in Tennessee, by month
| Month | Avg. revenue per listing | Best month for | Highest-ranked examples |
|---|---|---|---|
| January | $2,980 | – | – |
| February | $2,830 | – | – |
| March | $4,820 | – | – |
| April | $4,190 | – | – |
| May | $4,660 | 3 markets | Nashville-Davidson, Memphis, Jackson |
| June | $6,450 | 8 markets | Franklin, Murfreesboro, Maryville |
| July | $6,630 | 21 markets | Sevierville, Gatlinburg, Pigeon Forge |
| August | $4,710 | – | – |
| September | $4,390 | 1 market | Knoxville |
| October | $5,770 | 3 markets | Berry Hill, Townsend, Tellico Plains |
| November | $4,710 | – | – |
| December | $5,450 | – | – |
Average revenue is per listing across the ranked markets, the line in the chart above. "Best month for" counts the ranked markets whose own revenue peaks in that month.
Named regions
Regions in Tennessee
These pages compare the towns of a region that people search by name, with figures for the region as a whole.
- Smoky Mountains 8 towns
Management
Who Manages Airbnbs in Tennessee?
AirROI ranks the 50 largest of the 376 companies that run 5 or more Airbnb listings in Tennessee, by listings, guest rating and growth; companies run 36% of its listings.
Method
How the Ranking Works
The ranking covers the 36 markets in Tennessee with at least 100 active Airbnb listings and data through October 2026. Each market is compared with the others on five measures, and markets are ordered by a weighted blend of where they place on each:
- Revenue per listing (35%): average revenue an active listing earned over the past 12 months.
- Occupancy (20%): share of available nights that were booked.
- Market size (20%): active listings. Bigger markets offer more comparable rentals to price against and more buyers when you sell.
- Year-round demand (15%): revenue in the slowest month as a share of the best month. The latest month is left out when its bookings look incomplete.
- Growth (10%): change in revenue per listing from the year before. Markets whose boundaries changed between years are scored in the middle.
Left out: 20 markets whose data predate the latest refresh and 2 towns listed a second time under another spelling. The score measures how rentals perform. It does not include purchase prices, financing, operating costs or local short-term rental rules, which vary by address and should be checked before buying. Figures are in US dollars and match each market's own report; see the data methodology for how listings are tracked.
To check one property before buying, run its address and size through the Airbnb income calculator for a revenue, occupancy and nightly-rate range from comparable listings.
FAQ
Frequently Asked Questions About Airbnb Investing in Tennessee
What is the best place to buy an Airbnb in Tennessee?
Franklin ranks first of the 36 markets in Tennessee in AirROI's ranking, with $50,000 in average revenue per listing and 49% occupancy. Sevierville and Nashville-Davidson follow. The ranking weighs revenue, occupancy, market size, seasonality and growth; it leaves out purchase prices.
What are the most profitable Airbnb locations in Tennessee?
By revenue per listing, among markets with at least 200 listings, Sevierville leads at $60,000 a year, ahead of Gatlinburg at $54,900. Profit also depends on what a property costs to buy and run, which varies far more between markets than revenue does.
How much does an Airbnb make in Tennessee?
The average active listing in Tennessee earned $44,600 over the 12 months to October 2026, at 43% occupancy. Across the ranked markets, the middle half averaged between $22,300 and $48,400 per listing. Averages include listings that operated for only part of the year, so a listing rented all year typically earns more.
What is a good Airbnb occupancy rate in Tennessee?
The average listing in Tennessee was booked on 43% of available nights over the past 12 months. Half of the ranked markets fall between 36% and 45%, so a market above about 45% sits in the top quarter. Occupancy is only half the picture: a market with lower occupancy can still earn more if its nightly rates are higher.
Where is Airbnb demand highest in Tennessee?
Among ranked markets with at least 200 listings, Franklin has the highest occupancy, with 49% of available nights booked, followed by Chattanooga at 45%. Its listings average about $340 a night and $50,000 a year.
Where are Airbnb nightly rates highest in Tennessee?
Among ranked markets with at least 200 listings, Sevierville has the highest average nightly rate, about $415, followed by Gatlinburg at $385. Johnson City is the least expensive, at about $165. The average booked night in Tennessee costs about $335.
What is the best month for Airbnb in Tennessee?
July is the highest-earning month for 21 of the 36 ranked markets, followed by June (8). January is the most common slowest month, in 22 of the 36 markets. Each market's report shows its own month-by-month revenue, occupancy and rates.
Which Airbnb markets in Tennessee earn the most evenly through the year?
Among ranked markets with at least 200 listings, Clarksville has the steadiest income: its slowest month, January, still earns about two-thirds of its best. Memphis follows, at 64%. Steadier markets are easier to budget for, though they do not always earn the most per listing.
Which Airbnb markets are growing fastest in Tennessee?
Among ranked markets with at least 200 listings, revenue per listing grew most in Cosby, up 25% on the year before, and in Dandridge, up 25%. A single strong year can reflect events or new supply, so it is worth checking a market's monthly trend before relying on it.
Is Airbnb still profitable in Tennessee in 2026?
Revenue per listing grew in 32 of the 36 ranked markets with a comparable year of data; in the typical market it rose 8%. Whether a given property profits depends on its purchase price, financing and running costs.
What are the best smaller Airbnb markets in Tennessee?
Among ranked markets with fewer than 150 active listings, Berry Hill (#8 overall, $55,100 per listing), Maryville (#12, $29,000) and Gallatin (#14, $44,400) place highest. Smaller markets have fewer comparable rentals to price against, so their averages can move more from year to year.
How many Airbnb listings are there in Tennessee?
AirROI tracked 38,500 active Airbnb listings in Tennessee over the 12 months to October 2026, across 169 markets. The largest ranked market is Sevierville, with 7,520 listings, followed by Nashville-Davidson with 5,310.
Directory
All 169 Airbnb Markets in Tennessee
Every Tennessee city with an AirROI Airbnb market report, A–Z, with its active listing count.
A
- Alcoa 28 listings
- Altamont 44 listings
- Andersonville 28 listings
- Ashland City 41 listings
- Athens 28 listings
B
- Baxter 48 listings
- Bean Station 39 listings
- Benton 54 listings
- Berry Hill 133 listings
- Blountville 29 listings
- Bluff City 36 listings
- Brentwood 26 listings
- Bristol 268 listings
- Bristol City 49 listings
- Buchanan 22 listings
- Butler 106 listings
- Byrdstown 77 listings
C
- Camden 34 listings
- Caryville 24 listings
- Celina 32 listings
- Centerville 23 listings
- Chattanooga 1,086 listings
- Clarksville 464 listings
- Cleveland 164 listings
- Clifton 23 listings
- Clinton 19 listings
- College Grove 18 listings
- Collegedale 27 listings
- Columbia 150 listings
- Cookeville 126 listings
- Copperhill 45 listings
- Cosby 459 listings
- Counce 101 listings
- Crossville 94 listings
D
E
- East Ridge 34 listings
- Elizabethton 86 listings
- Erwin 40 listings
- Estill Springs 24 listings
F
- Fairfield Glade 61 listings
- Fairview 20 listings
- Farragut 27 listings
- Fayetteville 37 listings
- Flag Pond 17 listings
- Franklin 409 listings
G
- Gainesboro 18 listings
- Gallatin 101 listings
- Gatlinburg 4,115 listings
- Goodlettsville 46 listings
- Greeneville 79 listings
H
- Hampton 23 listings
- Harriman 23 listings
- Harrison 22 listings
- Harrogate 22 listings
- Hartford 18 listings
- Henderson 18 listings
- Hendersonville 103 listings
- Hohenwald 20 listings
- Hornbeak 23 listings
- Huntsville 42 listings
J
- Jacksboro 24 listings
- Jackson 170 listings
- Jamestown 61 listings
- Jefferson City 39 listings
- Johnson City 254 listings
- Jonesborough 62 listings
K
- Kingsport 137 listings
- Kingston 24 listings
- Kingston Springs 35 listings
- Knoxville 1,162 listings
- Kodak 29 listings
L
- La Follette 36 listings
- La Vergne 29 listings
- LaFollette 147 listings
- Lakeland 18 listings
- Lawrenceburg 34 listings
- Lebanon 150 listings
- Lenoir City 42 listings
- Lewisburg 18 listings
- Lexington 23 listings
- Linden 30 listings
- Livingston 41 listings
- Lobelville 23 listings
- Loudon 28 listings
- Louisville 31 listings
- Lynchburg, Moore County 28 listings
M
- Manchester 43 listings
- Martin 29 listings
- Maryville 126 listings
- Maynardville 29 listings
- McEwen 29 listings
- McMinnville 64 listings
- Memphis 1,733 listings
- Millersville 18 listings
- Monteagle 145 listings
- Monterey 27 listings
- Morristown 32 listings
- Mount Juliet 51 listings
- Mountain City 49 listings
- Mt. Juliet 51 listings
- Murfreesboro 381 listings
N
- Nashville 3,336 listings
- Nashville-Davidson 5,305 listings
- New Tazewell 51 listings
- Newport 96 listings
O
- Oak Ridge 81 listings
- Ocoee 25 listings
- Oliver Springs 64 listings
- Oneida 33 listings
- Ooltewah 28 listings
P
- Paris 20 listings
- Pegram 18 listings
- Pelham 44 listings
- Pigeon Forge 3,414 listings
- Pikeville 50 listings
- Piney Flats 23 listings
- Pittman Center 289 listings
- Pleasantville 19 listings
- Powell 32 listings
- Powells Crossroads 17 listings
- Pulaski 19 listings
R
- Reliance 23 listings
- Roan Mountain 61 listings
- Rock Island 22 listings
- Rogersville 26 listings
S
- Savannah 41 listings
- Sevier County 101 listings
- Sevierville 7,523 listings
- Sewanee 65 listings
- Seymour 54 listings
- Shelby County 22 listings
- Shelbyville 44 listings
- Signal Mountain 45 listings
- Silver Point 30 listings
- Smithville 138 listings
- Smyrna 24 listings
- Sneedville 18 listings
- Soddy-Daisy 43 listings
- South Pittsburg 20 listings
- Sparta 91 listings
- Speedwell 28 listings
- Spencer 41 listings
- Spring City 67 listings
- Spring Hill 66 listings
- Springfield 27 listings
- Springville 79 listings
- Sweetwater 30 listings
T
- Tallassee 37 listings
- Tellico Plains 120 listings
- Tellico Village 33 listings
- Ten Mile 38 listings
- Thompson's Station 36 listings
- Townsend 479 listings
- Tracy City 146 listings
- Tullahoma 70 listings
U
- Union City 24 listings
W
- Walland 43 listings
- Waverly 26 listings
- Wears Valley 172 listings
- Whitwell 40 listings
- Winchester 159 listings