AirROI ranking · 2026111 markets ranked
Best Places to Buy an Airbnb in North Carolina (2026)
Asheville is the best place to buy an Airbnb in North Carolina in 2026, according to AirROI's ranking of 111 markets. Its listings averaged $38,300 in revenue over the 12 months to October 2026 and were booked on 45% of nights. It leads on the blend rather than on any one measure, placing in the top 5% of ranked markets for market size and revenue growth and the top 10% for occupancy. Mooresville and Swannanoa come next.
- Markets tracked
- 298
- Active Airbnb listings
- 53,200
- Avg. revenue per listing
- $34,600
- Occupancy rate
- 40%
- Avg. nightly rate
- $320
- Revenue change, typical market
- +15%
The short answer
North Carolina Airbnb Market at a Glance
Across North Carolina, the 53,200 active Airbnb listings tracked by AirROI, a short-term-rental data firm, averaged $34,600 over the same period. They were booked on 40% of nights at about $320 a night; the ranking covers the 111 markets with at least 100 active listings. Revenue per listing rose in 104 of the 110 ranked markets with a comparable year of data, by 15% in the typical one.
The biggest earners pay for it in seasonality. Mooresville, Denver and Currituck County earn the most per listing of the ranked markets, but their slowest month brings in 12–25% of their best. The steadiest markets, led by Gastonia and Chapel Hill, earn less per listing and still take in about 71% of their peak revenue in their quietest month.
The ranking weighs revenue per listing most, then occupancy and market size, then how evenly income spreads across the year and how it changed on the year. It reflects rental performance, not purchase prices or local short-term rental rules. How the ranking works.
Where the top 10 Airbnb markets in North Carolina are
Each dot is one of the 298 markets AirROI tracks in North Carolina, sized by active listings and coloured by average revenue per listing. Select a number to jump to its profile.
Top 10
The Top 10 Airbnb Markets in North Carolina
Each profile draws on the market's full AirROI report: how it earns, when in the year, who books and what sells. Monthly figures are averages per listing active in that month, so twelve of them add up to more than the annual average, which also counts listings that operated for only part of the year.
| # | Market | Avg. revenue | Occupancy |
|---|---|---|---|
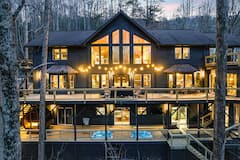 Asheville Large market · Growing revenue | $38,300 | 45% | |
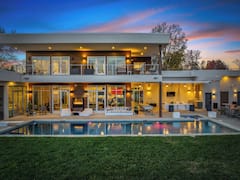 Mooresville High earnings · Large market | $79,200 | 41% | |
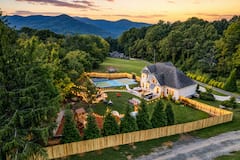 Swannanoa Growing revenue · High occupancy | $40,000 | 45% | |
| 4 | 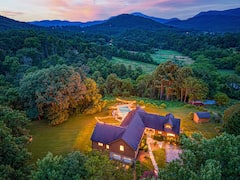 Fairview Growing revenue · High earnings | $51,300 | 42% |
| 5 | 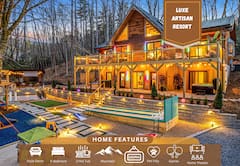 Black Mountain Growing revenue · Large market | $39,200 | 41% |
| 6 | 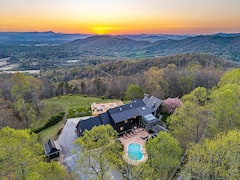 Fletcher Growing revenue · High occupancy | $55,500 | 47% |
| 7 | 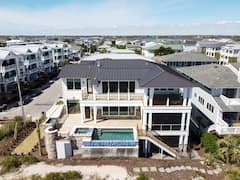 Wrightsville Beach High earnings · Large market | $63,400 | 40% |
| 8 | 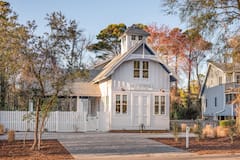 Kitty Hawk High occupancy · High earnings | $48,900 | 44% |
| 9 |  Leicester High occupancy · Growing revenue | $46,200 | 44% |
| 10 |  Candler Growing revenue · High earnings | $38,400 | 41% |
1. Asheville
Known for: Large market · Growing revenue
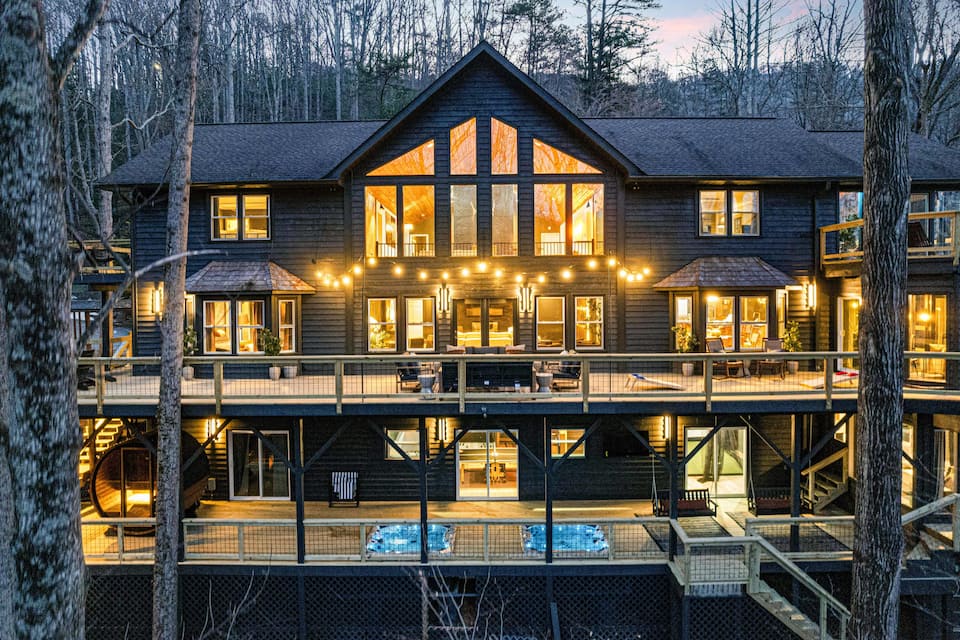
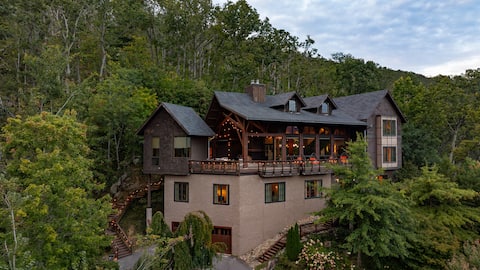
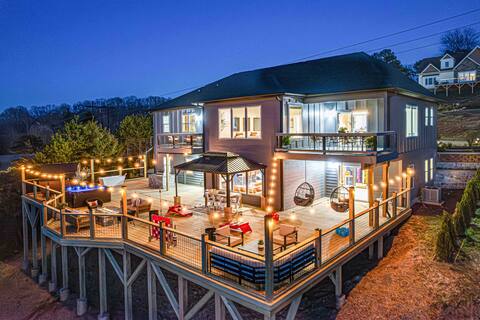
Top-earning Airbnb listings in Asheville - Avg. revenue
- $38,300 +51% vs. last year
- Occupancy
- 45%
- Nightly rate
- $270
- Active listings
- 1,840
Where it places among the 111 ranked markets in North Carolina
- Revenue Top 31%
- Occupancy Top 6%
- Market size Top 2%
- Year-round Top 29%
- Growth Top 4%
- How it earns
- Asheville earns on volume. Rates run below the North Carolina average at about $270 a night, but listings book 45% of nights. That adds up to $38,300 per listing over the year, 11% above the North Carolina average. A typical listing takes in about $2,960 a month; the top quarter clear $5,200 or more. Revenue per listing rose 51% over the year, helped by nightly rates 15% higher.
- When it earns
- Asheville's season runs from May to October, peaking in July at about $4,770 per listing; February, the quietest month, brings in about $2,410.
- What sells
- Smaller places set the market: only 34% of entire homes have three or more bedrooms, against about 53% in the typical market in North Carolina.
- Who it suits
- It suits buyers who would rather price for occupancy than for rate and prefer a smaller one- or two-bedroom place.
Revenue per listing by month
$4,770 $2,410- Median listing
- $2,960/mo
- Top 25% of listings
- $5,200+/mo
- Booked ahead
- 45 days
- Average stay
- 5 nights
- Most common home size
- 1 bedroom
- Superhosts
- 77%
Areas in the full report: Downtown Asheville · West Asheville · North Asheville
Full Asheville Airbnb report2. Mooresville
Known for: High earnings · Large market
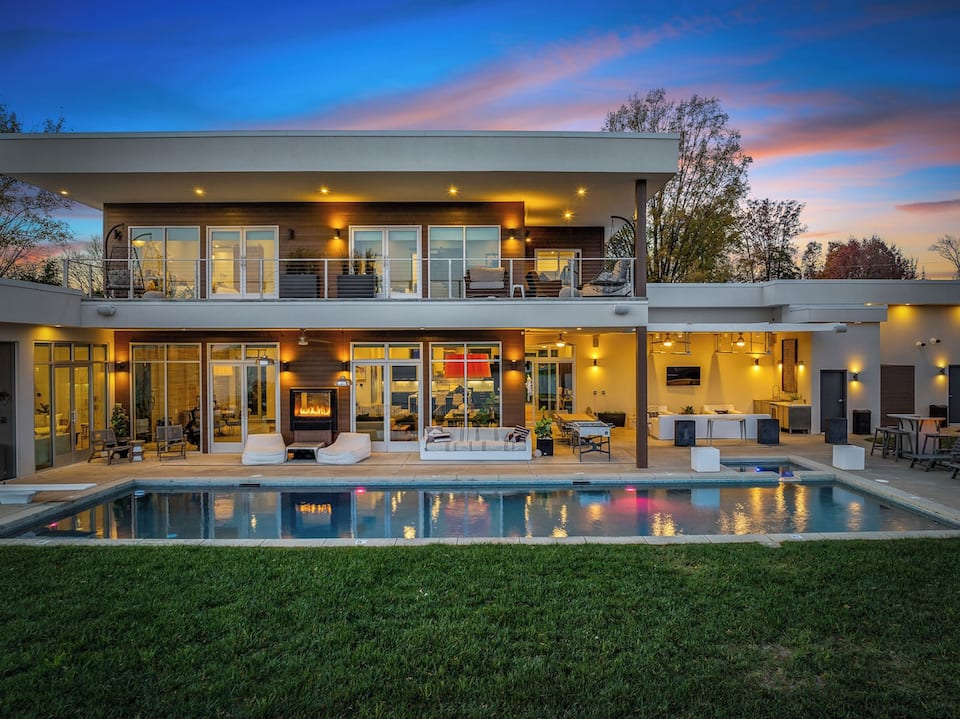
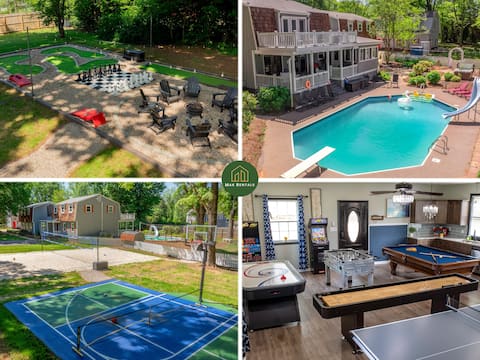
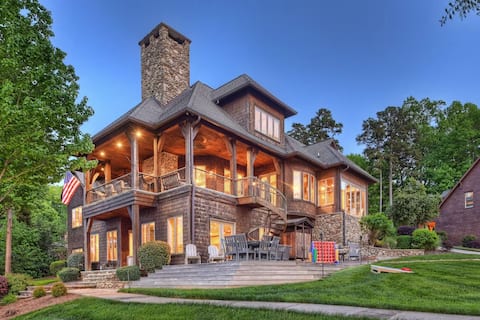
Top-earning Airbnb listings in Mooresville - Avg. revenue
- $79,200 +20% vs. last year
- Occupancy
- 41%
- Nightly rate
- $645
- Active listings
- 391
Where it places among the 111 ranked markets in North Carolina
- Revenue Top 1%
- Occupancy Top 31%
- Market size Top 31%
- Year-round Bottom 27%
- Growth Top 31%
- How it earns
- Mooresville earns on price: guests pay about $645 a night, about twice the North Carolina average. Listings averaged $79,200 in revenue over the year, the highest of the 111 ranked markets. The gap between listings is wide: a typical one takes in about $5,530 a month, while the top quarter clear $11,400 and the top 10% $19,500, so pricing and presentation count for more here than in most of North Carolina. Revenue per listing rose 20% over the year, helped by nightly rates 24% higher, even as the number of listings grew 15%.
- When it earns
- Revenue in Mooresville concentrates from May to August: July earns about $16,200 per listing, about 4.3 times as much as January.
- What sells
- Big homes set the market: 78% of entire homes have three or more bedrooms, against about 53% in the typical market in North Carolina, and houses make up 84% of supply.
- Who it suits
- Best for buyers who can furnish and price for a premium stay and can carry costs through a quiet January.
Revenue per listing by month
$16,200 $3,780- Median listing
- $5,530/mo
- Top 25% of listings
- $11,400+/mo
- Booked ahead
- 60 days
- Average stay
- 5 nights
- Most common home size
- 3 bedrooms
- Superhosts
- 74%
Areas in the full report: Lake Norman · Downtown Mooresville · The Point
Full Mooresville Airbnb report3. Swannanoa
Known for: Growing revenue · High occupancy
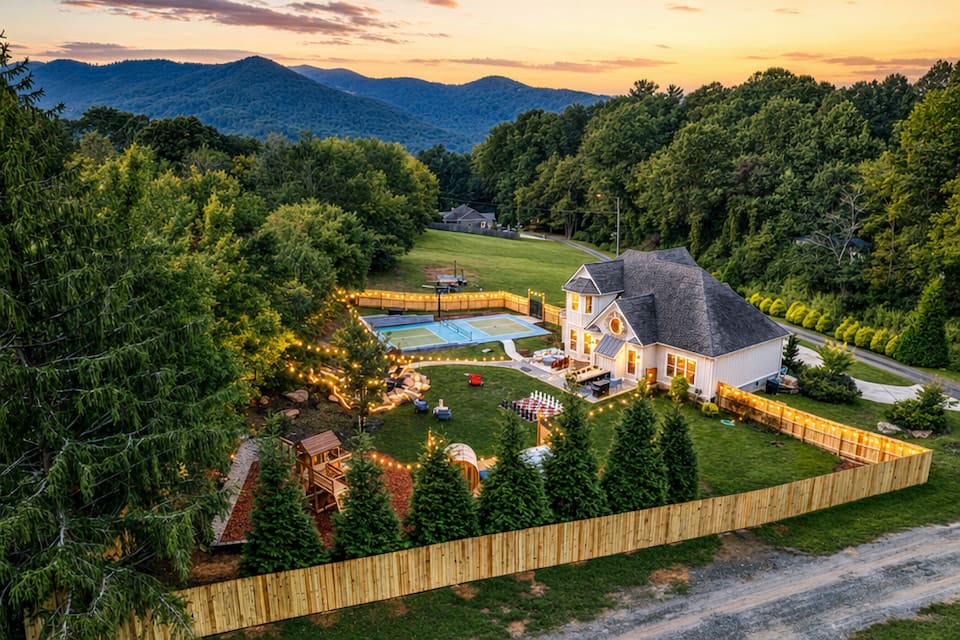
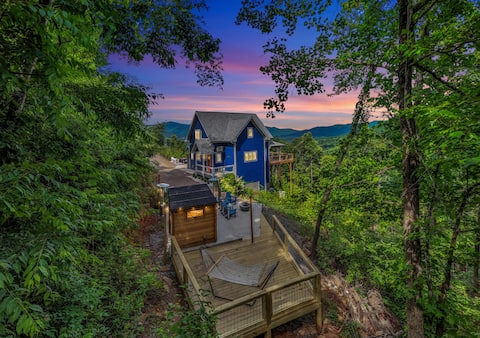
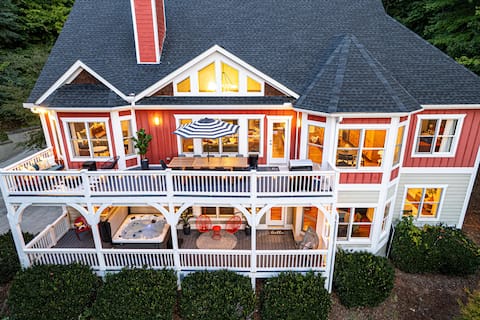
Top-earning Airbnb listings in Swannanoa - Avg. revenue
- $40,000 +58% vs. last year
- Occupancy
- 45%
- Nightly rate
- $265
- Active listings
- 167
Where it places among the 111 ranked markets in North Carolina
- Revenue Top 26%
- Occupancy Top 5%
- Market size Bottom 39%
- Year-round Top 29%
- Growth Top 3%
- How it earns
- Rates in Swannanoa sit below the North Carolina average, at about $265 a night, but listings are booked on 45% of nights. Average revenue per listing came to $40,000, 16% above the North Carolina average. The gap between listings is wide: a typical one takes in about $2,690 a month, while the top quarter clear $5,400 and the top 10% $9,800, so pricing and presentation count for more here than in most of North Carolina. Revenue per listing rose 58% over the year, the third-biggest gain in North Carolina, helped by nightly rates 23% higher. With 167 listings it is a small market, so its averages can move more from year to year.
- When it earns
- In Swannanoa, the months from May to October earn above the yearly average, led by July at about $4,990 per listing; February is the low point at about $2,560. Most hosts take one- or two-night bookings (87% of listings), more than in the typical market.
- What sells
- The most common entire home has 1 bedroom (28% of entire homes), and houses make up 69% of supply.
- Who it suits
- A good fit for buyers who would rather price for occupancy than for rate.
Revenue per listing by month
$4,990 $2,560- Median listing
- $2,690/mo
- Top 25% of listings
- $5,400+/mo
- Booked ahead
- 45 days
- Average stay
- 5 nights
- Most common home size
- 1 bedroom
- Superhosts
- 78%
4. Fairview
Known for: Growing revenue · High earnings
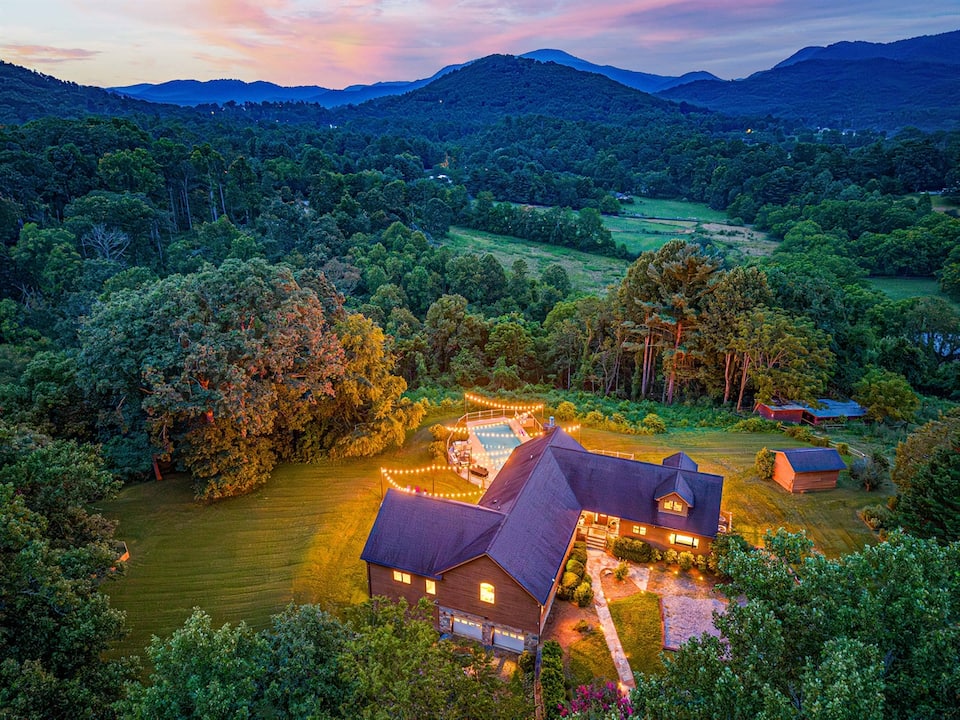


Top-earning Airbnb listings in Fairview - Avg. revenue
- $51,300 +51% vs. last year
- Occupancy
- 42%
- Nightly rate
- $370
- Active listings
- 226
Where it places among the 111 ranked markets in North Carolina
- Revenue Top 14%
- Occupancy Top 28%
- Market size Top 50%
- Year-round Top 47%
- Growth Top 6%
- How it earns
- Fairview listings charge about $370 a night, 16% above the North Carolina average, and are booked on 42% of nights. That adds up to $51,300 per listing over the year, 48% above the North Carolina average. In a typical month the median listing brings in about $3,870, and the best quarter clear $6,730. Revenue per listing rose 51% over the year, helped by nightly rates 19% higher. Its 226 listings make it one of the smaller ranked markets, so its figures are less settled than those of larger ones.
- When it earns
- Fairview's season runs from June to August, peaking in July at about $6,960 per listing; February, the quietest month, brings in about $2,980.
- What sells
- Three-bedroom homes lead the market (26% of entire homes), and houses make up 66% of supply.
Revenue per listing by month
$6,960 $2,980- Median listing
- $3,870/mo
- Top 25% of listings
- $6,730+/mo
- Booked ahead
- 53 days
- Average stay
- 4 nights
- Most common home size
- 3 bedrooms
- Superhosts
- 79%
5. Black Mountain
Known for: Growing revenue · Large market
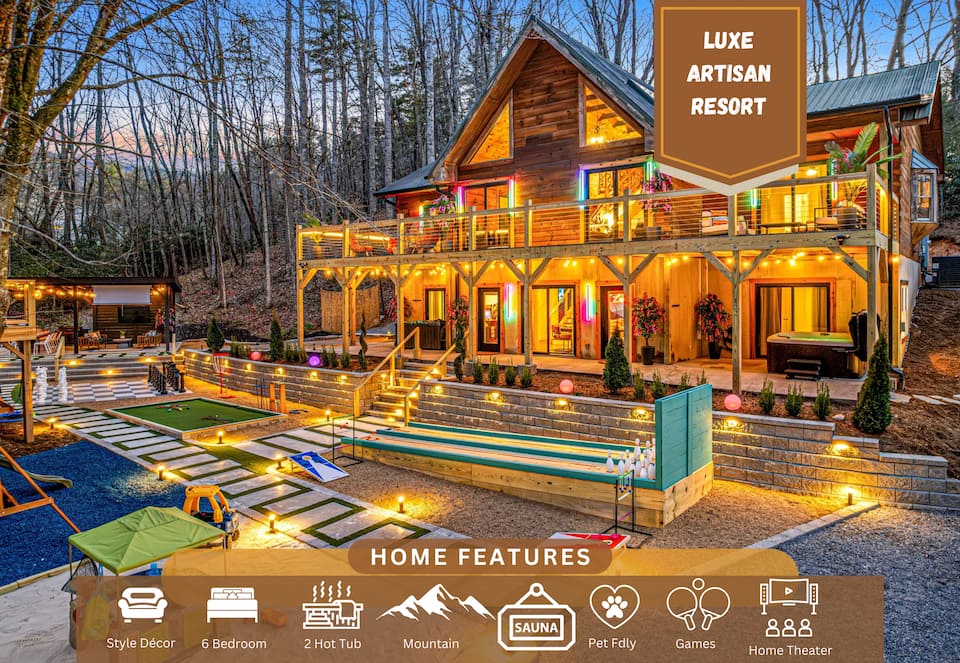

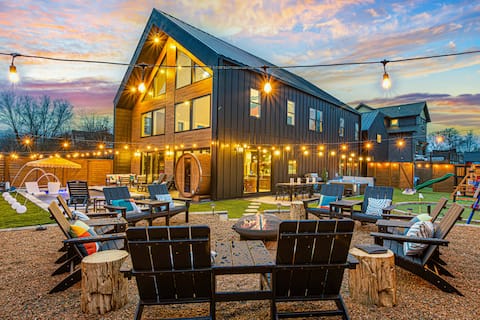
Top-earning Airbnb listings in Black Mountain - Avg. revenue
- $39,200 +38% vs. last year
- Occupancy
- 41%
- Nightly rate
- $320
- Active listings
- 518
Where it places among the 111 ranked markets in North Carolina
- Revenue Top 28%
- Occupancy Top 32%
- Market size Top 23%
- Year-round Top 39%
- Growth Top 10%
- How it earns
- Black Mountain books 41% of nights at about $320 a night, close to the typical market in North Carolina. Listings averaged $39,200 in revenue over the year, 13% above the North Carolina average. Month to month, the median listing earns about $3,300 and a top-quarter listing $5,620 or more. Revenue per listing rose 38% over the year, helped by nightly rates 15% higher.
- When it earns
- Revenue in Black Mountain concentrates from June to August: July earns about $5,400 per listing, about twice as much as February.
- What sells
- The most common entire home has 2 bedrooms (29% of entire homes), and houses make up 65% of supply.
Revenue per listing by month
$5,400 $2,580- Median listing
- $3,300/mo
- Top 25% of listings
- $5,620+/mo
- Booked ahead
- 48 days
- Average stay
- 4 nights
- Most common home size
- 2 bedrooms
- Superhosts
- 79%
Areas in the full report: Downtown Black Mountain · Montreat · Swannanoa
Full Black Mountain Airbnb report6. Fletcher
Known for: Growing revenue · High occupancy
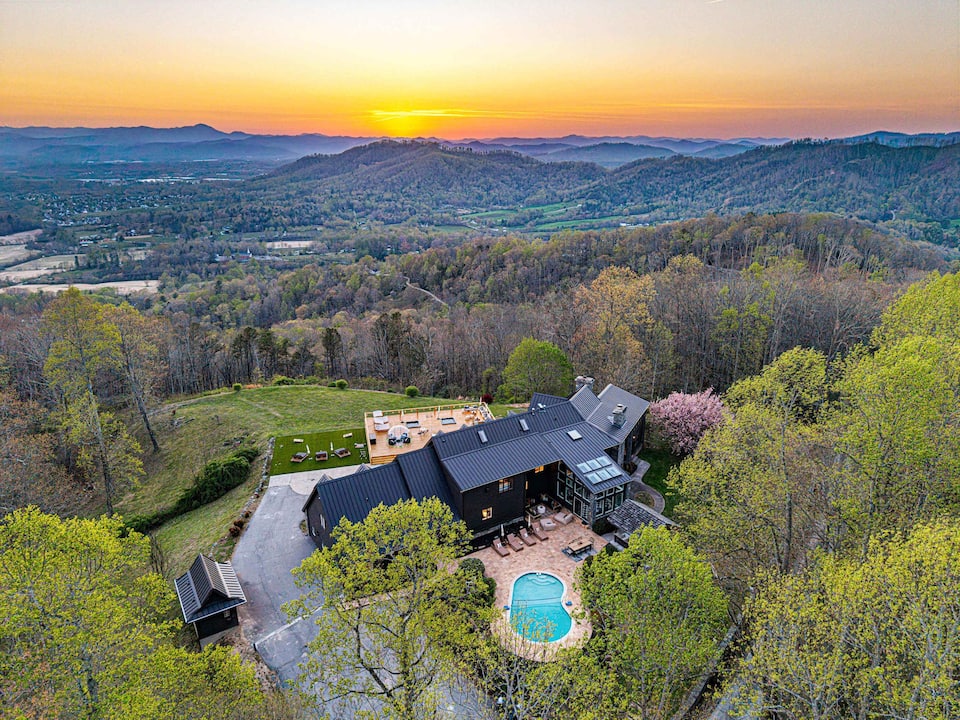

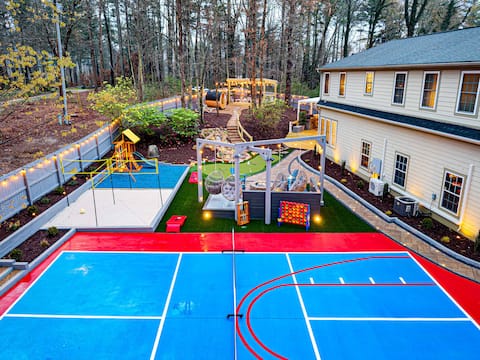
Top-earning Airbnb listings in Fletcher - Avg. revenue
- $55,500 +71% vs. last year
- Occupancy
- 47%
- Nightly rate
- $365
- Active listings
- 130
Where it places among the 111 ranked markets in North Carolina
- Revenue Top 10%
- Occupancy Top 3%
- Market size Bottom 23%
- Year-round Bottom 43%
- Growth Top 1%
- How it earns
- Fletcher fills more nights than most of North Carolina: 47% of them, the third-highest occupancy of the 111 ranked markets, at about $365 a night. Average revenue per listing came to $55,500, the tenth-highest of the 111 ranked markets. A typical listing takes in about $3,630 a month; the top quarter clear $6,130 or more. Revenue per listing rose 71% over the year, the biggest gain in North Carolina, helped by nightly rates 35% higher. With 130 listings it is a small market, so its averages can move more from year to year.
- When it earns
- In Fletcher, the months from June to October earn above the yearly average, led by July at about $8,230 per listing; February is the low point at about $3,120.
- What sells
- Three-bedroom homes lead the market (34% of entire homes), and houses make up 70% of supply.
- Who it suits
- It suits buyers who can ride out a slow February.
Revenue per listing by month
$8,230 $3,120- Median listing
- $3,630/mo
- Top 25% of listings
- $6,130+/mo
- Booked ahead
- 53 days
- Average stay
- 5 nights
- Most common home size
- 3 bedrooms
- Superhosts
- 72%
7. Wrightsville Beach
Known for: High earnings · Large market
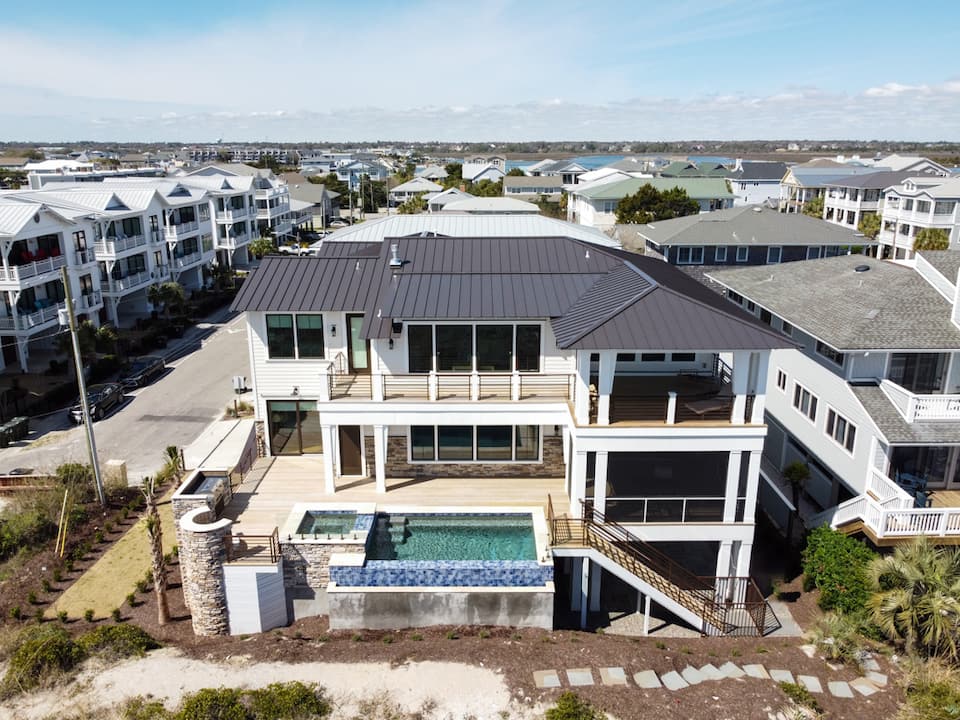

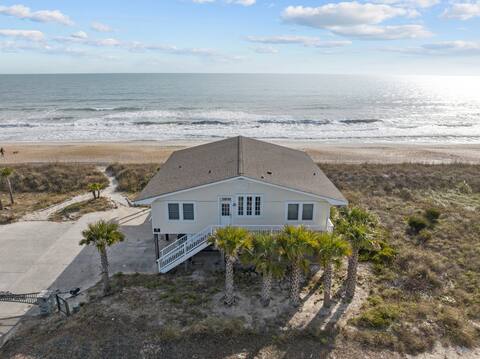
Top-earning Airbnb listings in Wrightsville Beach - Avg. revenue
- $63,400 +13% vs. last year
- Occupancy
- 40%
- Nightly rate
- $580
- Active listings
- 516
Where it places among the 111 ranked markets in North Carolina
- Revenue Top 4%
- Occupancy Top 39%
- Market size Top 24%
- Year-round Bottom 24%
- Growth Bottom 48%
- How it earns
- Nightly rates set Wrightsville Beach apart: about $580, 83% above the North Carolina average. That adds up to $63,400 per listing over the year, the fourth-highest of the 111 ranked markets. In a typical month the median listing brings in about $5,770, and the best quarter clear $9,590. Revenue per listing rose 13% over the year, helped by nightly rates 8% higher.
- When it earns
- Wrightsville Beach's season runs from May to September, peaking in July at about $13,900 per listing; January, the quietest month, brings in about $2,860. Guests book early, about 75 days ahead against roughly 51 for the typical market in North Carolina, and stay about 5 nights.
- The competition
- Professional managers run 62% of listings, against about 24% in the typical market in North Carolina, and the largest operator runs 116 listings, so new hosts compete with polished operations.
- Guest expectations
- Average ratings (4.75 stars) trail the typical market in North Carolina (4.87), which leaves room for a well-run listing to stand out.
- Who it suits
- Best for buyers who are prepared for thin bookings around January and can furnish and price for a premium stay.
Revenue per listing by month
$13,900 $2,860- Median listing
- $5,770/mo
- Top 25% of listings
- $9,590+/mo
- Booked ahead
- 75 days
- Average stay
- 5 nights
- Most common home size
- 3 bedrooms
- Superhosts
- 50%
Areas in the full report: Johnnie Mercers Fishing Pier · Wrightsville Beach Loop · Motts Channel
Full Wrightsville Beach Airbnb report8. Kitty Hawk
Known for: High occupancy · High earnings
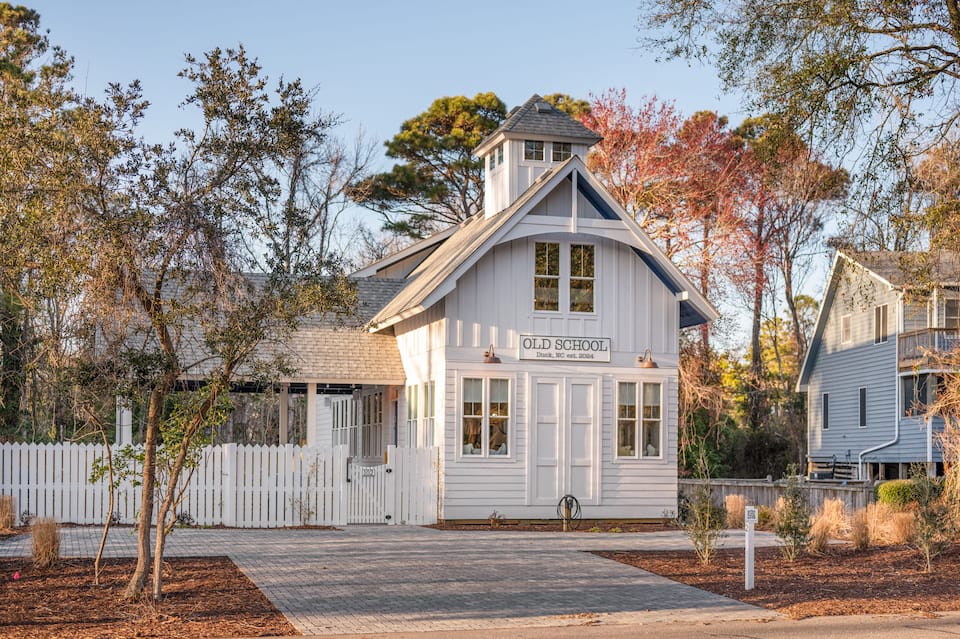
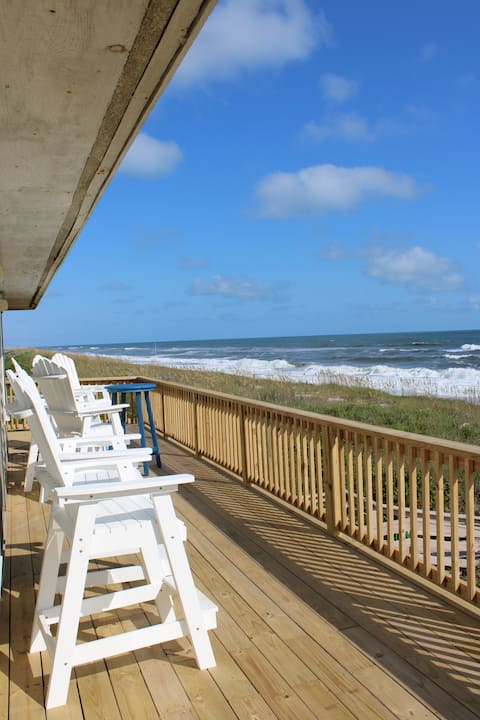
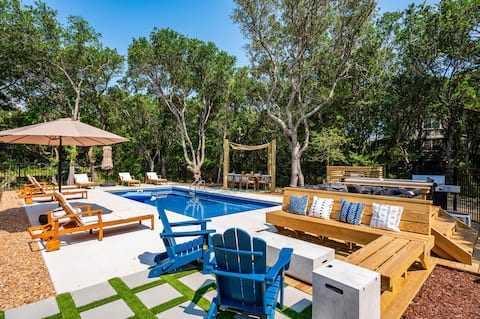
Top-earning Airbnb listings in Kitty Hawk - Avg. revenue
- $48,900 +17% vs. last year
- Occupancy
- 44%
- Nightly rate
- $400
- Active listings
- 444
Where it places among the 111 ranked markets in North Carolina
- Revenue Top 18%
- Occupancy Top 11%
- Market size Top 29%
- Year-round Bottom 19%
- Growth Top 42%
- How it earns
- Listings in Kitty Hawk are booked on 44% of nights, 4 points above the North Carolina average, at about $400 a night. Listings averaged $48,900 in revenue over the year, 41% above the North Carolina average. Month to month, the median listing earns about $4,280 and a top-quarter listing $7,540 or more. Revenue per listing rose 17% over the year, helped by nightly rates 17% higher, even as the number of listings grew 20%.
- When it earns
- Revenue in Kitty Hawk concentrates from May to September: July earns about $12,000 per listing, about 5.3 times as much as January. Bookings arrive well in advance, about 69 days before check-in, so much of a season's calendar fills early; stays average 5 nights.
- What sells
- The most common entire home has 4 bedrooms (24% of entire homes), and houses make up 73% of supply.
- Who it suits
- A good fit for buyers who can carry costs through a quiet January.
Revenue per listing by month
$12,000 $2,240- Median listing
- $4,280/mo
- Top 25% of listings
- $7,540+/mo
- Booked ahead
- 69 days
- Average stay
- 5 nights
- Most common home size
- 4 bedrooms
- Superhosts
- 62%
Areas in the full report: Nags Head Woods · Avalon · Ocean View
Full Kitty Hawk Airbnb report9. Leicester
Known for: High occupancy · Growing revenue
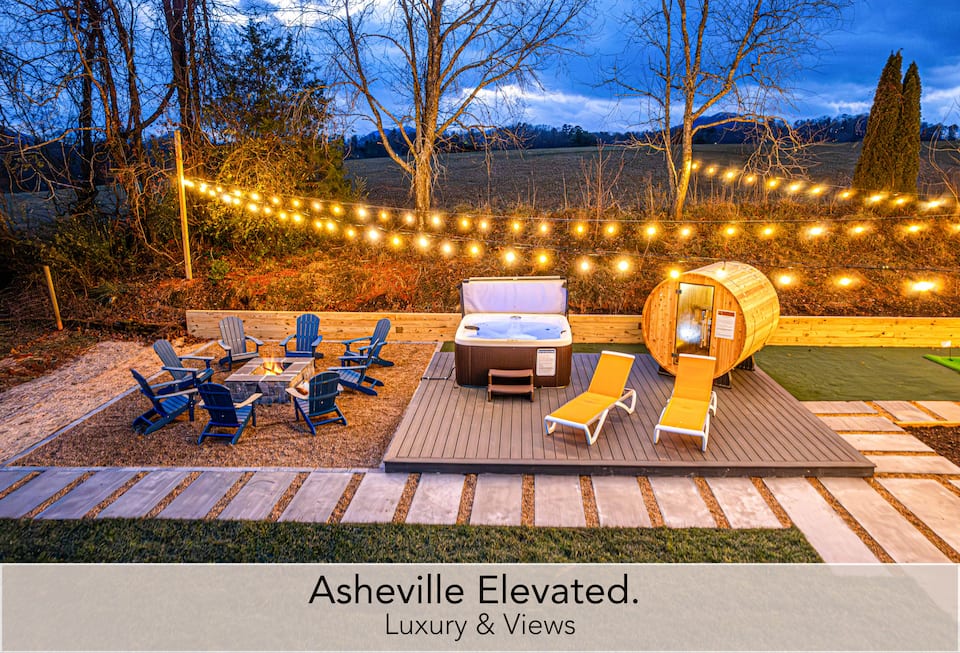
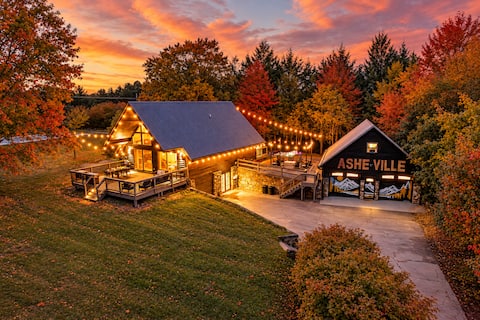

Top-earning Airbnb listings in Leicester - Avg. revenue
- $46,200 +36% vs. last year
- Occupancy
- 44%
- Nightly rate
- $325
- Active listings
- 134
Where it places among the 111 ranked markets in North Carolina
- Revenue Top 20%
- Occupancy Top 9%
- Market size Bottom 27%
- Year-round Bottom 47%
- Growth Top 13%
- How it earns
- Demand runs high in Leicester: 44% of nights booked, the ninth-highest occupancy of the 111 ranked markets, at about $325 a night. Average revenue per listing came to $46,200, 34% above the North Carolina average. The gap between listings is wide: a typical one takes in about $3,170 a month, while the top quarter clear $6,210 and the top 10% $13,400, so pricing and presentation count for more here than in most of North Carolina. Revenue per listing rose 36% over the year, helped by nightly rates 20% higher. Its 134 listings make it one of the smaller ranked markets, so its figures are less settled than those of larger ones.
- When it earns
- In Leicester, the months from June to October earn above the yearly average, led by July at about $6,900 per listing; February is the low point at about $2,750.
- What sells
- Three-bedroom homes lead the market (30% of entire homes), and houses make up 62% of supply.
- Who it suits
- It suits buyers who can ride out a slow February.
Revenue per listing by month
$6,900 $2,750- Median listing
- $3,170/mo
- Top 25% of listings
- $6,210+/mo
- Booked ahead
- 54 days
- Average stay
- 5 nights
- Most common home size
- 3 bedrooms
- Superhosts
- 70%
10. Candler
Known for: Growing revenue · High earnings
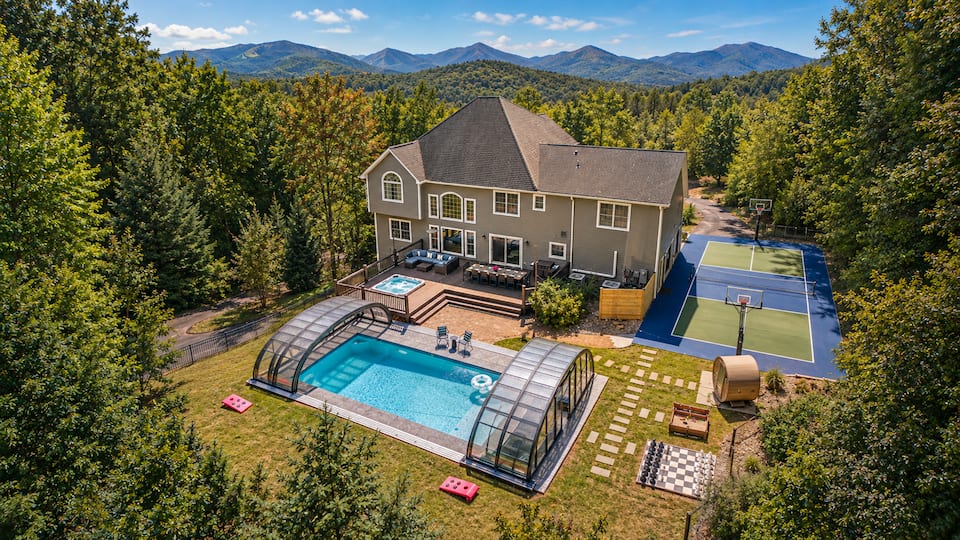
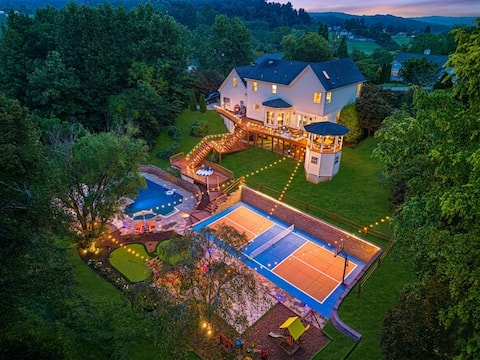

Top-earning Airbnb listings in Candler - Avg. revenue
- $38,400 +30% vs. last year
- Occupancy
- 41%
- Nightly rate
- $280
- Active listings
- 279
Where it places among the 111 ranked markets in North Carolina
- Revenue Top 29%
- Occupancy Top 30%
- Market size Top 43%
- Year-round Top 42%
- Growth Top 19%
- How it earns
- Candler books 41% of nights at about $280 a night, close to the typical market in North Carolina. That adds up to $38,400 per listing over the year, 11% above the North Carolina average. A typical listing takes in about $2,970 a month; the top quarter clear $5,000 or more. Revenue per listing rose 30% over the year, helped by nightly rates 20% higher. With 279 listings it is a small market, so its averages can move more from year to year.
- When it earns
- Candler's season runs from June to December, peaking in July at about $5,190 per listing; February, the quietest month, brings in about $2,430. Stays are shorter than in most of North Carolina, about 4 nights, so listings turn over often; guests book about 48 days ahead. Most hosts take one- or two-night bookings (86% of listings), more than in the typical market.
- What sells
- The most common entire home has 1 bedroom (33% of entire homes), and houses make up 62% of supply.
Revenue per listing by month
$5,190 $2,430- Median listing
- $2,970/mo
- Top 25% of listings
- $5,000+/mo
- Booked ahead
- 48 days
- Average stay
- 4 nights
- Most common home size
- 1 bedroom
- Superhosts
- 73%
Full ranking
How the Top 100 Markets in North Carolina Compare
The overall ranking with the five measures behind it. "Slow month" is a market's weakest month of revenue as a share of its best, so a higher figure means steadier income. Select a column heading to re-sort.
| Asheville Large market, growing revenue | $38,341 | 45% | $270 | 51% | +51% | 1,836 | |
| Mooresville High earnings, large market | $79,177 | 41% | $645 | 23% | +20% | 391 | |
| Swannanoa Growing revenue, high occupancy | $39,993 | 45% | $265 | 51% | +58% | 167 | |
| 4 | Fairview Growing revenue, high earnings | $51,297 | 42% | $369 | 43% | +51% | 226 |
| 5 | Black Mountain Growing revenue, large market | $39,209 | 41% | $318 | 48% | +38% | 518 |
| 6 | Fletcher Growing revenue, high occupancy | $55,527 | 47% | $366 | 38% | +71% | 130 |
| 7 | Wrightsville Beach High earnings, large market | $63,443 | 40% | $581 | 21% | +13% | 516 |
| 8 | Kitty Hawk High occupancy, high earnings | $48,938 | 44% | $399 | 19% | +17% | 444 |
| 9 | Leicester High occupancy, growing revenue | $46,242 | 44% | $323 | 40% | +36% | 134 |
| 10 | Candler Growing revenue, high earnings | $38,441 | 41% | $278 | 47% | +30% | 279 |
| 11 | Wilmington Large market, high occupancy | $31,465 | 44% | $242 | 39% | +15% | 1,619 |
| 12 | Highlands High earnings, growing revenue | $52,857 | 39% | $460 | 31% | +21% | 358 |
| 13 | Kill Devil Hills Large market, high occupancy | $42,624 | 43% | $357 | 16% | +7% | 1,224 |
| 14 | Carolina Beach Large market, high earnings | $42,153 | 41% | $377 | 19% | +13% | 1,684 |
| 15 | Apex High occupancy, year-round demand | $37,439 | 51% | $234 | 66% | +17% | 111 |
| 16 | Weaverville Growing revenue, high occupancy | $33,043 | 43% | $256 | 49% | +37% | 293 |
| 17 | Nags Head High earnings, large market | $54,564 | 40% | $500 | 14% | +8% | 904 |
| 18 | North Topsail Beach Large market, high earnings | $50,047 | 38% | $492 | 19% | +16% | 909 |
| 19 | Southern Pines High earnings, high occupancy | $39,510 | 42% | $304 | 41% | +20% | 204 |
| 20 | Duck High earnings, high occupancy | $57,936 | 42% | $518 | 11% | +12% | 285 |
| 21 | Boone Large market, year-round demand | $36,886 | 38% | $360 | 50% | +15% | 608 |
| 22 | Brevard High occupancy, large market | $33,446 | 43% | $265 | 36% | +18% | 381 |
| 23 | Cary High occupancy, year-round demand | $30,069 | 48% | $216 | 61% | +5% | 329 |
| 24 | Corolla High earnings, large market | $59,537 | 38% | $600 | 12% | +7% | 784 |
| 25 | Southern Shores High earnings, high occupancy | $56,416 | 43% | $498 | 17% | +13% | 168 |
| 26 | Bryson City Large market, growing revenue | $33,143 | 39% | $278 | 41% | +17% | 984 |
| 27 | Maggie Valley Large market, growing revenue | $32,493 | 39% | $273 | 51% | +22% | 588 |
| 28 | Chapel Hill Year-round demand, high occupancy | $27,846 | 44% | $258 | 71% | +14% | 289 |
| 29 | Raleigh Large market, year-round demand | $25,607 | 44% | $205 | 65% | +6% | 1,764 |
| 30 | Kure Beach High earnings, large market | $52,083 | 39% | $493 | 17% | +10% | 501 |
| 31 | Surf City Large market, high earnings | $48,438 | 38% | $444 | 17% | +15% | 754 |
| 32 | Banner Elk Large market, year-round demand | $38,910 | 34% | $433 | 52% | +16% | 599 |
| 33 | Canton Growing revenue, year-round demand | $34,798 | 41% | $284 | 53% | +42% | 132 |
| 34 | Denver High earnings, high occupancy | $77,713 | 43% | $629 | 25% | +6% | 128 |
| 35 | Arden Growing revenue, high occupancy | $38,028 | 43% | $279 | 44% | +37% | 115 |
| 36 | Woodfin Growing revenue, year-round demand | $32,279 | 41% | $253 | 52% | +29% | 210 |
| 37 | Ocean Isle Beach High earnings, large market | $60,671 | 38% | $626 | 14% | −7% | 576 |
| 38 | Emerald Isle High earnings, large market | $49,134 | 40% | $451 | 16% | +2% | 538 |
| 39 | Whittier Growing revenue, year-round demand | $32,931 | 39% | $260 | 50% | +32% | 274 |
| 40 | Marshall Growing revenue, year-round demand | $31,085 | 40% | $277 | 57% | +48% | 156 |
| 41 | Hendersonville Growing revenue, large market | $28,390 | 40% | $249 | 49% | +35% | 569 |
| 42 | Durham Year-round demand, large market | $22,718 | 43% | $196 | 70% | +11% | 1,187 |
| 43 | Currituck County High earnings, high occupancy | $66,557 | 43% | $574 | 12% | – | 119 |
| 44 | Rodanthe High earnings, high occupancy | $54,164 | 41% | $479 | 15% | +12% | 192 |
| 45 | Blowing Rock High earnings, large market | $41,627 | 36% | $391 | 43% | +13% | 500 |
| 46 | Oak Island Large market, high earnings | $43,213 | 37% | $496 | 21% | +2% | 1,615 |
| 47 | Pinehurst High earnings, large market | $38,423 | 38% | $348 | 38% | +9% | 382 |
| 48 | Avon Growing revenue, high earnings | $36,419 | 39% | $403 | 18% | +45% | 302 |
| 49 | Mars Hill Year-round demand, high earnings | $34,979 | 37% | $341 | 56% | +16% | 244 |
| 50 | Greensboro Large market, year-round demand | $25,544 | 42% | $215 | 54% | +8% | 790 |
| 51 | Charlotte Large market, year-round demand | $25,115 | 41% | $226 | 62% | −1% | 3,646 |
| 52 | Holden Beach High earnings, growing revenue | $47,003 | 36% | $562 | 16% | +25% | 315 |
| 53 | Seven Devils Growing revenue, year-round demand | $37,986 | 35% | $380 | 54% | +32% | 152 |
| 54 | Sylva High occupancy | $28,348 | 43% | $225 | 48% | +14% | 232 |
| 55 | Atlantic Beach Large market, growing revenue | $33,313 | 38% | $337 | 18% | +25% | 535 |
| 56 | Waynesville Growing revenue, large market | $28,263 | 37% | $256 | 52% | +25% | 504 |
| 57 | Belmont High occupancy | $34,462 | 44% | $270 | 47% | 0% | 126 |
| 58 | Beech Mountain Large market, growing revenue | $31,453 | 32% | $356 | 40% | +32% | 822 |
| 59 | Pisgah Forest High occupancy, growing revenue | $33,257 | 43% | $263 | 36% | +24% | 118 |
| 60 | Beaufort | $31,429 | 39% | $289 | 28% | +16% | 275 |
| 61 | Concord Year-round demand, high occupancy | $24,962 | 44% | $197 | 66% | +12% | 146 |
| 62 | Lake Lure Growing revenue, large market | $30,817 | 32% | $347 | 37% | +64% | 512 |
| 63 | Winston-Salem Year-round demand, large market | $20,561 | 41% | $195 | 64% | +6% | 737 |
| 64 | Jacksonville High occupancy, year-round demand | $20,667 | 46% | $158 | 50% | +17% | 214 |
| 65 | Fayetteville Year-round demand, large market | $16,667 | 41% | $153 | 65% | +11% | 608 |
| 66 | Wake Forest High occupancy, year-round demand | $28,668 | 45% | $206 | 57% | +1% | 112 |
| 67 | Bald Head Island High earnings | $55,666 | 29% | $760 | 16% | +8% | 218 |
| 68 | Hot Springs Growing revenue, year-round demand | $26,630 | 39% | $214 | 53% | +33% | 145 |
| 69 | High Point Large market | $25,625 | 39% | $272 | 43% | +12% | 376 |
| 70 | Burnsville Growing revenue, year-round demand | $25,496 | 35% | $254 | 54% | +40% | 247 |
| 71 | Hickory High occupancy, year-round demand | $22,079 | 45% | $186 | 63% | −2% | 172 |
| 72 | Cashiers High earnings, growing revenue | $44,318 | 35% | $439 | 30% | +18% | 118 |
| 73 | Topsail Beach High earnings | $38,025 | 36% | $488 | 20% | +10% | 202 |
| 74 | Topton Growing revenue, high earnings | $34,893 | 37% | $311 | 22% | +22% | 136 |
| 75 | Frisco Growing revenue | $30,977 | 40% | $323 | 19% | +51% | 122 |
| 76 | Fuquay-Varina Year-round demand, high occupancy | $24,999 | 43% | $201 | 70% | +5% | 120 |
| 77 | Littleton High earnings | $50,316 | 34% | $522 | 21% | −13% | 151 |
| 78 | Franklin Large market, growing revenue | $23,623 | 38% | $220 | 46% | +17% | 373 |
| 79 | Old Fort Year-round demand, growing revenue | $30,813 | 37% | $286 | 52% | +20% | 103 |
| 80 | West Jefferson | $29,534 | 35% | $275 | 45% | +16% | 210 |
| 81 | Sunset Beach Growing revenue, large market | $27,624 | 37% | $287 | 24% | +19% | 329 |
| 82 | Manteo | $33,381 | 36% | $312 | 19% | +11% | 182 |
| 83 | Lexington | $29,327 | 40% | $260 | 34% | +10% | 140 |
| 84 | Morganton High occupancy, year-round demand | $23,839 | 44% | $192 | 52% | +3% | 126 |
| 85 | Southport High occupancy | $29,020 | 40% | $248 | 39% | +5% | 130 |
| 86 | Morehead City | $27,035 | 39% | $269 | 30% | +17% | 161 |
| 87 | Newland Year-round demand | $25,428 | 37% | $236 | 50% | +12% | 212 |
| 88 | Murphy Large market | $21,521 | 37% | $214 | 48% | +11% | 409 |
| 89 | Sapphire Growing revenue | $30,481 | 29% | $363 | 31% | +18% | 213 |
| 90 | Vilas Year-round demand, growing revenue | $29,753 | 33% | $354 | 56% | +18% | 118 |
| 91 | Robbinsville | $24,104 | 37% | $217 | 43% | +13% | 243 |
| 92 | New Bern | $22,717 | 39% | $190 | 49% | +9% | 211 |
| 93 | Greenville Year-round demand | $17,553 | 38% | $178 | 66% | +9% | 230 |
| 94 | Marion Year-round demand | $26,014 | 34% | $250 | 57% | +12% | 145 |
| 95 | Sugar Mountain Growing revenue, large market | $20,827 | 31% | $273 | 40% | +28% | 494 |
| 96 | Gastonia Year-round demand, high occupancy | $18,112 | 43% | $158 | 72% | −11% | 105 |
| 97 | Lenoir Year-round demand | $29,777 | 36% | $280 | 51% | 0% | 118 |
| 98 | Mill Spring Growing revenue | $29,040 | 32% | $301 | 32% | +19% | 126 |
| 99 | Ocracoke | $27,919 | 37% | $299 | 21% | −10% | 145 |
| 100 | Burlington Year-round demand | $20,700 | 37% | $200 | 62% | +5% | 132 |
By measure
North Carolina Airbnb Markets Ranked by Revenue, Nightly Rate and Occupancy
The overall ranking balances five measures. These lists take one at a time, for buyers who care most about income, pricing power, bookings, a steady calendar, momentum or market size.
Highest-earning Airbnb markets in North Carolina
Average annual revenue per active listing over the past 12 months. Markets with at least 200 listings.
| # | Market | Revenue |
|---|---|---|
| Mooresville #2 overall | $79,200 | |
| Wrightsville Beach #7 overall | $63,400 | |
| Ocean Isle Beach #37 overall | $60,700 | |
| 4 | Corolla #24 overall | $59,500 |
| 5 | Duck #20 overall | $57,900 |
| 6 | Bald Head Island #67 overall | $55,700 |
| 7 | Nags Head #17 overall | $54,600 |
| 8 | Highlands #12 overall | $52,900 |
| 9 | Kure Beach #30 overall | $52,100 |
| 10 | Fairview #4 overall | $51,300 |
| 11 | North Topsail Beach #18 overall | $50,000 |
| 12 | Emerald Isle #38 overall | $49,100 |
| 13 | Kitty Hawk #8 overall | $48,900 |
| 14 | Surf City #31 overall | $48,400 |
| 15 | Holden Beach #52 overall | $47,000 |
| 16 | Oak Island #46 overall | $43,200 |
| 17 | Kill Devil Hills #13 overall | $42,600 |
| 18 | Carolina Beach #14 overall | $42,200 |
| 19 | Blowing Rock #45 overall | $41,600 |
| 20 | Southern Pines #19 overall | $39,500 |
| 21 | Black Mountain #5 overall | $39,200 |
| 22 | Banner Elk #32 overall | $38,900 |
| 23 | Candler #10 overall | $38,400 |
| 24 | Pinehurst #47 overall | $38,400 |
| 25 | Asheville #1 overall | $38,300 |
Most expensive Airbnb markets in North Carolina by nightly rate
Average rate per booked night. A high rate earns most where occupancy holds up too. Markets with at least 200 listings.
| # | Market | Nightly |
|---|---|---|
| Bald Head Island #67 overall | $760 | |
| Mooresville #2 overall | $645 | |
| Ocean Isle Beach #37 overall | $625 | |
| 4 | Corolla #24 overall | $600 |
| 5 | Wrightsville Beach #7 overall | $580 |
| 6 | Holden Beach #52 overall | $560 |
| 7 | Duck #20 overall | $520 |
| 8 | Nags Head #17 overall | $500 |
| 9 | Oak Island #46 overall | $495 |
| 10 | Kure Beach #30 overall | $495 |
| 11 | North Topsail Beach #18 overall | $490 |
| 12 | Topsail Beach #73 overall | $490 |
| 13 | Highlands #12 overall | $460 |
| 14 | Emerald Isle #38 overall | $450 |
| 15 | Surf City #31 overall | $445 |
| 16 | Banner Elk #32 overall | $435 |
| 17 | Avon #48 overall | $405 |
| 18 | Kitty Hawk #8 overall | $400 |
| 19 | Blowing Rock #45 overall | $390 |
| 20 | Carolina Beach #14 overall | $375 |
| 21 | Fairview #4 overall | $370 |
| 22 | Sapphire #89 overall | $365 |
| 23 | Boone #21 overall | $360 |
| 24 | Kill Devil Hills #13 overall | $355 |
| 25 | Beech Mountain #58 overall | $355 |
Highest-occupancy Airbnb markets in North Carolina
Share of available nights booked over the past 12 months. Markets with at least 200 listings.
| # | Market | Occupancy |
|---|---|---|
| Cary #23 overall | 48% | |
| Jacksonville #64 overall | 46% | |
| Asheville #1 overall | 45% | |
| 4 | Chapel Hill #28 overall | 44% |
| 5 | Wilmington #11 overall | 44% |
| 6 | Kitty Hawk #8 overall | 44% |
| 7 | Raleigh #29 overall | 44% |
| 8 | Sylva #54 overall | 43% |
| 9 | Durham #42 overall | 43% |
| 10 | Kill Devil Hills #13 overall | 43% |
| 11 | Brevard #22 overall | 43% |
| 12 | Weaverville #16 overall | 43% |
| 13 | Southern Pines #19 overall | 42% |
| 14 | Fairview #4 overall | 42% |
| 15 | Greensboro #50 overall | 42% |
| 16 | Duck #20 overall | 42% |
| 17 | Candler #10 overall | 41% |
| 18 | Mooresville #2 overall | 41% |
| 19 | Black Mountain #5 overall | 41% |
| 20 | Woodfin #36 overall | 41% |
| 21 | Winston-Salem #63 overall | 41% |
| 22 | Charlotte #51 overall | 41% |
| 23 | Carolina Beach #14 overall | 41% |
| 24 | Fayetteville #65 overall | 41% |
| 25 | Wrightsville Beach #7 overall | 40% |
Most year-round Airbnb markets in North Carolina
Revenue in the slowest month as a share of the best month, so a higher figure means steadier income. Markets with at least 200 listings.
| # | Market | Slow month |
|---|---|---|
| Chapel Hill #28 overall | 71% | |
| Durham #42 overall | 70% | |
| Greenville #93 overall | 66% | |
| 4 | Raleigh #29 overall | 65% |
| 5 | Fayetteville #65 overall | 65% |
| 6 | Winston-Salem #63 overall | 64% |
| 7 | Charlotte #51 overall | 62% |
| 8 | Cary #23 overall | 61% |
| 9 | Mars Hill #49 overall | 56% |
| 10 | Greensboro #50 overall | 54% |
| 11 | Burnsville #70 overall | 54% |
| 12 | Banner Elk #32 overall | 52% |
| 13 | Waynesville #56 overall | 52% |
| 14 | Woodfin #36 overall | 52% |
| 15 | Asheville #1 overall | 51% |
| 16 | Maggie Valley #27 overall | 51% |
| 17 | Boone #21 overall | 50% |
| 18 | Whittier #39 overall | 50% |
| 19 | Jacksonville #64 overall | 50% |
| 20 | Newland #87 overall | 50% |
| 21 | Hendersonville #41 overall | 49% |
| 22 | Weaverville #16 overall | 49% |
| 23 | New Bern #92 overall | 49% |
| 24 | Black Mountain #5 overall | 48% |
| 25 | Murphy #88 overall | 48% |
Fastest-growing Airbnb markets in North Carolina
Change in revenue per listing from the year before, among markets where it rose. Markets with at least 200 listings.
| # | Market | Change |
|---|---|---|
| Lake Lure #62 overall | +64% | |
| Asheville #1 overall | +51% | |
| Fairview #4 overall | +51% | |
| 4 | Avon #48 overall | +45% |
| 5 | Burnsville #70 overall | +40% |
| 6 | Black Mountain #5 overall | +38% |
| 7 | Weaverville #16 overall | +37% |
| 8 | Hendersonville #41 overall | +35% |
| 9 | Beech Mountain #58 overall | +32% |
| 10 | Whittier #39 overall | +32% |
| 11 | Candler #10 overall | +30% |
| 12 | Woodfin #36 overall | +29% |
| 13 | Sugar Mountain #95 overall | +28% |
| 14 | Holden Beach #52 overall | +25% |
| 15 | Atlantic Beach #55 overall | +25% |
| 16 | Waynesville #56 overall | +25% |
| 17 | Maggie Valley #27 overall | +22% |
| 18 | Highlands #12 overall | +21% |
| 19 | Southern Pines #19 overall | +20% |
| 20 | Mooresville #2 overall | +20% |
| 21 | Sunset Beach #81 overall | +19% |
| 22 | Sapphire #89 overall | +18% |
| 23 | Brevard #22 overall | +18% |
| 24 | Bryson City #26 overall | +17% |
| 25 | Franklin #78 overall | +17% |
Largest Airbnb markets in North Carolina
Active listings. Bigger markets have more comparable rentals to price against and more buyers at resale.
| # | Market | Listings |
|---|---|---|
| Charlotte #51 overall | 3,650 | |
| Asheville #1 overall | 1,840 | |
| Raleigh #29 overall | 1,760 | |
| 4 | Carolina Beach #14 overall | 1,680 |
| 5 | Wilmington #11 overall | 1,620 |
| 6 | Oak Island #46 overall | 1,620 |
| 7 | Kill Devil Hills #13 overall | 1,220 |
| 8 | Durham #42 overall | 1,190 |
| 9 | Bryson City #26 overall | 984 |
| 10 | North Topsail Beach #18 overall | 909 |
| 11 | Nags Head #17 overall | 904 |
| 12 | Beech Mountain #58 overall | 822 |
| 13 | Greensboro #50 overall | 790 |
| 14 | Corolla #24 overall | 784 |
| 15 | Surf City #31 overall | 754 |
| 16 | Winston-Salem #63 overall | 737 |
| 17 | Boone #21 overall | 608 |
| 18 | Fayetteville #65 overall | 608 |
| 19 | Banner Elk #32 overall | 599 |
| 20 | Maggie Valley #27 overall | 588 |
| 21 | Ocean Isle Beach #37 overall | 576 |
| 22 | Hendersonville #41 overall | 569 |
| 23 | Emerald Isle #38 overall | 538 |
| 24 | Atlantic Beach #55 overall | 535 |
| 25 | Black Mountain #5 overall | 518 |
Seasonality
When Airbnbs in North Carolina Earn the Most
July is the best month for about eight in ten ranked markets in North Carolina. February is the most common slowest month, in 52 markets.
July earns about three times what January does
Average revenue per listing across the 111 ranked markets in North Carolina, by month
| Month | Avg. revenue per listing | Best month for | Highest-ranked examples |
|---|---|---|---|
| January | $2,360 | 2 markets | Beech Mountain, Sugar Mountain |
| February | $2,400 | – | – |
| March | $3,040 | – | – |
| April | $3,350 | 1 market | Greensboro |
| May | $4,110 | 2 markets | Wake Forest, Burlington |
| June | $6,040 | 7 markets | Apex, Cary, Beaufort |
| July | $7,010 | 90 markets | Asheville, Mooresville, Swannanoa |
| August | $5,300 | 1 market | Greenville |
| September | $3,830 | – | – |
| October | $3,680 | 7 markets | Chapel Hill, Raleigh, Winston-Salem |
| November | $3,010 | – | – |
| December | $3,130 | 1 market | Vilas |
Average revenue is per listing across the ranked markets, the line in the chart above. "Best month for" counts the ranked markets whose own revenue peaks in that month.
Named regions
Regions in North Carolina
These pages compare the towns of a region that people search by name, with figures for the region as a whole.
- Outer Banks 16 towns
- Topsail Island 3 towns
- Crystal Coast 7 towns
- Hatteras Island 7 towns
Management
Who Manages Airbnbs in North Carolina?
AirROI ranks the 50 largest of the 400 companies that run 5 or more Airbnb listings in North Carolina, by listings, guest rating and growth; companies run 29% of its listings.
Method
How the Ranking Works
The ranking covers the 111 markets in North Carolina with at least 100 active Airbnb listings and data through October 2026. Each market is compared with the others on five measures, and markets are ordered by a weighted blend of where they place on each:
- Revenue per listing (35%): average revenue an active listing earned over the past 12 months.
- Occupancy (20%): share of available nights that were booked.
- Market size (20%): active listings. Bigger markets offer more comparable rentals to price against and more buyers when you sell.
- Year-round demand (15%): revenue in the slowest month as a share of the best month. The latest month is left out when its bookings look incomplete.
- Growth (10%): change in revenue per listing from the year before. Markets whose boundaries changed between years are scored in the middle.
Left out: 22 markets whose data predate the latest refresh and one town listed a second time under another spelling. The score measures how rentals perform. It does not include purchase prices, financing, operating costs or local short-term rental rules, which vary by address and should be checked before buying. Figures are in US dollars and match each market's own report; see the data methodology for how listings are tracked.
To check one property before buying, run its address and size through the Airbnb calculator for a revenue, occupancy and nightly-rate range from comparable listings.
FAQ
Frequently Asked Questions About Airbnb Investing in North Carolina
What is the best place to buy an Airbnb in North Carolina?
Asheville ranks first of the 111 markets in North Carolina in AirROI's ranking, with $38,300 in average revenue per listing and 45% occupancy. Mooresville and Swannanoa follow. The ranking weighs revenue, occupancy, market size, seasonality and growth; it leaves out purchase prices.
What are the most profitable Airbnb locations in North Carolina?
By revenue per listing, among markets with at least 200 listings, Mooresville leads at $79,200 a year, ahead of Wrightsville Beach at $63,400. Profit also depends on what a property costs to buy and run, which varies far more between markets than revenue does.
How much does an Airbnb make in North Carolina?
The average active listing in North Carolina earned $34,600 over the 12 months to October 2026, at 40% occupancy. Across the ranked markets, the middle half averaged between $25,400 and $39,500 per listing. Averages include listings that operated for only part of the year, so a listing rented all year typically earns more.
What is a good Airbnb occupancy rate in North Carolina?
The average listing in North Carolina was booked on 40% of available nights over the past 12 months. Half of the ranked markets fall between 36% and 42%, so a market above about 42% sits in the top quarter. Occupancy is only half the picture: a market with lower occupancy can still earn more if its nightly rates are higher.
Where is Airbnb demand highest in North Carolina?
Among ranked markets with at least 200 listings, Cary has the highest occupancy, with 48% of available nights booked, followed by Jacksonville at 46%. Its listings average about $215 a night and $30,100 a year.
Where are Airbnb nightly rates highest in North Carolina?
Among ranked markets with at least 200 listings, Bald Head Island has the highest average nightly rate, about $760, followed by Mooresville at $645. Fayetteville is the least expensive, at about $155. The average booked night in North Carolina costs about $320.
What is the best month for Airbnb in North Carolina?
July is the highest-earning month for 90 of the 111 ranked markets, followed by June (7). February is the most common slowest month, in 52 of the 111 markets. Each market's report shows its own month-by-month revenue, occupancy and rates.
Which Airbnb markets in North Carolina earn the most evenly through the year?
Among ranked markets with at least 200 listings, Chapel Hill has the steadiest income: its slowest month, February, still earns about 71% of its best. Durham follows, at 70%. Steadier markets are easier to budget for, though they do not always earn the most per listing.
Which Airbnb markets are growing fastest in North Carolina?
Among ranked markets with at least 200 listings, revenue per listing grew most in Lake Lure, up 64% on the year before, and in Asheville, up 51%. A single strong year can reflect events or new supply, so it is worth checking a market's monthly trend before relying on it.
Is Airbnb still profitable in North Carolina in 2026?
Revenue per listing grew in 103 of the 110 ranked markets with a comparable year of data; in the typical market it rose 15%. Whether a given property profits depends on its purchase price, financing and running costs.
What are the best smaller Airbnb markets in North Carolina?
Among ranked markets with fewer than 200 active listings, Swannanoa (#3 overall, $40,000 per listing), Fletcher (#6, $55,500) and Leicester (#9, $46,200) place highest. Smaller markets have fewer comparable rentals to price against, so their averages can move more from year to year.
How many Airbnb listings are there in North Carolina?
AirROI tracked 53,200 active Airbnb listings in North Carolina over the 12 months to October 2026, across 298 markets. The largest ranked market is Charlotte, with 3,650 listings, followed by Asheville with 1,840.
Directory
All 298 Airbnb Markets in North Carolina
Every North Carolina city with an AirROI Airbnb market report, A–Z, with its active listing count.
A
- Aberdeen 51 listings
- Ahoskie 35 listings
- Albemarle 29 listings
- Alexander 64 listings
- Almond 45 listings
- Andrews 82 listings
- Apex 111 listings
- Arapahoe 18 listings
- Archdale 24 listings
- Arden 115 listings
- Asheboro 66 listings
- Asheville 1,836 listings
- Ashville 74 listings
- Atlantic Beach 535 listings
- Avon 302 listings
B
- Bakersville 65 listings
- Bald Head Island 218 listings
- Balsam Grove 27 listings
- Banner Elk 599 listings
- Barnardsville 32 listings
- Bath 23 listings
- Beaufort 275 listings
- Beech Mountain 822 listings
- Belhaven 48 listings
- Belmont 126 listings
- Bent Creek 41 listings
- Birdtown Community 23 listings
- Black Mountain 518 listings
- Blowing Rock 500 listings
- Bolivia 22 listings
- Boone 608 listings
- Bostic 30 listings
- Brasstown 24 listings
- Brevard 381 listings
- Brunswick County 70 listings
- Bryson City 984 listings
- Burlington 132 listings
- Burnsville 247 listings
- Buxton 138 listings
C
- Calabash 126 listings
- Candler 279 listings
- Canton 132 listings
- Carolina Beach 1,684 listings
- Carrboro 97 listings
- Carthage 25 listings
- Cary 329 listings
- Cashiers 118 listings
- Castle Hayne 22 listings
- Caswell Beach 49 listings
- Cedar Mountain 28 listings
- Cedar Point 34 listings
- Chapel Hill 289 listings
- Charlotte 3,646 listings
- Cherokee County 18 listings
- Chimney Rock 39 listings
- Clayton 84 listings
- Clemmons 35 listings
- Clyde 97 listings
- Coats 18 listings
- Coinjock 23 listings
- Colington 59 listings
- Columbia 28 listings
- Columbus 56 listings
- Concord 146 listings
- Connelly Springs 24 listings
- Cornelius 85 listings
- Corolla 784 listings
- Crumpler 39 listings
- Cullowhee 132 listings
- Currituck County 119 listings
D
E
- Eden 23 listings
- Edenton 85 listings
- Elizabeth City 98 listings
- Elk Park 46 listings
- Elkin 63 listings
- Elon 27 listings
- Emerald Isle 538 listings
F
- Fairfield Harbour 28 listings
- Fairview 226 listings
- Fayetteville 608 listings
- Ferguson 45 listings
- Flat Rock 78 listings
- Fleetwood 97 listings
- Fletcher 130 listings
- Forest City 30 listings
- Franklin 373 listings
- Frisco 122 listings
- Fuquay-Varina 120 listings
G
- Garner 73 listings
- Gastonia 105 listings
- Gerton 22 listings
- Glade Valley 22 listings
- Glenville 84 listings
- Goldsboro 66 listings
- Graham 54 listings
- Grassy Creek 24 listings
- Green Mountain 22 listings
- Greensboro 790 listings
- Greenville 230 listings
H
- Hampstead 64 listings
- Harkers Island 56 listings
- Harrisburg 24 listings
- Hatteras 154 listings
- Havelock 36 listings
- Hayesville 151 listings
- Henderson 53 listings
- Hendersonville 569 listings
- Henrico 81 listings
- Hertford 36 listings
- Hickory 172 listings
- High Point 376 listings
- Highlands 358 listings
- Hillsborough 64 listings
- Holden Beach 315 listings
- Holly Ridge 64 listings
- Holly Springs 23 listings
- Hope Mills 51 listings
- Horse Shoe 22 listings
- Hot Springs 145 listings
- Hubert 28 listings
- Huntersville 89 listings
I
- Indian Beach 23 listings
- Indian Trail 26 listings
J
- Jacksonville 214 listings
- James City 20 listings
- Jamestown 46 listings
- Jefferson 61 listings
- Jonesville 18 listings
K
- Kannapolis 92 listings
- Kernersville 56 listings
- Kill Devil Hills 1,224 listings
- Kings Landing 19 listings
- Kings Mountain 39 listings
- Kinston 27 listings
- Kitty Hawk 444 listings
- Knightdale 36 listings
- Kure Beach 501 listings
L
- Lake Junaluska 110 listings
- Lake Lure 512 listings
- Lake Norman of Catawba 70 listings
- Lake Toxaway 67 listings
- Lake Waccamaw 28 listings
- Lansing 45 listings
- Laurel Park 31 listings
- Laurel Springs 24 listings
- Leasburg 22 listings
- Leicester 134 listings
- Leland 32 listings
- Lenoir 118 listings
- Lexington 140 listings
- Lillington 28 listings
- Lincolnton 48 listings
- Littleton 151 listings
- Lumberton 19 listings
M
- Macon 46 listings
- Madison 18 listings
- Maggie Valley 588 listings
- Manteo 182 listings
- Marble 31 listings
- Marion 145 listings
- Mars Hill 244 listings
- Marshall 156 listings
- Matthews 63 listings
- Mebane 27 listings
- Mill Spring 126 listings
- Millers Creek 17 listings
- Mills River 75 listings
- Mint Hill 33 listings
- Mocksville 22 listings
- Monroe 48 listings
- Montreat 26 listings
- Mooresville 391 listings
- Moravian Falls 33 listings
- Morehead City 161 listings
- Morganton 126 listings
- Morrisville 64 listings
- Mount Airy 102 listings
- Mount Gilead 33 listings
- Mount Holly 40 listings
- Murphy 409 listings
N
- Nags Head 904 listings
- Nebo 90 listings
- New Bern 211 listings
- New London 75 listings
- Newland 212 listings
- Newport 40 listings
- Newton 28 listings
- North Topsail Beach 909 listings
- North Wilkesboro 22 listings
- Norwood 22 listings
O
- Oak Island 1,615 listings
- Ocean Isle Beach 576 listings
- Ocracoke 145 listings
- Ogden 47 listings
- Old Fort 103 listings
- Oriental 74 listings
- Otto 32 listings
P
- Penrose 37 listings
- Pilot Mountain 29 listings
- Pine Knoll Shores 81 listings
- Pinehurst 382 listings
- Pineville 45 listings
- Piney Creek 30 listings
- Pisgah Forest 118 listings
- Pittsboro 68 listings
- Point Harbor 17 listings
- Powells Point 23 listings
- Purlear 54 listings
R
- Raeford 35 listings
- Raleigh 1,764 listings
- Reidsville 18 listings
- Richlands 22 listings
- Robbinsville 243 listings
- Rocky Mount 108 listings
- Rodanthe 192 listings
- Rosman 34 listings
- Roxboro 41 listings
- Rutherfordton 79 listings
S
- Salisbury 82 listings
- Salter Path 22 listings
- Saluda 122 listings
- Salvo 70 listings
- Sanford 92 listings
- Sapphire 213 listings
- Scaly Mountain 27 listings
- Semora 54 listings
- Seven Devils 152 listings
- Shallotte 41 listings
- Shelby 37 listings
- Sherrills Ford 86 listings
- Smithfield 35 listings
- Sneads Ferry 108 listings
- Southern Pines 204 listings
- Southern Shores 168 listings
- Southport 130 listings
- Sparta 64 listings
- Spring Lake 26 listings
- Spruce Pine 80 listings
- St. James 28 listings
- Statesville 91 listings
- Sugar Grove 58 listings
- Sugar Mountain 494 listings
- Summerfield 25 listings
- Sunset Beach 329 listings
- Surf City 754 listings
- Swain County 21 listings
- Swannanoa 167 listings
- Swansboro 69 listings
- Sylva 232 listings
T
- Tarboro 26 listings
- Thomasville 33 listings
- Todd 81 listings
- Topsail Beach 202 listings
- Topton 136 listings
- Township of Taylorsville 27 listings
- Transylvania County 35 listings
- Troutman 54 listings
- Troy 22 listings
- Tryon 111 listings
- Tuckasegee 44 listings
U
- Union Mills 29 listings
V
- Valle Crucis 56 listings
- Vass 24 listings
- Vilas 118 listings
W
- Wake Forest 112 listings
- Warrensville 28 listings
- Warrenton 17 listings
- Washington 96 listings
- Watauga County 69 listings
- Waves 66 listings
- Waxhaw 47 listings
- Waynesville 504 listings
- Weaverville 293 listings
- Wendell 27 listings
- West Jefferson 210 listings
- Westfield 25 listings
- Whispering Pines 18 listings
- White Lake 20 listings
- Whiteville 26 listings
- Whittier 274 listings
- Wilkesboro 22 listings
- Wilmington 1,619 listings
- Wilson 51 listings
- Winston-Salem 737 listings
- Winterville 24 listings
- Woodfin 210 listings
- Wrightsville Beach 516 listings
Y
- Youngsville 24 listings