AirROI ranking · 202644 markets ranked
Best Places to Buy an Airbnb in Virginia (2026)
Alexandria is the best place to buy an Airbnb in Virginia in 2026, according to AirROI's ranking of 44 markets. Its listings averaged $45,600 in revenue over the 12 months to October 2026 and were booked on 48% of nights. It leads on the blend rather than on any one measure, placing 1st of 44 for occupancy, 6th of 44 for market size and 10th of 44 for revenue per listing. Virginia Beach and Stanley come next.
- Markets tracked
- 220
- Active Airbnb listings
- 20,800
- Avg. revenue per listing
- $33,600
- Occupancy rate
- 40%
- Avg. nightly rate
- $300
- Revenue change, typical market
- +8%
The short answer
Virginia Airbnb Market at a Glance
Across Virginia, the 20,800 active Airbnb listings tracked by AirROI, a short-term-rental data firm, averaged $33,600 over the same period. They were booked on 40% of nights at about $300 a night; the ranking covers the 44 markets with at least 100 active listings. Revenue per listing rose in 33 of the 41 ranked markets with a comparable year of data, by 8% in the typical one.
The ranking weighs revenue per listing most, then occupancy and market size, then how evenly income spreads across the year and how it changed on the year. It reflects rental performance, not purchase prices or local short-term rental rules. How the ranking works.
Where the top 10 Airbnb markets in Virginia are
Each dot is one of the 220 markets AirROI tracks in Virginia (4 outlying ones fall outside the map), sized by active listings and coloured by average revenue per listing. Select a number to jump to its profile.
Top 10
The Top 10 Airbnb Markets in Virginia
Each profile draws on the market's full AirROI report: how it earns, when in the year, who books and what sells. Monthly figures are averages per listing active in that month, so twelve of them add up to more than the annual average, which also counts listings that operated for only part of the year.
| # | Market | Avg. revenue | Occupancy |
|---|---|---|---|
 Alexandria High occupancy · Large market | $45,600 | 48% | |
 Virginia Beach Large market · Growing revenue | $45,900 | 42% | |
 Stanley High earnings · High occupancy | $59,700 | 46% | |
| 4 |  Richmond Year-round demand · Large market | $29,400 | 47% |
| 5 |  Charlottesville Large market · High occupancy | $38,100 | 43% |
| 6 |  McGaheysville High earnings · High occupancy | $75,500 | 42% |
| 7 |  Mineral Growing revenue · High earnings | $75,400 | 38% |
| 8 |  Arlington Large market · High occupancy | $33,200 | 46% |
| 9 |  Luray Large market · High earnings | $42,000 | 42% |
| 10 |  Shenandoah High earnings · High occupancy | $62,200 | 47% |
1. Alexandria
Known for: High occupancy · Large market
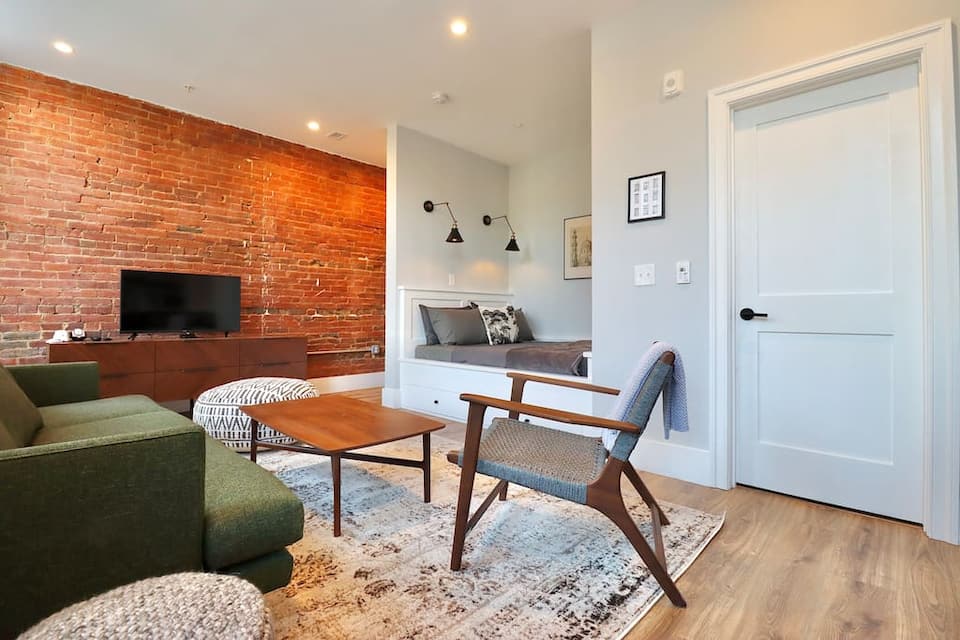


Top-earning Airbnb listings in Alexandria - Avg. revenue
- $45,600 −1% vs. last year
- Occupancy
- 48%
- Nightly rate
- $315
- Active listings
- 694
Where it places among the 44 ranked markets in Virginia
- Revenue 10th of 44
- Occupancy 1st of 44
- Market size 6th of 44
- Year-round 18th of 44
- Growth 35th of 41
- How it earns
- Alexandria fills more nights than any other ranked market in Virginia: 48% of them, at about $315 a night. That adds up to $45,600 per listing over the year, the tenth-highest of the 44 ranked markets. A typical listing takes in about $4,130 a month; the top quarter clear $6,990 or more.
- When it earns
- Alexandria's season runs from March to July, peaking in June at about $6,870 per listing; February, the quietest month, brings in about $3,470. Trips run long, about 6 nights on average against 4 nights for the typical market in Virginia, booked about 40 days ahead.
- Guest expectations
- Average ratings (4.80 stars) trail the typical market in Virginia (4.86), which leaves room for a well-run listing to stand out.
- What sells
- The most common entire home has 2 bedrooms (26% of entire homes), and houses make up 61% of supply.
Revenue per listing by month
$6,870 $3,470- Median listing
- $4,130/mo
- Top 25% of listings
- $6,990+/mo
- Booked ahead
- 40 days
- Average stay
- 6 nights
- Most common home size
- 2 bedrooms
- Superhosts
- 52%
Areas in the full report: Old Town Alexandria · Del Ray · Eisenhower Avenue
Full Alexandria Airbnb report2. Virginia Beach
Known for: Large market · Growing revenue
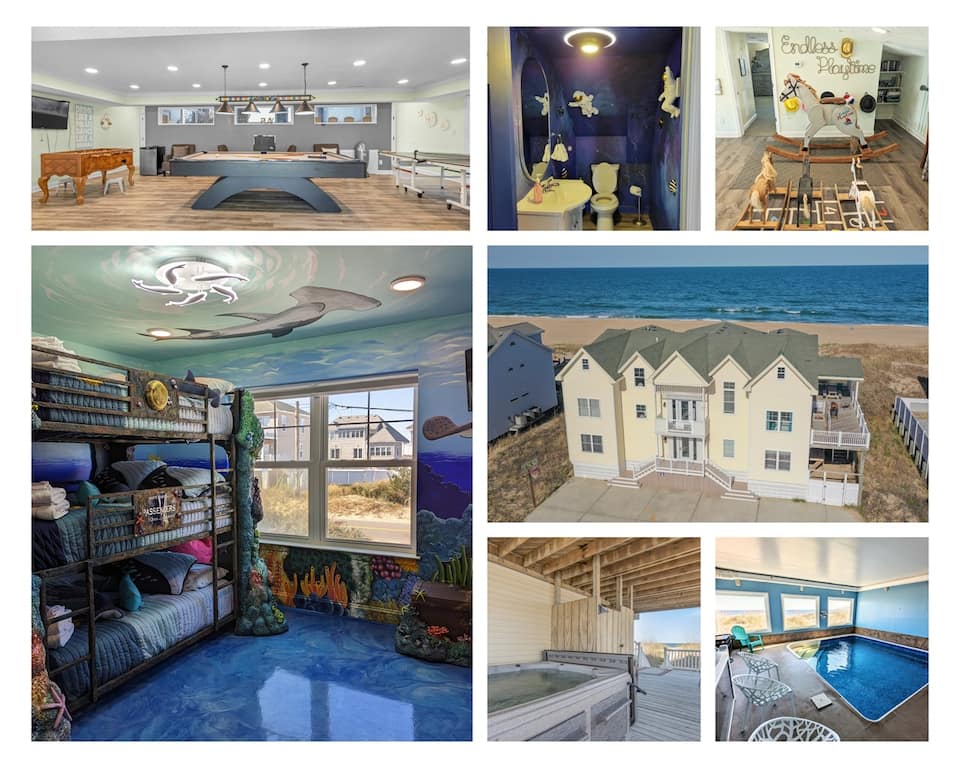
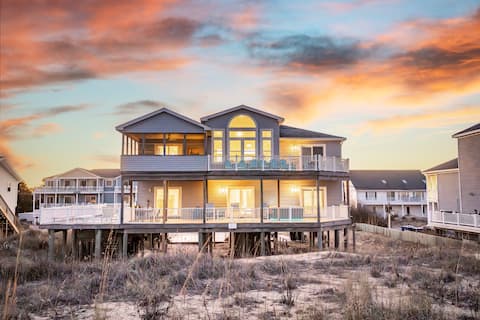
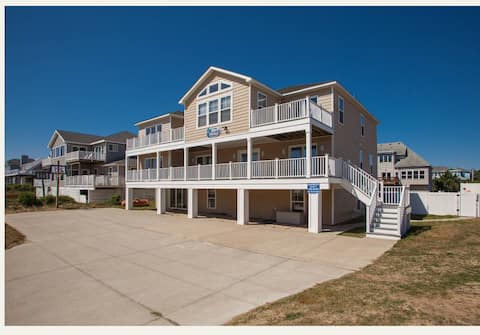
Top-earning Airbnb listings in Virginia Beach - Avg. revenue
- $45,900 +29% vs. last year
- Occupancy
- 42%
- Nightly rate
- $415
- Active listings
- 1,390
Where it places among the 44 ranked markets in Virginia
- Revenue 9th of 44
- Occupancy 14th of 44
- Market size 1st of 44
- Year-round 38th of 44
- Growth 3rd of 41
- How it earns
- Virginia Beach is Virginia's largest Airbnb market, with 1,390 active listings to price against. Average revenue per listing came to $45,900, the ninth-highest of the 44 ranked markets. In a typical month the median listing brings in about $4,270, and the best quarter clear $7,800. Revenue per listing rose 29% over the year, the third-biggest gain in Virginia, helped by nightly rates 23% higher.
- When it earns
- Revenue in Virginia Beach concentrates from May to September: July earns about $11,000 per listing, about four times as much as January. Guests stay about 6 nights, longer than in most of Virginia, and book about 60 days ahead.
- Guest expectations
- Average ratings (4.75 stars) trail the typical market in Virginia (4.86), which leaves room for a well-run listing to stand out.
- Who it suits
- It suits buyers who can carry costs through a quiet January and plan to use a professional manager or run a polished operation.
Revenue per listing by month
$11,000 $2,690- Median listing
- $4,270/mo
- Top 25% of listings
- $7,800+/mo
- Booked ahead
- 60 days
- Average stay
- 6 nights
- Most common home size
- 2 bedrooms
- Superhosts
- 46%
Areas in the full report: Oceanfront · Sandbridge Beach · Virginia Beach Town Center
Full Virginia Beach Airbnb report3. Stanley
Known for: High earnings · High occupancy
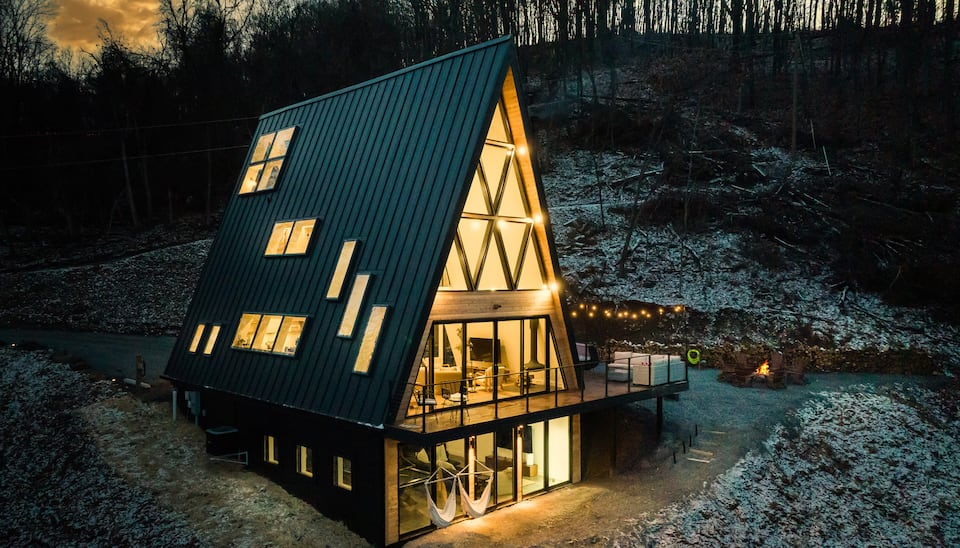
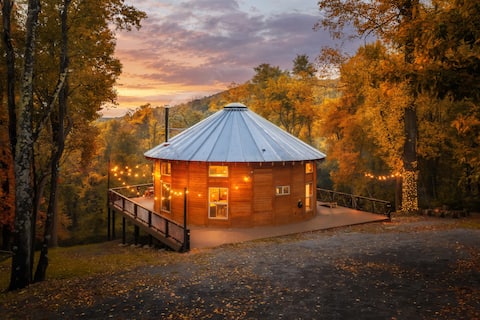

Top-earning Airbnb listings in Stanley - Avg. revenue
- $59,700 +19% vs. last year
- Occupancy
- 46%
- Nightly rate
- $360
- Active listings
- 113
Where it places among the 44 ranked markets in Virginia
- Revenue 5th of 44
- Occupancy 7th of 44
- Market size 38th of 44
- Year-round 11th of 44
- Growth 7th of 41
- How it earns
- Listings in Stanley are booked on 46% of nights, the seventh-highest occupancy of the 44 ranked markets, at about $360 a night. Average revenue per listing came to $59,700, the fifth-highest of the 44 ranked markets. Month to month, the median listing earns about $4,580 and a top-quarter listing $7,510 or more. Revenue per listing rose 19% over the year, helped by nightly rates 11% higher. With 113 listings it is a small market, so its averages can move more from year to year.
- When it earns
- Stanley has two seasons, May–August and October. October is the strongest month at about $6,840 per listing, and February the quietest at about $3,710. Stays are shorter than in most of Virginia, about 2.7 nights, so listings turn over often; guests book about 47 days ahead. Most hosts take one- or two-night bookings (97% of listings), more than in the typical market.
- What sells
- Three-bedroom homes lead the market (30% of entire homes), and cabins, campers and other outdoor stays make up 66% of supply.
- Who books
- Guests are overwhelmingly domestic (88%); the most common home cities are Washington, Richmond and New York.
Revenue per listing by month
$6,840 $3,710- Median listing
- $4,580/mo
- Top 25% of listings
- $7,510+/mo
- Booked ahead
- 47 days
- Average stay
- 2.7 nights
- Most common home size
- 3 bedrooms
- Superhosts
- 76%
4. Richmond
Known for: Year-round demand · Large market
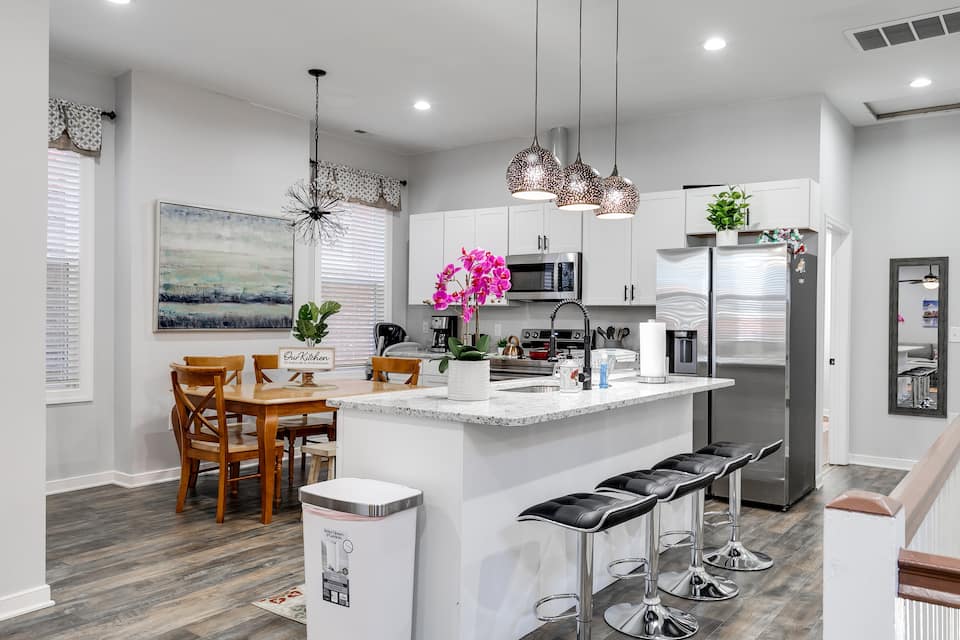
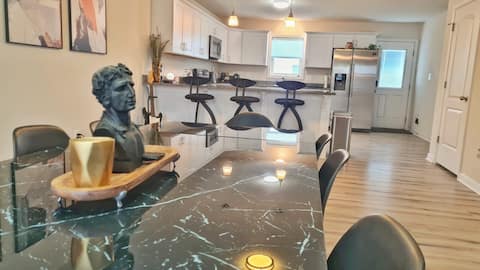

Top-earning Airbnb listings in Richmond - Avg. revenue
- $29,400 +4% vs. last year
- Occupancy
- 47%
- Nightly rate
- $205
- Active listings
- 1,040
Where it places among the 44 ranked markets in Virginia
- Revenue 26th of 44
- Occupancy 4th of 44
- Market size 3rd of 44
- Year-round 1st of 44
- Growth 26th of 41
- How it earns
- Richmond earns on volume. Rates run below the Virginia average at about $205 a night, but listings book 47% of nights. Moderate rates keep revenue per listing at $29,400, 12% below the Virginia average. Its place at #4 rests on year-round demand (1st of 44) and market size (3rd of 44) rather than on revenue per listing. A typical listing takes in about $2,760 a month; the top quarter clear $4,340 or more.
- When it earns
- Demand in Richmond holds up through the year: February, the slowest month, still brings in about two-thirds of July's revenue. Guests book later than in most of Virginia, about 37 days ahead against roughly 50 for the typical market in Virginia; stays average 7 nights.
- What sells
- The most common entire home has 1 bedroom (32% of entire homes), and houses make up 52% of supply.
- Who it suits
- Best for buyers who want income that holds up all year and would rather price for occupancy than for rate.
Revenue per listing by month
$3,700 $2,580- Median listing
- $2,760/mo
- Top 25% of listings
- $4,340+/mo
- Booked ahead
- 37 days
- Average stay
- 7 nights
- Most common home size
- 1 bedroom
- Superhosts
- 69%
Areas in the full report: Shockoe Bottom · The Fan District · Church Hill
Full Richmond Airbnb report5. Charlottesville
Known for: Large market · High occupancy
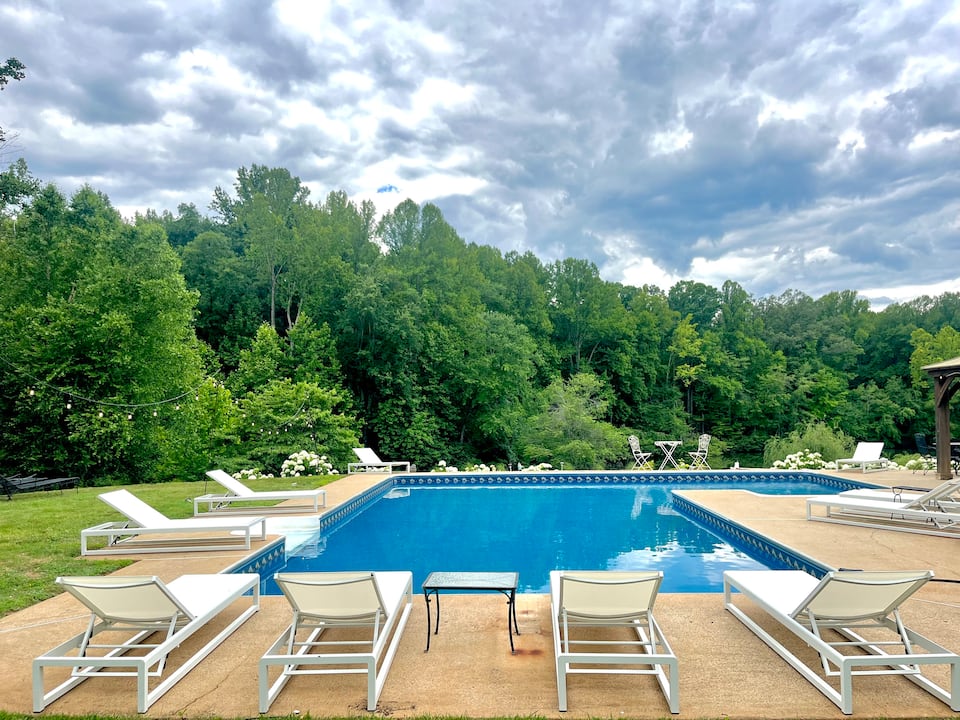
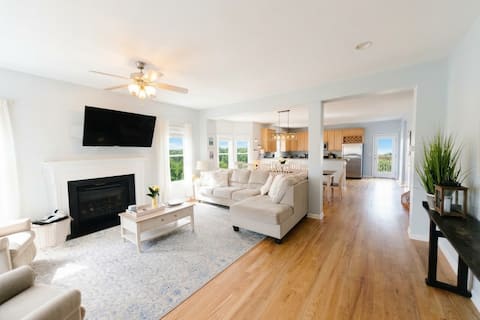
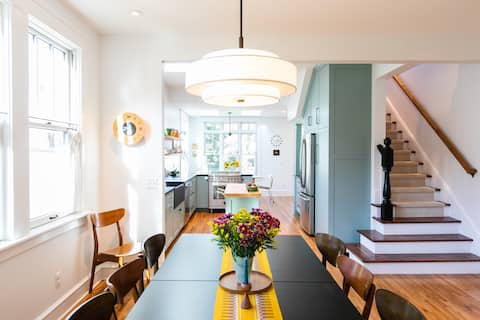
Top-earning Airbnb listings in Charlottesville - Avg. revenue
- $38,100 +8% vs. last year
- Occupancy
- 43%
- Nightly rate
- $345
- Active listings
- 688
Where it places among the 44 ranked markets in Virginia
- Revenue 16th of 44
- Occupancy 13th of 44
- Market size 7th of 44
- Year-round 18th of 44
- Growth 21st of 41
- How it earns
- Demand runs high in Charlottesville: 43% of nights booked, 3 points above the Virginia average, at about $345 a night. Listings averaged $38,100 in revenue over the year, 14% above the Virginia average. In a typical month the median listing brings in about $3,020, and the best quarter clear $5,380. Revenue per listing rose 8% over the year, helped by nightly rates 14% higher.
- When it earns
- In Charlottesville, the months from April to November earn above the yearly average, led by May at about $5,610 per listing; February is the low point at about $2,790. Guests book early, about 62 days ahead against roughly 50 for the typical market in Virginia, and stay about 5 nights.
- What sells
- One-bedroom homes lead the market (30% of entire homes), and houses make up 52% of supply.
Revenue per listing by month
$5,610 $2,790- Median listing
- $3,020/mo
- Top 25% of listings
- $5,380+/mo
- Booked ahead
- 62 days
- Average stay
- 5 nights
- Most common home size
- 1 bedroom
- Superhosts
- 70%
Areas in the full report: Downtown Charlottesville · University of Virginia · Monticello
Full Charlottesville Airbnb report6. McGaheysville
Known for: High earnings · High occupancy
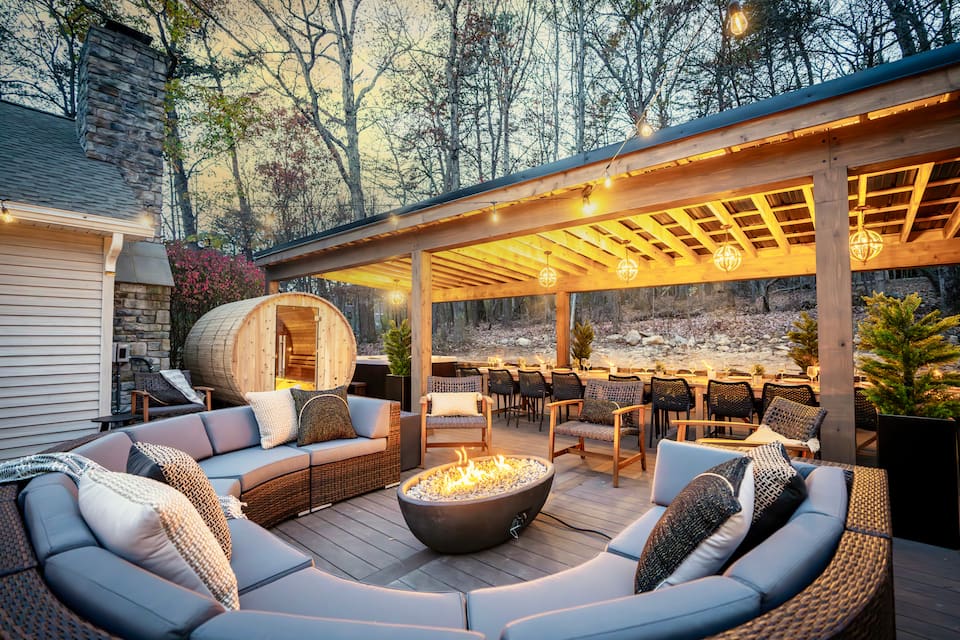


Top-earning Airbnb listings in McGaheysville - Avg. revenue
- $75,500
- Occupancy
- 42%
- Nightly rate
- $490
- Active listings
- 153
Where it places among the 44 ranked markets in Virginia
- Revenue 2nd of 44
- Occupancy 17th of 44
- Market size 31st of 44
- Year-round 20th of 44
- Growth No prior year
- How it earns
- McGaheysville earns on price: guests pay about $490 a night, 64% above the Virginia average. Average revenue per listing came to $75,500, the second-highest of the 44 ranked markets. Month to month, the median listing earns about $6,060 and a top-quarter listing $11,200 or more. Its 153 listings make it one of the smaller ranked markets, so its figures are less settled than those of larger ones.
- When it earns
- Revenue in McGaheysville peaks twice, over June–August and again over November–January; July leads at about $11,200 per listing, while September brings in about $5,510. Visits are quick, about 3 nights on average against 4 nights for the typical market in Virginia, booked about 49 days ahead. Most hosts take one- or two-night bookings (92% of listings), more than in the typical market.
- What sells
- Big homes set the market: 90% of entire homes have three or more bedrooms, against about 50% in the typical market in Virginia, and houses make up 88% of supply.
- Who it suits
- A good fit for buyers who want a large home for groups and families and can furnish and price for a premium stay.
Revenue per listing by month
$11,200 $5,510- Median listing
- $6,060/mo
- Top 25% of listings
- $11,200+/mo
- Booked ahead
- 49 days
- Average stay
- 3 nights
- Most common home size
- 5+ bedrooms
- Superhosts
- 72%
7. Mineral
Known for: Growing revenue · High earnings
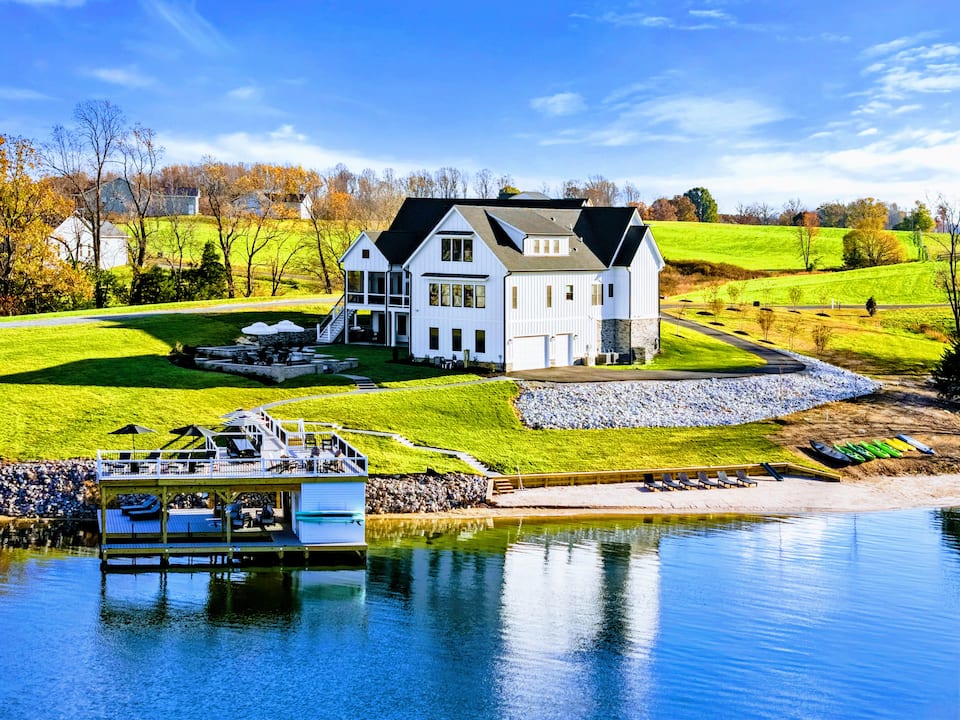
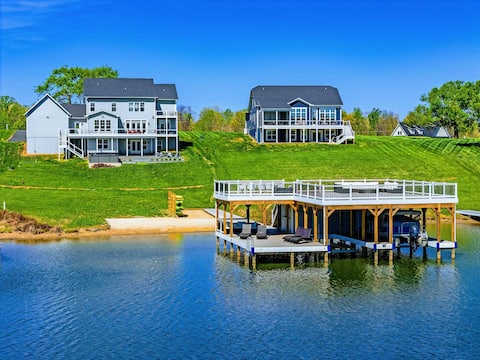
Top-earning Airbnb listings in Mineral - Avg. revenue
- $75,400 +31% vs. last year
- Occupancy
- 38%
- Nightly rate
- $565
- Active listings
- 254
Where it places among the 44 ranked markets in Virginia
- Revenue 3rd of 44
- Occupancy 26th of 44
- Market size 17th of 44
- Year-round 38th of 44
- Growth 2nd of 41
- How it earns
- Nightly rates set Mineral apart: about $565, 89% above the Virginia average. That adds up to $75,400 per listing over the year, the third-highest of the 44 ranked markets. The gap between listings is wide: a typical one takes in about $5,440 a month, while the top quarter clear $11,400 and the top 10% $21,300, so pricing and presentation count for more here than in most of Virginia. Revenue per listing rose 31% over the year, the second-biggest gain in Virginia, helped by nightly rates 24% higher, even as the number of listings grew 22%. With 254 listings it is a small market, so its averages can move more from year to year.
- When it earns
- Mineral's season runs from May to September, peaking in July at about $15,700 per listing; February, the quietest month, brings in about $3,980.
- What sells
- Big homes set the market: 89% of entire homes have three or more bedrooms, against about 50% in the typical market in Virginia, and houses make up 87% of supply.
- Guest expectations
- Average ratings (4.78 stars) trail the typical market in Virginia (4.86), which leaves room for a well-run listing to stand out.
- Who it suits
- It suits buyers who can furnish and price for a premium stay and can ride out a slow February.
Revenue per listing by month
$15,700 $3,980- Median listing
- $5,440/mo
- Top 25% of listings
- $11,400+/mo
- Booked ahead
- 59 days
- Average stay
- 4 nights
- Most common home size
- 5+ bedrooms
- Superhosts
- 46%
8. Arlington
Known for: Large market · High occupancy
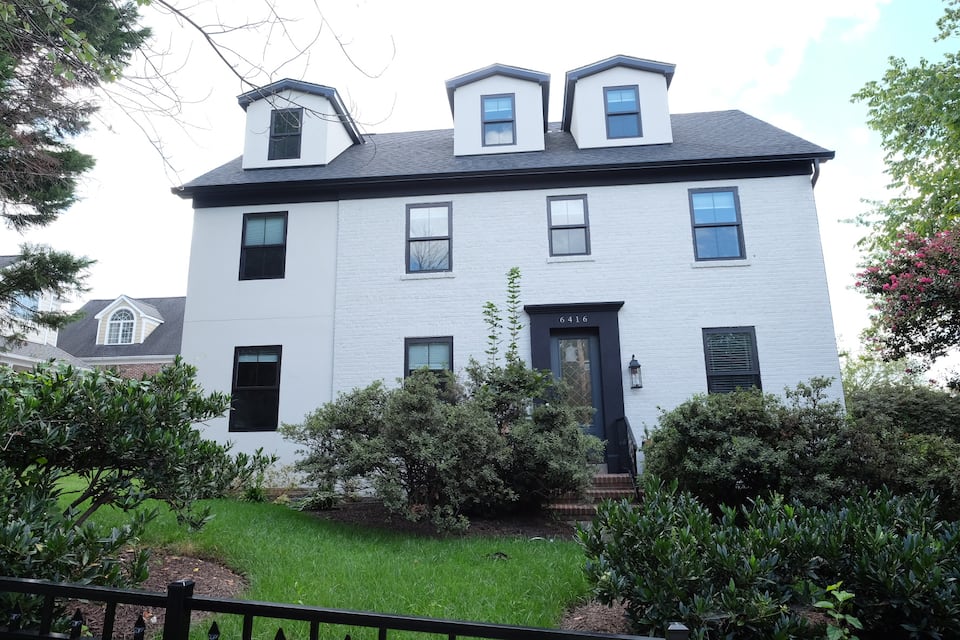
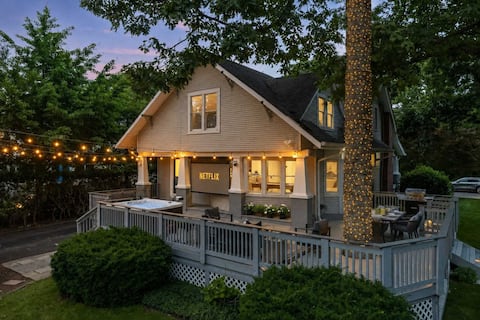

Top-earning Airbnb listings in Arlington - Avg. revenue
- $33,200 −5% vs. last year
- Occupancy
- 46%
- Nightly rate
- $275
- Active listings
- 993
Where it places among the 44 ranked markets in Virginia
- Revenue 22nd of 44
- Occupancy 6th of 44
- Market size 4th of 44
- Year-round 11th of 44
- Growth 39th of 41
- How it earns
- Arlington books 46% of available nights, the sixth-highest occupancy of the 44 ranked markets, and charges about $275 a night. Revenue per listing, $33,200, is close to the Virginia average. Its place at #8 rests on market size (4th of 44) and occupancy (6th of 44) rather than on revenue per listing. The gap between listings is wide: a typical one takes in about $3,220 a month, while the top quarter clear $6,220 and the top 10% $9,360, so pricing and presentation count for more here than in most of Virginia. Revenue per listing slipped 5% over the year even with rates 11% higher, as bookings softened.
- When it earns
- Revenue in Arlington concentrates from March to July: June earns about $5,950 per listing, about 1.9 times as much as February. Trips run long, about 6 nights on average against 4 nights for the typical market in Virginia, booked about 38 days ahead.
- What sells
- Smaller places set the market: only 23% of entire homes have three or more bedrooms, against about 50% in the typical market in Virginia; apartments and condos make up 56% of supply.
- Guest expectations
- Average ratings (4.75 stars) trail the typical market in Virginia (4.86), which leaves room for a well-run listing to stand out.
- Who it suits
- Best for buyers who prefer a smaller one- or two-bedroom place.
Revenue per listing by month
$5,950 $3,200- Median listing
- $3,220/mo
- Top 25% of listings
- $6,220+/mo
- Booked ahead
- 38 days
- Average stay
- 6 nights
- Most common home size
- 2 bedrooms
- Superhosts
- 38%
Areas in the full report: Clarendon · Ballston · Crystal City
Full Arlington Airbnb report9. Luray
Known for: Large market · High earnings
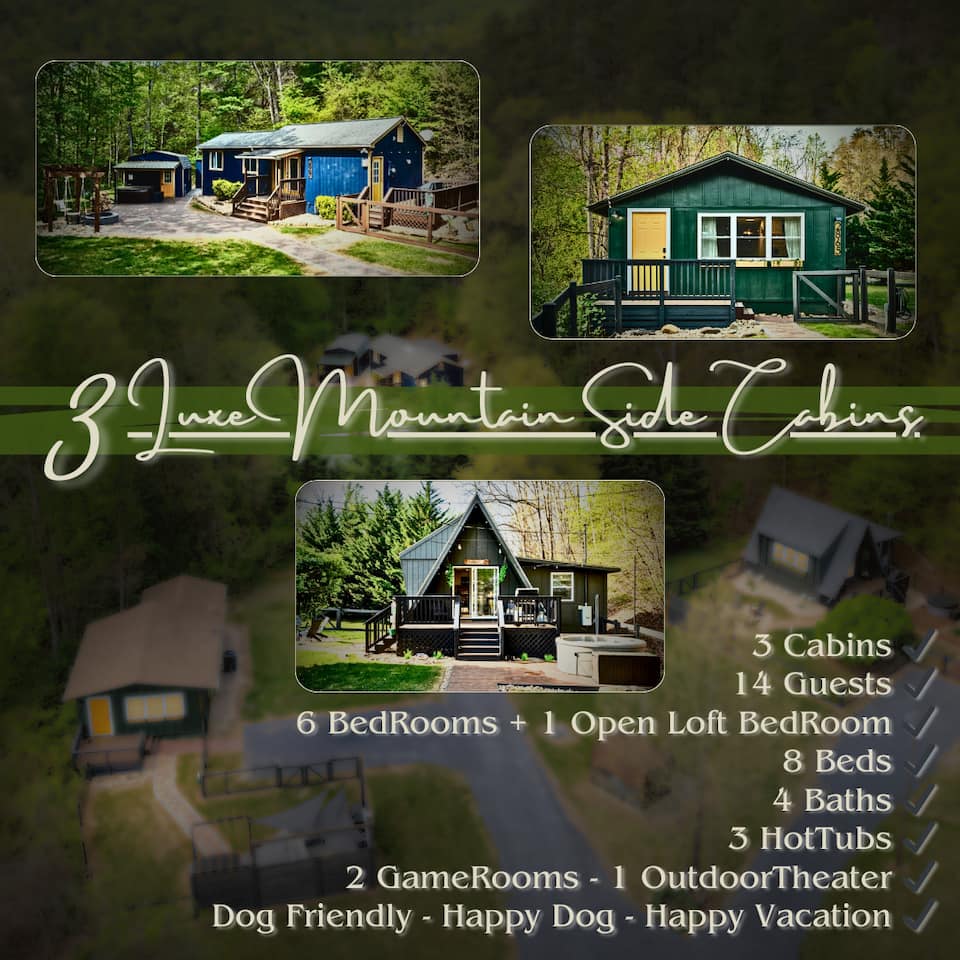


Top-earning Airbnb listings in Luray - Avg. revenue
- $42,000 +9% vs. last year
- Occupancy
- 42%
- Nightly rate
- $300
- Active listings
- 407
Where it places among the 44 ranked markets in Virginia
- Revenue 15th of 44
- Occupancy 15th of 44
- Market size 10th of 44
- Year-round 28th of 44
- Growth 19th of 41
- How it earns
- Luray books 42% of nights at about $300 a night, close to the typical market in Virginia. Average revenue per listing came to $42,000, 25% above the Virginia average. A typical listing takes in about $3,520 a month; the top quarter clear $5,760 or more. Revenue per listing rose 9% over the year, helped by nightly rates 8% higher, even as the number of listings grew 15%.
- When it earns
- In Luray, the months from May to October earn above the yearly average, led by July at about $5,370 per listing; February is the low point at about $2,500. Stays are shorter than in most of Virginia, about 3 nights, so listings turn over often; guests book about 47 days ahead. Most hosts take one- or two-night bookings (97% of listings), more than in the typical market.
- What sells
- The most common entire home has 2 bedrooms (35% of entire homes), and cabins, campers and other outdoor stays make up 51% of supply.
- Who books
- Guests are overwhelmingly domestic (87%); the most common home cities are Washington, New York and Richmond.
Revenue per listing by month
$5,370 $2,500- Median listing
- $3,520/mo
- Top 25% of listings
- $5,760+/mo
- Booked ahead
- 47 days
- Average stay
- 3 nights
- Most common home size
- 2 bedrooms
- Superhosts
- 76%
Areas in the full report: Luray Caverns · Shenandoah National Park · Historic Downtown Luray
Full Luray Airbnb report10. Shenandoah
Known for: High earnings · High occupancy
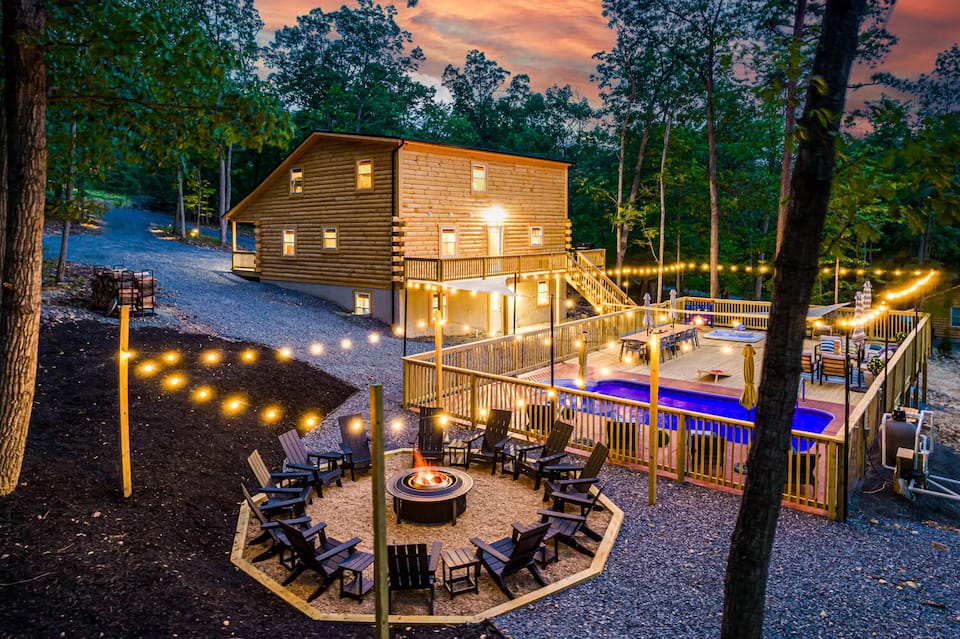
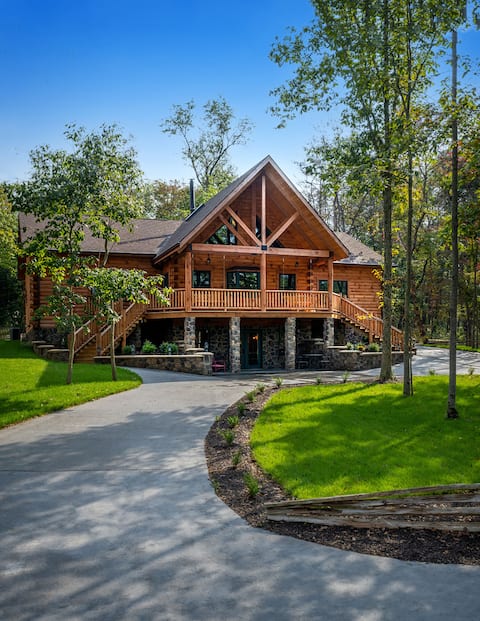
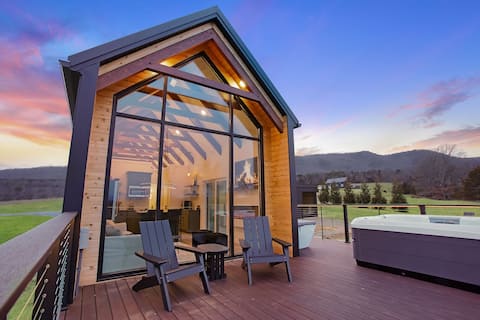
Top-earning Airbnb listings in Shenandoah - Avg. revenue
- $62,200 +7% vs. last year
- Occupancy
- 47%
- Nightly rate
- $390
- Active listings
- 107
Where it places among the 44 ranked markets in Virginia
- Revenue 4th of 44
- Occupancy 5th of 44
- Market size 40th of 44
- Year-round 29th of 44
- Growth 22nd of 41
- How it earns
- Shenandoah fills more nights than most of Virginia: 47% of them, the fifth-highest occupancy of the 44 ranked markets, at about $390 a night. That adds up to $62,200 per listing over the year, the fourth-highest of the 44 ranked markets. In a typical month the median listing brings in about $4,780, and the best quarter clear $7,660. Revenue per listing rose 7% over the year, helped by nightly rates 13% higher, even as the number of listings grew 15%. Its 107 listings make it one of the smaller ranked markets, so its figures are less settled than those of larger ones.
- When it earns
- Shenandoah has two seasons, June–August and October–November. July is the strongest month at about $8,070 per listing, and February the quietest at about $3,520. Visits are quick, about 2.8 nights on average against 4 nights for the typical market in Virginia, booked about 46 days ahead. Most hosts take one- or two-night bookings (95% of listings), more than in the typical market.
- What sells
- Three-bedroom homes lead the market (35% of entire homes), and cabins, campers and other outdoor stays make up 59% of supply.
- Who books
- Guests are overwhelmingly domestic (88%); the most common home cities are Washington, Richmond and New York.
Revenue per listing by month
$8,070 $3,520- Median listing
- $4,780/mo
- Top 25% of listings
- $7,660+/mo
- Booked ahead
- 46 days
- Average stay
- 2.8 nights
- Most common home size
- 3 bedrooms
- Superhosts
- 81%
Full ranking
How All 44 Ranked Markets in Virginia Compare
The overall ranking with the five measures behind it. "Slow month" is a market's weakest month of revenue as a share of its best, so a higher figure means steadier income. Select a column heading to re-sort.
| Alexandria High occupancy, large market | $45,590 | 48% | $317 | 50% | −1% | 694 | |
| Virginia Beach Large market, growing revenue | $45,852 | 42% | $414 | 25% | +29% | 1,388 | |
| Stanley High earnings, high occupancy | $59,666 | 46% | $359 | 54% | +19% | 113 | |
| 4 | Richmond Year-round demand, large market | $29,378 | 47% | $204 | 70% | +4% | 1,044 |
| 5 | Charlottesville Large market, high occupancy | $38,130 | 43% | $345 | 50% | +8% | 688 |
| 6 | McGaheysville High earnings, high occupancy | $75,451 | 42% | $490 | 49% | – | 153 |
| 7 | Mineral Growing revenue, high earnings | $75,427 | 38% | $567 | 25% | +31% | 254 |
| 8 | Arlington Large market, high occupancy | $33,209 | 46% | $274 | 54% | −5% | 993 |
| 9 | Luray Large market, high earnings | $42,017 | 42% | $302 | 46% | +9% | 407 |
| 10 | Shenandoah High earnings, high occupancy | $62,176 | 47% | $392 | 44% | +7% | 107 |
| 11 | Afton High earnings, year-round demand | $55,685 | 42% | $406 | 53% | 0% | 155 |
| 12 | Cape Charles High earnings, growing revenue | $52,894 | 39% | $479 | 18% | +16% | 307 |
| 13 | Norfolk Large market, growing revenue | $27,963 | 43% | $224 | 37% | +22% | 823 |
| 14 | Leesburg High occupancy, high earnings | $45,144 | 47% | $351 | 49% | +1% | 106 |
| 15 | Massanutten High earnings, growing revenue | $50,122 | 33% | $427 | 48% | +11% | 289 |
| 16 | Wintergreen Resort High earnings, year-round demand | $45,057 | 36% | $400 | 51% | – | 196 |
| 17 | Bumpass High earnings, growing revenue | $75,546 | 36% | $683 | 21% | +42% | 144 |
| 18 | Richmond City High occupancy, year-round demand | $24,920 | 45% | $209 | 55% | – | 190 |
| 19 | Hampton Growing revenue | $32,672 | 40% | $284 | 39% | +22% | 271 |
| 20 | Basye Year-round demand, growing revenue | $29,590 | 36% | $248 | 64% | +12% | 249 |
| 21 | Roanoke Year-round demand, large market | $20,388 | 43% | $164 | 58% | +9% | 337 |
| 22 | Mount Jackson Year-round demand, growing revenue | $35,330 | 37% | $296 | 66% | +26% | 102 |
| 23 | Portsmouth High occupancy, growing revenue | $27,021 | 43% | $215 | 47% | +12% | 181 |
| 24 | Moneta Growing revenue, high earnings | $43,879 | 37% | $475 | 17% | +16% | 182 |
| 25 | Wintergreen Large market, high earnings | $37,768 | 35% | $341 | 41% | +10% | 316 |
| 26 | Front Royal Year-round demand | $37,242 | 38% | $296 | 57% | +6% | 112 |
| 27 | Lynchburg Large market, growing revenue | $21,868 | 42% | $189 | 44% | +14% | 526 |
| 28 | Stanardsville Year-round demand | $30,488 | 38% | $244 | 53% | +4% | 164 |
| 29 | Huddleston Growing revenue, high earnings | $43,935 | 34% | $457 | 17% | +18% | 188 |
| 30 | Staunton Year-round demand | $27,196 | 41% | $251 | 53% | +3% | 165 |
| 31 | Blacksburg Large market, high earnings | $37,972 | 36% | $560 | 32% | −8% | 326 |
| 32 | Fredericksburg Year-round demand | $21,266 | 40% | $185 | 62% | +2% | 162 |
| 33 | Chesapeake High occupancy, growing revenue | $20,836 | 47% | $183 | 47% | +16% | 115 |
| 34 | Harrisonburg Year-round demand | $22,788 | 40% | $202 | 57% | −1% | 154 |
| 35 | Lexington | $36,145 | 36% | $363 | 41% | +2% | 139 |
| 36 | Newport News High occupancy | $23,806 | 45% | $213 | 48% | +6% | 101 |
| 37 | Chincoteague Large market | $26,032 | 37% | $317 | 19% | −3% | 474 |
| 38 | Danville Year-round demand, growing revenue | $21,482 | 37% | $210 | 54% | +11% | 122 |
| 39 | Colonial Beach | $26,396 | 37% | $248 | 29% | 0% | 177 |
| 40 | Abingdon | $24,069 | 38% | $217 | 49% | −1% | 126 |
| 41 | Reston Year-round demand, growing revenue | $18,550 | 31% | $272 | 55% | +15% | 166 |
| 42 | Winchester Year-round demand | $20,339 | 42% | $196 | 62% | −9% | 100 |
| 43 | Williamsburg Large market | $15,554 | 25% | $246 | 39% | +1% | 1,187 |
| 44 | Damascus | $18,758 | 33% | $214 | 49% | +4% | 120 |
By measure
Virginia Airbnb Markets Ranked by Revenue, Nightly Rate and Occupancy
The overall ranking balances five measures. These lists take one at a time, for buyers who care most about income, pricing power, bookings, a steady calendar, momentum or market size.
Highest-earning Airbnb markets in Virginia
Average annual revenue per active listing over the past 12 months. Markets with at least 200 listings.
| # | Market | Revenue |
|---|---|---|
| Mineral #7 overall | $75,400 | |
| Cape Charles #12 overall | $52,900 | |
| Massanutten #15 overall | $50,100 | |
| 4 | Virginia Beach #2 overall | $45,900 |
| 5 | Alexandria #1 overall | $45,600 |
| 6 | Luray #9 overall | $42,000 |
| 7 | Charlottesville #5 overall | $38,100 |
| 8 | Blacksburg #31 overall | $38,000 |
| 9 | Wintergreen #25 overall | $37,800 |
| 10 | Arlington #8 overall | $33,200 |
| 11 | Hampton #19 overall | $32,700 |
| 12 | Basye #20 overall | $29,600 |
| 13 | Richmond #4 overall | $29,400 |
| 14 | Norfolk #13 overall | $28,000 |
| 15 | Chincoteague #37 overall | $26,000 |
| 16 | Lynchburg #27 overall | $21,900 |
| 17 | Roanoke #21 overall | $20,400 |
| 18 | Williamsburg #43 overall | $15,600 |
Most expensive Airbnb markets in Virginia by nightly rate
Average rate per booked night. A high rate earns most where occupancy holds up too. Markets with at least 200 listings.
| # | Market | Nightly |
|---|---|---|
| Mineral #7 overall | $565 | |
| Blacksburg #31 overall | $560 | |
| Cape Charles #12 overall | $480 | |
| 4 | Massanutten #15 overall | $425 |
| 5 | Virginia Beach #2 overall | $415 |
| 6 | Charlottesville #5 overall | $345 |
| 7 | Wintergreen #25 overall | $340 |
| 8 | Alexandria #1 overall | $315 |
| 9 | Chincoteague #37 overall | $315 |
| 10 | Luray #9 overall | $300 |
| 11 | Hampton #19 overall | $285 |
| 12 | Arlington #8 overall | $275 |
| 13 | Basye #20 overall | $250 |
| 14 | Williamsburg #43 overall | $245 |
| 15 | Norfolk #13 overall | $225 |
| 16 | Richmond #4 overall | $205 |
| 17 | Lynchburg #27 overall | $190 |
| 18 | Roanoke #21 overall | $165 |
Highest-occupancy Airbnb markets in Virginia
Share of available nights booked over the past 12 months. Markets with at least 200 listings.
| # | Market | Occupancy |
|---|---|---|
| Alexandria #1 overall | 48% | |
| Richmond #4 overall | 47% | |
| Arlington #8 overall | 46% | |
| 4 | Norfolk #13 overall | 43% |
| 5 | Roanoke #21 overall | 43% |
| 6 | Charlottesville #5 overall | 43% |
| 7 | Virginia Beach #2 overall | 42% |
| 8 | Luray #9 overall | 42% |
| 9 | Lynchburg #27 overall | 42% |
| 10 | Hampton #19 overall | 40% |
| 11 | Cape Charles #12 overall | 39% |
| 12 | Mineral #7 overall | 38% |
| 13 | Chincoteague #37 overall | 37% |
| 14 | Basye #20 overall | 36% |
| 15 | Blacksburg #31 overall | 36% |
| 16 | Wintergreen #25 overall | 35% |
| 17 | Massanutten #15 overall | 33% |
| 18 | Williamsburg #43 overall | 25% |
Most year-round Airbnb markets in Virginia
Revenue in the slowest month as a share of the best month, so a higher figure means steadier income. Markets with at least 200 listings.
| # | Market | Slow month |
|---|---|---|
| Richmond #4 overall | 70% | |
| Basye #20 overall | 64% | |
| Roanoke #21 overall | 58% | |
| 4 | Arlington #8 overall | 54% |
| 5 | Alexandria #1 overall | 50% |
| 6 | Charlottesville #5 overall | 50% |
| 7 | Massanutten #15 overall | 48% |
| 8 | Luray #9 overall | 46% |
| 9 | Lynchburg #27 overall | 44% |
| 10 | Wintergreen #25 overall | 41% |
| 11 | Williamsburg #43 overall | 39% |
| 12 | Hampton #19 overall | 39% |
| 13 | Norfolk #13 overall | 37% |
| 14 | Blacksburg #31 overall | 32% |
| 15 | Virginia Beach #2 overall | 25% |
| 16 | Mineral #7 overall | 25% |
| 17 | Chincoteague #37 overall | 19% |
| 18 | Cape Charles #12 overall | 18% |
Fastest-growing Airbnb markets in Virginia
Change in revenue per listing from the year before, among markets where it rose. Markets with at least 200 listings.
| # | Market | Change |
|---|---|---|
| Mineral #7 overall | +31% | |
| Virginia Beach #2 overall | +29% | |
| Hampton #19 overall | +22% | |
| 4 | Norfolk #13 overall | +22% |
| 5 | Cape Charles #12 overall | +16% |
| 6 | Lynchburg #27 overall | +14% |
| 7 | Basye #20 overall | +12% |
| 8 | Massanutten #15 overall | +11% |
| 9 | Wintergreen #25 overall | +10% |
| 10 | Luray #9 overall | +9% |
| 11 | Roanoke #21 overall | +9% |
| 12 | Charlottesville #5 overall | +8% |
| 13 | Richmond #4 overall | +4% |
| 14 | Williamsburg #43 overall | +1% |
Largest Airbnb markets in Virginia
Active listings. Bigger markets have more comparable rentals to price against and more buyers at resale.
| # | Market | Listings |
|---|---|---|
| Virginia Beach #2 overall | 1,390 | |
| Williamsburg #43 overall | 1,190 | |
| Richmond #4 overall | 1,040 | |
| 4 | Arlington #8 overall | 993 |
| 5 | Norfolk #13 overall | 823 |
| 6 | Alexandria #1 overall | 694 |
| 7 | Charlottesville #5 overall | 688 |
| 8 | Lynchburg #27 overall | 526 |
| 9 | Chincoteague #37 overall | 474 |
| 10 | Luray #9 overall | 407 |
| 11 | Roanoke #21 overall | 337 |
| 12 | Blacksburg #31 overall | 326 |
| 13 | Wintergreen #25 overall | 316 |
| 14 | Cape Charles #12 overall | 307 |
| 15 | Massanutten #15 overall | 289 |
| 16 | Hampton #19 overall | 271 |
| 17 | Mineral #7 overall | 254 |
| 18 | Basye #20 overall | 249 |
| 19 | Wintergreen Resort #16 overall | 196 |
| 20 | Richmond City #18 overall | 190 |
| 21 | Huddleston #29 overall | 188 |
| 22 | Moneta #24 overall | 182 |
| 23 | Portsmouth #23 overall | 181 |
| 24 | Colonial Beach #39 overall | 177 |
| 25 | Reston #41 overall | 166 |
Seasonality
When Airbnbs in Virginia Earn the Most
July is the best month for more than two-thirds of ranked markets in Virginia. February is the most common slowest month, in 27 markets.
July earns about 2.3 times what February does
Average revenue per listing across the 44 ranked markets in Virginia, by month
| Month | Avg. revenue per listing | Best month for | Highest-ranked examples |
|---|---|---|---|
| January | $2,780 | 2 markets | Wintergreen Resort, Wintergreen |
| February | $2,610 | – | – |
| March | $3,250 | – | – |
| April | $3,590 | – | – |
| May | $4,300 | 3 markets | Charlottesville, Lynchburg, Lexington |
| June | $5,320 | 3 markets | Alexandria, Arlington, Reston |
| July | $5,980 | 30 markets | Virginia Beach, Richmond, McGaheysville |
| August | $5,210 | 1 market | Danville |
| September | $3,950 | – | – |
| October | $3,850 | 4 markets | Stanley, Afton, Stanardsville |
| November | $3,260 | – | – |
| December | $3,370 | 1 market | Mount Jackson |
Average revenue is per listing across the ranked markets, the line in the chart above. "Best month for" counts the ranked markets whose own revenue peaks in that month.
Management
Who Manages Airbnbs in Virginia?
AirROI ranks the 50 largest of the 155 companies that run 5 or more Airbnb listings in Virginia, by listings, guest rating and growth; companies run 20% of its listings.
Method
How the Ranking Works
The ranking covers the 44 markets in Virginia with at least 100 active Airbnb listings and data through October 2026. Each market is compared with the others on five measures, and markets are ordered by a weighted blend of where they place on each:
- Revenue per listing (35%): average revenue an active listing earned over the past 12 months.
- Occupancy (20%): share of available nights that were booked.
- Market size (20%): active listings. Bigger markets offer more comparable rentals to price against and more buyers when you sell.
- Year-round demand (15%): revenue in the slowest month as a share of the best month. The latest month is left out when its bookings look incomplete.
- Growth (10%): change in revenue per listing from the year before. Markets whose boundaries changed between years are scored in the middle.
Left out: 50 markets whose data predate the latest refresh. The score measures how rentals perform. It does not include purchase prices, financing, operating costs or local short-term rental rules, which vary by address and should be checked before buying. Figures are in US dollars and match each market's own report; see the data methodology for how listings are tracked.
To check one property before buying, run its address and size through the Airbnb estimator for a revenue, occupancy and nightly-rate range from comparable listings.
FAQ
Frequently Asked Questions About Airbnb Investing in Virginia
What is the best place to buy an Airbnb in Virginia?
Alexandria ranks first of the 44 markets in Virginia in AirROI's ranking, with $45,600 in average revenue per listing and 48% occupancy. Virginia Beach and Stanley follow. The ranking weighs revenue, occupancy, market size, seasonality and growth; it leaves out purchase prices.
What are the most profitable Airbnb locations in Virginia?
By revenue per listing, among markets with at least 200 listings, Mineral leads at $75,400 a year, ahead of Cape Charles at $52,900. Profit also depends on what a property costs to buy and run, which varies far more between markets than revenue does.
How much does an Airbnb make in Virginia?
The average active listing in Virginia earned $33,600 over the 12 months to October 2026, at 40% occupancy. Across the ranked markets, the middle half averaged between $23,800 and $45,100 per listing. Averages include listings that operated for only part of the year, so a listing rented all year typically earns more.
What is a good Airbnb occupancy rate in Virginia?
The average listing in Virginia was booked on 40% of available nights over the past 12 months. Half of the ranked markets fall between 36% and 43%, so a market above about 43% sits in the top quarter. Occupancy is only half the picture: a market with lower occupancy can still earn more if its nightly rates are higher.
Where is Airbnb demand highest in Virginia?
Among ranked markets with at least 200 listings, Alexandria has the highest occupancy, with 48% of available nights booked, followed by Richmond at 47%. Its listings average about $315 a night and $45,600 a year.
Where are Airbnb nightly rates highest in Virginia?
Among ranked markets with at least 200 listings, Mineral has the highest average nightly rate, about $565, followed by Blacksburg at $560. Roanoke is the least expensive, at about $165. The average booked night in Virginia costs about $300.
What is the best month for Airbnb in Virginia?
July is the highest-earning month for 30 of the 44 ranked markets, followed by October (4). February is the most common slowest month, in 27 of the 44 markets. Each market's report shows its own month-by-month revenue, occupancy and rates.
Which Airbnb markets in Virginia earn the most evenly through the year?
Among ranked markets with at least 200 listings, Richmond has the steadiest income: its slowest month, February, still earns about two-thirds of its best. Basye follows, at 64%. Steadier markets are easier to budget for, though they do not always earn the most per listing.
Which Airbnb markets are growing fastest in Virginia?
Among ranked markets with at least 200 listings, revenue per listing grew most in Mineral, up 31% on the year before, and in Virginia Beach, up 29%. A single strong year can reflect events or new supply, so it is worth checking a market's monthly trend before relying on it.
Is Airbnb still profitable in Virginia in 2026?
Revenue per listing grew in 33 of the 41 ranked markets with a comparable year of data; in the typical market it rose 8%. Whether a given property profits depends on its purchase price, financing and running costs.
What are the best smaller Airbnb markets in Virginia?
Among ranked markets with fewer than 150 active listings, Stanley (#3 overall, $59,700 per listing), Shenandoah (#10, $62,200) and Leesburg (#14, $45,100) place highest. Smaller markets have fewer comparable rentals to price against, so their averages can move more from year to year.
How many Airbnb listings are there in Virginia?
AirROI tracked 20,800 active Airbnb listings in Virginia over the 12 months to October 2026, across 220 markets. The largest ranked market is Virginia Beach, with 1,390 listings, followed by Williamsburg with 1,190.
Directory
All 220 Airbnb Markets in Virginia
Every Virginia city with an AirROI Airbnb market report, A–Z, with its active listing count.
A
- Abingdon 126 listings
- Afton 155 listings
- Alexandria 694 listings
- Alton 19 listings
- Amherst 44 listings
- Annandale 69 listings
- Appomattox 34 listings
- Arlington 993 listings
- Ashburn 20 listings
- Ashland 18 listings
B
- Bailey's Crossroads 19 listings
- Barboursville 18 listings
- Basye 249 listings
- Bedford 63 listings
- Bedford County 29 listings
- Bentonville 24 listings
- Berryville 26 listings
- Blacksburg 326 listings
- Blackstone 22 listings
- Bluemont 53 listings
- Bon Air 20 listings
- Boydton 31 listings
- Bracey 55 listings
- Bridgewater 20 listings
- Broadway 36 listings
- Buena Vista 58 listings
- Bumpass 144 listings
- Burke 19 listings
C
- Cape Charles 307 listings
- Captains Cove 26 listings
- Cave Spring 20 listings
- Centreville 45 listings
- Chantilly 37 listings
- Charlottesville 688 listings
- Cheriton 20 listings
- Cherry Hill 19 listings
- Chesapeake 115 listings
- Chester 30 listings
- Chesterfield 41 listings
- Chincoteague 474 listings
- Christiansburg 94 listings
- Clarksville 63 listings
- Clifton Forge 31 listings
- Colonial Beach 177 listings
- Countryside 17 listings
- Covington 30 listings
- Crozet 63 listings
- Culpeper 77 listings
D
E
- Eagle Rock 18 listings
- Edinburg 30 listings
- Elkton 77 listings
- Emporia 18 listings
- Etlan 23 listings
F
- Faber 27 listings
- Fairfax 71 listings
- Falls Church 82 listings
- Falls Church City 32 listings
- Fancy Gap 68 listings
- Farmville 36 listings
- Floyd 95 listings
- Forest 73 listings
- Fort Valley 44 listings
- Franconia 22 listings
- Fredericksburg 162 listings
- Fredericksburg City 30 listings
- Free Union 17 listings
- Fries 36 listings
- Front Royal 112 listings
G
- Galax 64 listings
- Glen Allen 43 listings
- Gloucester 39 listings
- Gloucester Point 17 listings
- Goodview 34 listings
- Gordonsville 73 listings
- Groveton 22 listings
H
- Hamilton 24 listings
- Hampton 271 listings
- Hampton City 50 listings
- Harrisonburg 154 listings
- Heathsville 34 listings
- Henrico 19 listings
- Herndon 83 listings
- Hillsville 50 listings
- Hinton 18 listings
- Hiwassee 18 listings
- Hopewell 41 listings
- Hot Springs 32 listings
- Huddleston 188 listings
- Huntington 21 listings
I
- Independence 26 listings
- Irvington 25 listings
K
- Keswick 23 listings
- Kilmarnock 31 listings
- Kinsale 17 listings
L
- Lake Ridge 20 listings
- Lakeside 19 listings
- Lancaster 31 listings
- Leesburg 106 listings
- Leesylvania 24 listings
- Lexington 139 listings
- Lincolnia 22 listings
- Locust Grove 28 listings
- Lorton 22 listings
- Louisa 49 listings
- Lovettsville 39 listings
- Lovingston 18 listings
- Luray 407 listings
- Lynchburg 526 listings
- Lyndhurst 29 listings
M
- Madison 65 listings
- Madison Heights 24 listings
- Manassas 66 listings
- Marion 22 listings
- Marshall 26 listings
- Martinsville 73 listings
- Massanetta Springs 24 listings
- Massanutten 289 listings
- Maurertown 19 listings
- McGaheysville 153 listings
- McLean 34 listings
- McNair 18 listings
- Meadows of Dan 37 listings
- Mechanicsville 39 listings
- Merrifield 19 listings
- Middleburg 43 listings
- Middletown 28 listings
- Midlothian 55 listings
- Mineral 254 listings
- Moneta 182 listings
- Monterey 25 listings
- Montross 48 listings
- Mount Jackson 102 listings
- Mount Vernon 22 listings
- Mouth of Wilson 36 listings
N
- Nellysford 78 listings
- New Castle 25 listings
- New Market 51 listings
- Newport News 101 listings
- Norfolk 823 listings
- North Shore 34 listings
- North Springfield 19 listings
P
- Paint Bank 18 listings
- Palmyra 18 listings
- Pearisburg 19 listings
- Penhook 23 listings
- Petersburg 88 listings
- Port Haywood 18 listings
- Portsmouth 181 listings
- Powhatan 24 listings
- Purcellville 75 listings
R
- Radford 42 listings
- Radford City 22 listings
- Reedville 53 listings
- Reston 166 listings
- Richmond 1,044 listings
- Richmond City 190 listings
- Rileyville 69 listings
- Rio 19 listings
- Roanoke 337 listings
- Rose Hill 22 listings
- Roseland 84 listings
- Round Hill 19 listings
- Ruckersville 24 listings
- Rustburg 25 listings
S
- Salem 29 listings
- Scottsville 35 listings
- Shenandoah 107 listings
- Shenandoah Farms 49 listings
- Sperryville 36 listings
- Spotsylvania Courthouse 58 listings
- Springfield 80 listings
- Stafford 94 listings
- Stanardsville 164 listings
- Stanley 113 listings
- Staunton 165 listings
- Stephens City 19 listings
- Sterling 55 listings
- Stone Ridge 18 listings
- Strasburg 37 listings
- Stuart 26 listings
- Suffolk 42 listings
- Surry 18 listings
- Syria 30 listings
T
- Tazewell 40 listings
- The Plains 29 listings
- Timberlake 25 listings
- Tuckahoe 21 listings
- Tyro 18 listings
- Tysons 58 listings
- Tysons Corner 26 listings
U
- Union Hall 22 listings
- Urbanna 18 listings
V
- Vienna 41 listings
- Virginia Beach 1,388 listings
W
- Wachapreague 21 listings
- Warm Springs 23 listings
- Warrenton 33 listings
- Waterford 28 listings
- Waynesboro 71 listings
- West Falls Church 41 listings
- White Stone 46 listings
- Williamsburg 1,187 listings
- Willis 17 listings
- Winchester 100 listings
- Wintergreen 316 listings
- Wintergreen Resort 196 listings
- Woodbridge 96 listings
- Woodlawn 18 listings
- Woodstock 45 listings