AirROI ranking · 202683 markets ranked
Best Places to Buy an Airbnb in Colorado (2026)
Bailey is the best place to buy an Airbnb in Colorado in 2026, according to AirROI's ranking of 83 markets. Its listings averaged $65,500 in revenue over the 12 months to October 2026 and were booked on 53% of nights. It leads on the blend rather than on any one measure, placing 2nd of 83 for revenue growth, 5th of 83 for occupancy and 6th of 83 for revenue per listing. With 157 active listings it is a small market, so its averages can move more from year to year than those of larger ones. Golden and Arvada come next.
- Markets tracked
- 183
- Active Airbnb listings
- 43,800
- Avg. revenue per listing
- $44,600
- Occupancy rate
- 41%
- Avg. nightly rate
- $415
- Revenue change, typical market
- +7%
The short answer
Colorado Airbnb Market at a Glance
Across Colorado, the 43,800 active Airbnb listings tracked by AirROI, a short-term-rental data firm, averaged $44,600 over the same period. They were booked on 41% of nights at about $415 a night; the ranking covers the 83 markets with at least 100 active listings. Revenue per listing rose in 64 of the 83 ranked markets with a comparable year of data, by 7% in the typical one.
The ranking weighs revenue per listing most, then occupancy and market size, then how evenly income spreads across the year and how it changed on the year. It reflects rental performance, not purchase prices or local short-term rental rules. How the ranking works.
Where the top 10 Airbnb markets in Colorado are
Each dot is one of the 183 markets AirROI tracks in Colorado (2 outlying ones fall outside the map), sized by active listings and coloured by average revenue per listing. Select a number to jump to its profile.
Top 10
The Top 10 Airbnb Markets in Colorado
Each profile draws on the market's full AirROI report: how it earns, when in the year, who books and what sells. Monthly figures are averages per listing active in that month, so twelve of them add up to more than the annual average, which also counts listings that operated for only part of the year.
| # | Market | Avg. revenue | Occupancy |
|---|---|---|---|
 Bailey Growing revenue · High occupancy | $65,500 | 53% | |
 Golden High occupancy · High earnings | $52,700 | 53% | |
 Arvada High occupancy · Large market | $48,000 | 50% | |
| 4 | 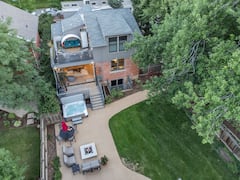 Boulder Large market · High earnings | $49,900 | 46% |
| 5 |  Wheat Ridge High occupancy · Growing revenue | $46,700 | 53% |
| 6 |  Centennial High occupancy · Growing revenue | $45,800 | 52% |
| 7 |  Zuni High occupancy · Growing revenue | $55,600 | 53% |
| 8 |  Denver Large market · Year-round demand | $32,300 | 50% |
| 9 |  Breckenridge Large market · High earnings | $67,200 | 39% |
| 10 |  Glenwood Springs High earnings · High occupancy | $64,000 | 47% |
1. Bailey
Known for: Growing revenue · High occupancy
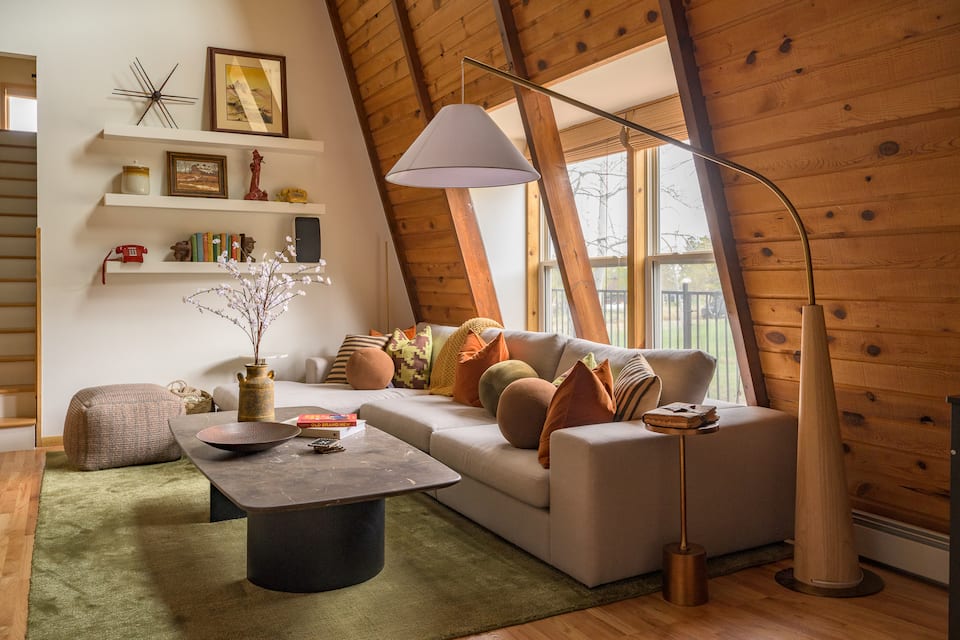

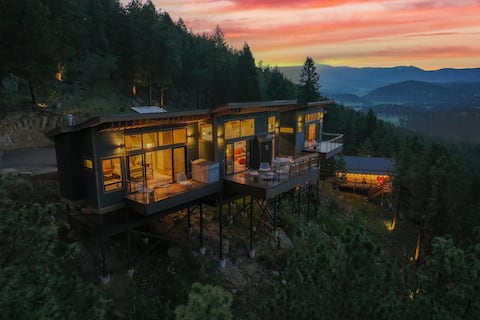
Top-earning Airbnb listings in Bailey - Avg. revenue
- $65,500 +30% vs. last year
- Occupancy
- 53%
- Nightly rate
- $375
- Active listings
- 157
Where it places among the 83 ranked markets in Colorado
- Revenue 6th of 83
- Occupancy 5th of 83
- Market size 57th of 83
- Year-round 25th of 83
- Growth 2nd of 83
- How it earns
- Bailey fills more nights than most of Colorado: 53% of them, the fifth-highest occupancy of the 83 ranked markets, at about $375 a night. That adds up to $65,500 per listing over the year, the sixth-highest of the 83 ranked markets. A typical listing takes in about $5,540 a month; the top quarter clear $9,050 or more. Revenue per listing rose 30% over the year, the second-biggest gain in Colorado, helped by nightly rates 24% higher, even as the number of listings grew 25%.
- When it earns
- Bailey's season runs from June to September, peaking in July at about $9,720 per listing; April, the quietest month, brings in about $3,930. Stays are shorter than in most of Colorado, about 4 nights, so listings turn over often; guests book about 50 days ahead. Most hosts take one- or two-night bookings (89% of listings), more than in the typical market.
- What sells
- Big homes set the market: 62% of entire homes have three or more bedrooms, against about 45% in the typical market in Colorado, and houses make up 47% of supply.
- Guest expectations
- Guests rate listings highly, 4.93 stars on average against 4.87 for the typical market in Colorado, so reviews set a high bar.
- Who it suits
- It suits buyers who can carry costs through a quiet April and want a large home for groups and families.
Revenue per listing by month
$9,720 $3,930- Median listing
- $5,540/mo
- Top 25% of listings
- $9,050+/mo
- Booked ahead
- 50 days
- Average stay
- 4 nights
- Most common home size
- 3 bedrooms
- Superhosts
- 88%
2. Golden
Known for: High occupancy · High earnings
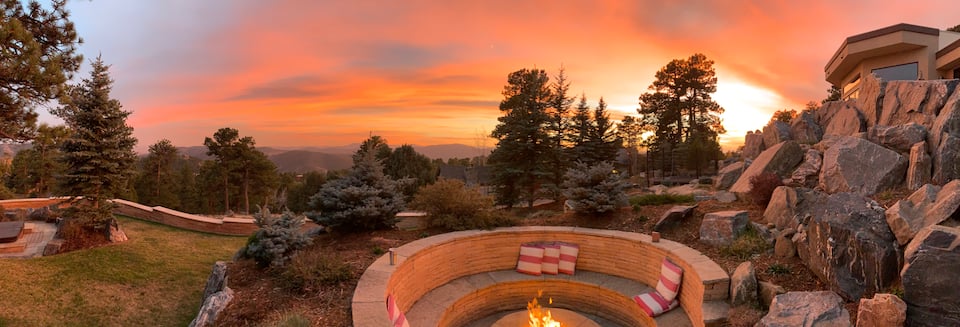


Top-earning Airbnb listings in Golden - Avg. revenue
- $52,700 +4% vs. last year
- Occupancy
- 53%
- Nightly rate
- $325
- Active listings
- 301
Where it places among the 83 ranked markets in Colorado
- Revenue 19th of 83
- Occupancy 4th of 83
- Market size 36th of 83
- Year-round 17th of 83
- Growth 49th of 83
- How it earns
- Golden earns on volume. Rates run below the Colorado average at about $325 a night, but listings book 53% of nights. Listings averaged $52,700 in revenue over the year, 18% above the Colorado average. In a typical month the median listing brings in about $4,550, and the best quarter clear $7,100.
- When it earns
- Revenue in Golden concentrates from May to September: July earns about $8,680 per listing, about 2.3 times as much as February.
- What sells
- The most common entire home has 1 bedroom (32% of entire homes), and houses make up 46% of supply.
- Who it suits
- Best for buyers who would rather price for occupancy than for rate.
Revenue per listing by month
$8,680 $3,730- Median listing
- $4,550/mo
- Top 25% of listings
- $7,100+/mo
- Booked ahead
- 61 days
- Average stay
- 6 nights
- Most common home size
- 1 bedroom
- Superhosts
- 75%
Areas in the full report: Downtown Golden · Colorado School of Mines Area · Lookout Mountain
Full Golden Airbnb report3. Arvada
Known for: High occupancy · Large market
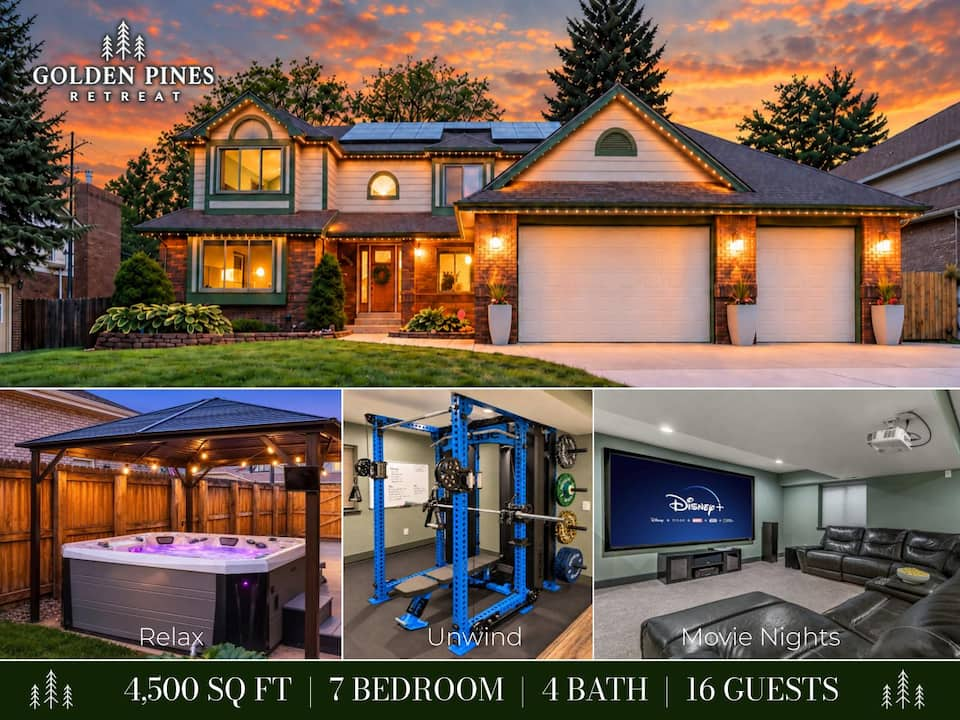

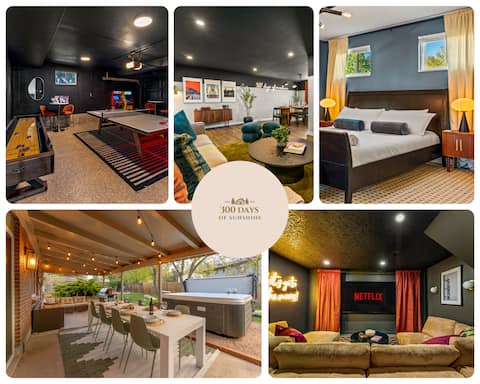
Top-earning Airbnb listings in Arvada - Avg. revenue
- $48,000 +12% vs. last year
- Occupancy
- 50%
- Nightly rate
- $305
- Active listings
- 621
Where it places among the 83 ranked markets in Colorado
- Revenue 28th of 83
- Occupancy 10th of 83
- Market size 17th of 83
- Year-round 34th of 83
- Growth 24th of 83
- How it earns
- Rates in Arvada sit below the Colorado average, at about $305 a night, but listings are booked on 50% of nights. Average revenue per listing came to $48,000, 8% above the Colorado average. Month to month, the median listing earns about $4,550 and a top-quarter listing $7,400 or more. Revenue per listing rose 12% over the year, helped by nightly rates 17% higher, even as the number of listings grew 15%.
- When it earns
- In Arvada, the months from May to September earn above the yearly average, led by July at about $8,210 per listing; February is the low point at about $3,050. Guests book later than in most of Colorado, about 40 days ahead against roughly 56 for the typical market in Colorado; stays average 6 nights.
- What sells
- Big homes set the market: 68% of entire homes have three or more bedrooms, against about 45% in the typical market in Colorado, and houses make up 82% of supply.
- Who it suits
- A good fit for buyers who would rather price for occupancy than for rate and can ride out a slow February.
Revenue per listing by month
$8,210 $3,050- Median listing
- $4,550/mo
- Top 25% of listings
- $7,400+/mo
- Booked ahead
- 40 days
- Average stay
- 6 nights
- Most common home size
- 5+ bedrooms
- Superhosts
- 75%
Areas in the full report: Old Town Arvada · West Woods · Arvada Ridge
Full Arvada Airbnb report4. Boulder
Known for: Large market · High earnings
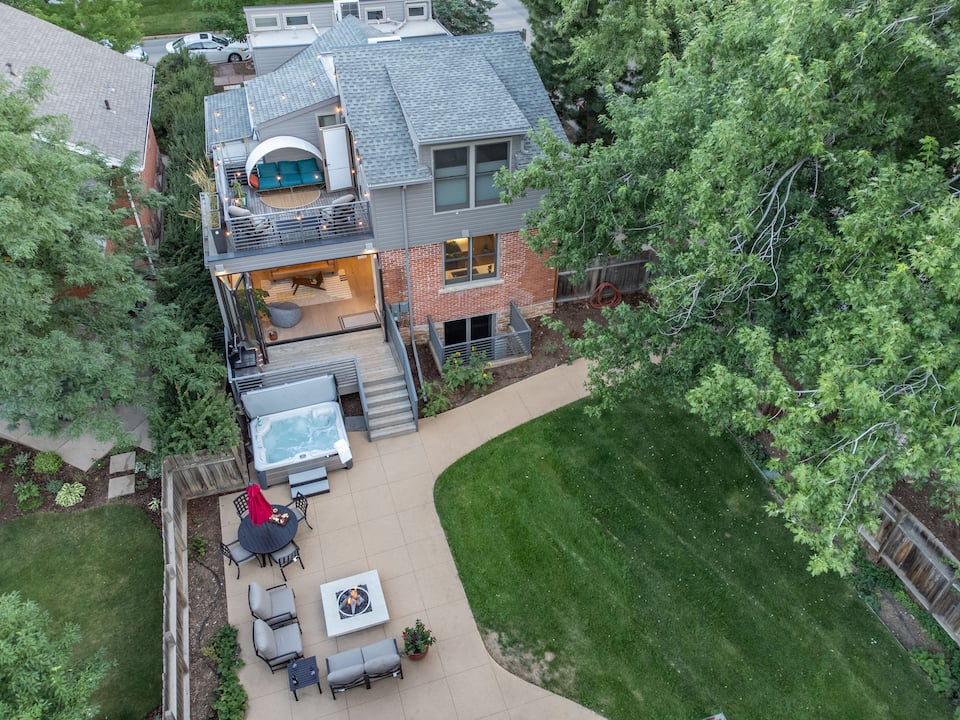

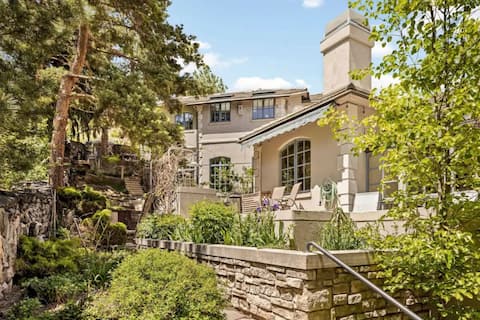
Top-earning Airbnb listings in Boulder - Avg. revenue
- $49,900 +7% vs. last year
- Occupancy
- 46%
- Nightly rate
- $420
- Active listings
- 893
Where it places among the 83 ranked markets in Colorado
- Revenue 24th of 83
- Occupancy 28th of 83
- Market size 10th of 83
- Year-round 25th of 83
- Growth 43rd of 83
- How it earns
- Listings in Boulder are booked on 46% of nights, 5 points above the Colorado average, at about $420 a night. That adds up to $49,900 per listing over the year, 12% above the Colorado average. The gap between listings is wide: a typical one takes in about $3,790 a month, while the top quarter clear $7,850 and the top 10% $13,800, so pricing and presentation count for more here than in most of Colorado. Revenue per listing rose 7% over the year, helped by nightly rates 13% higher.
- When it earns
- Boulder's season runs from May to October, peaking in July at about $8,510 per listing; February, the quietest month, brings in about $3,430. Trips run long, about 7 nights on average against 5 nights for the typical market in Colorado, booked about 61 days ahead.
- What sells
- Two-bedroom homes lead the market (27% of entire homes), and houses make up 60% of supply.
- The competition
- It is still largely owner-run: professional managers account for 7% of listings, and Superhosts make up 61% of hosts.
- Who it suits
- It suits buyers who are prepared for thin bookings around February and want to manage a property themselves.
Revenue per listing by month
$8,510 $3,430- Median listing
- $3,790/mo
- Top 25% of listings
- $7,850+/mo
- Booked ahead
- 61 days
- Average stay
- 7 nights
- Most common home size
- 2 bedrooms
- Superhosts
- 61%
Areas in the full report: Pearl Street Mall · Chautauqua Park · University Hill
Full Boulder Airbnb report5. Wheat Ridge
Known for: High occupancy · Growing revenue

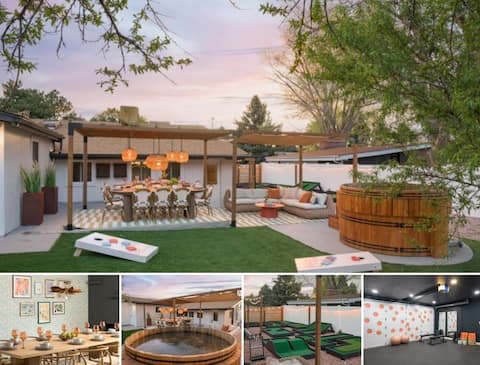

Top-earning Airbnb listings in Wheat Ridge - Avg. revenue
- $46,700 +17% vs. last year
- Occupancy
- 53%
- Nightly rate
- $260
- Active listings
- 230
Where it places among the 83 ranked markets in Colorado
- Revenue 30th of 83
- Occupancy 1st of 83
- Market size 43rd of 83
- Year-round 21st of 83
- Growth 14th of 83
- How it earns
- Wheat Ridge earns on volume. Rates run below the Colorado average at about $260 a night, but listings book 53% of nights. Revenue per listing, $46,700, is close to the Colorado average. A typical listing takes in about $3,610 a month; the top quarter clear $6,010 or more. Revenue per listing rose 17% over the year, helped by nightly rates 17% higher. With 230 listings it is a small market, so its averages can move more from year to year.
- When it earns
- Revenue in Wheat Ridge concentrates from May to September: July earns about $6,880 per listing, about 2.4 times as much as February.
- What sells
- The most common entire home has 2 bedrooms (27% of entire homes), and houses make up 73% of supply.
- Who it suits
- Best for buyers who would rather price for occupancy than for rate.
- Registration
- Nearly nine in ten listings display a registration number, so confirm the local rules before buying.
Revenue per listing by month
$6,880 $2,920- Median listing
- $3,610/mo
- Top 25% of listings
- $6,010+/mo
- Booked ahead
- 44 days
- Average stay
- 6 nights
- Most common home size
- 2 bedrooms
- Superhosts
- 77%
6. Centennial
Known for: High occupancy · Growing revenue
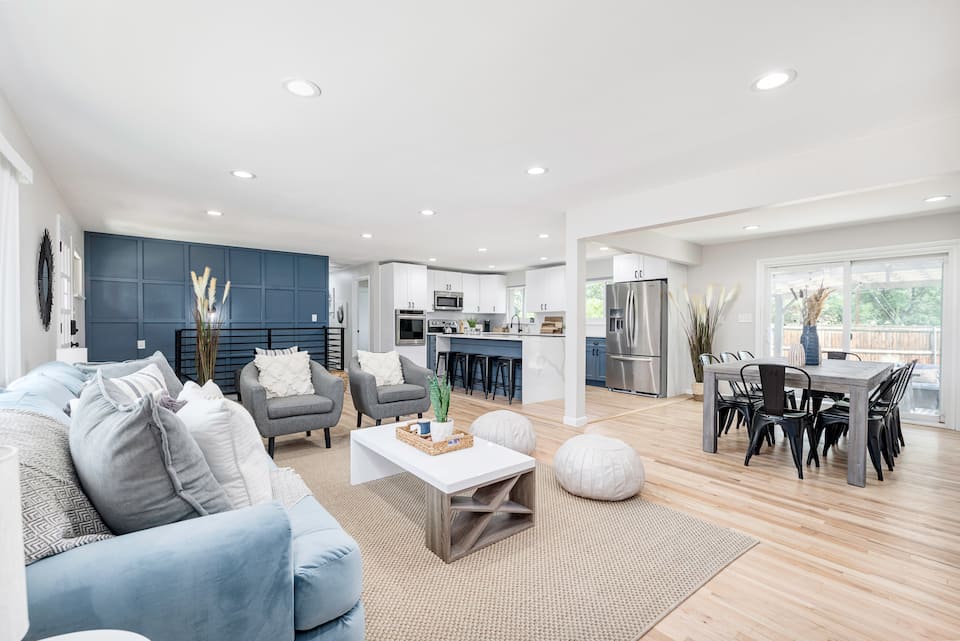


Top-earning Airbnb listings in Centennial - Avg. revenue
- $45,800 +20% vs. last year
- Occupancy
- 52%
- Nightly rate
- $270
- Active listings
- 203
Where it places among the 83 ranked markets in Colorado
- Revenue 33rd of 83
- Occupancy 6th of 83
- Market size 46th of 83
- Year-round 10th of 83
- Growth 9th of 83
- How it earns
- Rates in Centennial sit below the Colorado average, at about $270 a night, but listings are booked on 52% of nights. Revenue per listing, $45,800, is close to the Colorado average. In a typical month the median listing brings in about $4,160, and the best quarter clear $7,440. Revenue per listing rose 20% over the year, helped by nightly rates 25% higher. Its 203 listings make it one of the smaller ranked markets, so its figures are less settled than those of larger ones.
- When it earns
- In Centennial, the months from May to September earn above the yearly average, led by July at about $6,930 per listing; February is the low point at about $3,240. Bookings arrive closer to the date than in most of Colorado, about 39 days before check-in, and guests stay about 8 nights.
- What sells
- Big homes set the market: 62% of entire homes have three or more bedrooms, against about 45% in the typical market in Colorado, and houses make up 71% of supply.
- Who it suits
- A good fit for buyers who would rather price for occupancy than for rate and are comfortable adjusting prices close to the date.
Revenue per listing by month
$6,930 $3,240- Median listing
- $4,160/mo
- Top 25% of listings
- $7,440+/mo
- Booked ahead
- 39 days
- Average stay
- 8 nights
- Most common home size
- 4 bedrooms
- Superhosts
- 72%
7. Zuni
Known for: High occupancy · Growing revenue
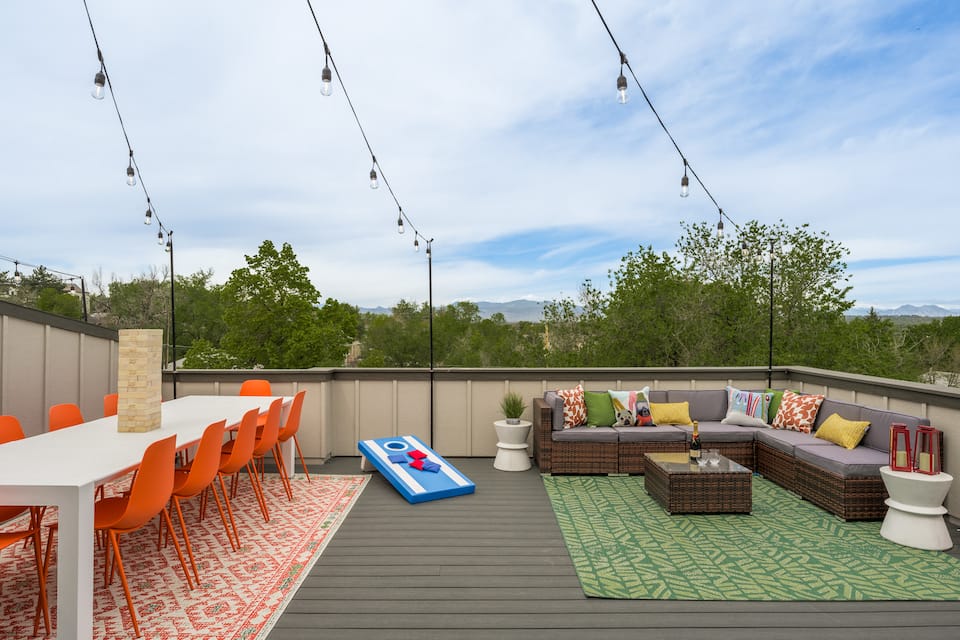
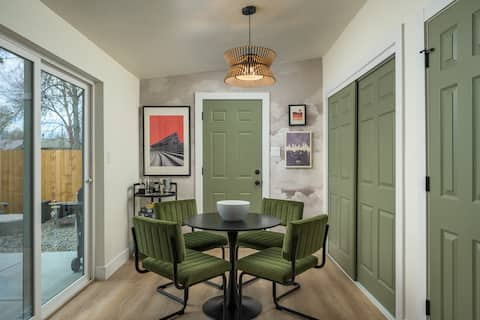

Top-earning Airbnb listings in Zuni - Avg. revenue
- $55,600 +19% vs. last year
- Occupancy
- 53%
- Nightly rate
- $320
- Active listings
- 101
Where it places among the 83 ranked markets in Colorado
- Revenue 16th of 83
- Occupancy 3rd of 83
- Market size 80th of 83
- Year-round 14th of 83
- Growth 10th of 83
- How it earns
- Zuni earns on volume. Rates run below the Colorado average at about $320 a night, but listings book 53% of nights. That adds up to $55,600 per listing over the year, 25% above the Colorado average. Month to month, the median listing earns about $4,440 and a top-quarter listing $7,550 or more. Revenue per listing rose 19% over the year, helped by nightly rates 14% higher. With 101 listings it is a small market, so its averages can move more from year to year.
- When it earns
- Zuni's season runs from May to September, peaking in July at about $8,490 per listing; February, the quietest month, brings in about $3,700. Guests book later than in most of Colorado, about 41 days ahead against roughly 56 for the typical market in Colorado; stays average 5 nights.
- What sells
- Big homes set the market: 61% of entire homes have three or more bedrooms, against about 45% in the typical market in Colorado, and houses make up 77% of supply.
- Who it suits
- It suits buyers who would rather price for occupancy than for rate and are comfortable adjusting prices close to the date.
Revenue per listing by month
$8,490 $3,700- Median listing
- $4,440/mo
- Top 25% of listings
- $7,550+/mo
- Booked ahead
- 41 days
- Average stay
- 5 nights
- Most common home size
- 2 bedrooms
- Superhosts
- 68%
8. Denver
Known for: Large market · Year-round demand
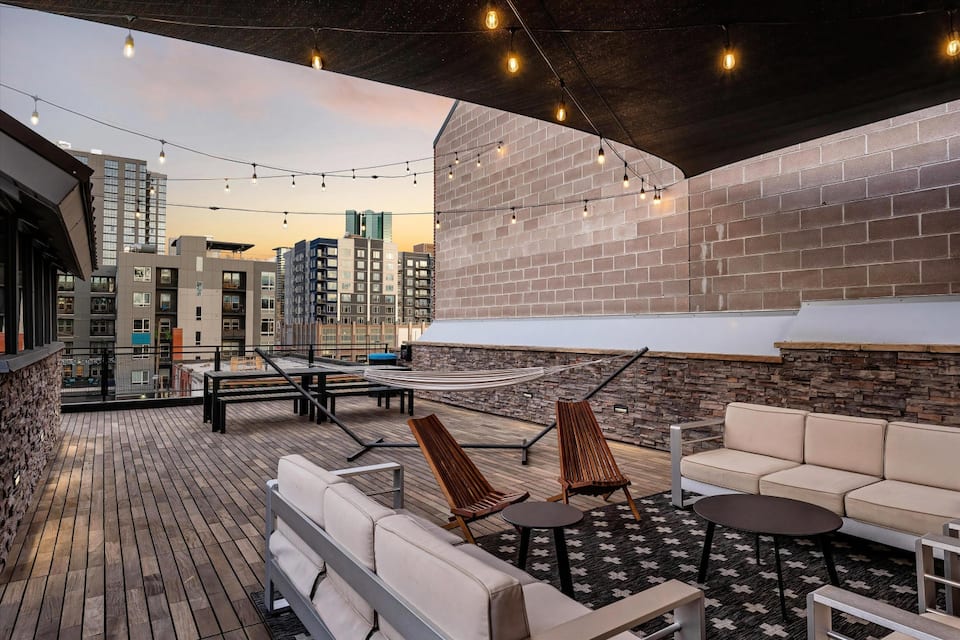
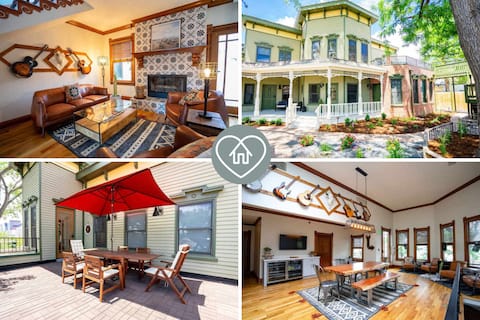
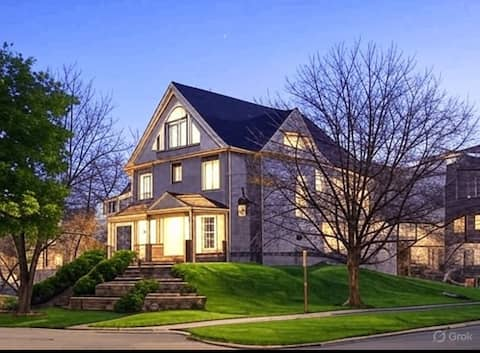
Top-earning Airbnb listings in Denver - Avg. revenue
- $32,300 +12% vs. last year
- Occupancy
- 50%
- Nightly rate
- $225
- Active listings
- 3,600
Where it places among the 83 ranked markets in Colorado
- Revenue 60th of 83
- Occupancy 11th of 83
- Market size 1st of 83
- Year-round 6th of 83
- Growth 22nd of 83
- How it earns
- Rates in Denver sit below the Colorado average, at about $225 a night, but listings are booked on 50% of nights. Moderate rates keep revenue per listing at $32,300, 28% below the Colorado average. Its place at #8 rests on market size (1st of 83) and year-round demand (6th of 83) rather than on revenue per listing. A typical listing takes in about $3,120 a month; the top quarter clear $5,070 or more. Revenue per listing rose 12% over the year, helped by nightly rates 13% higher.
- When it earns
- Revenue in Denver concentrates from May to September: July earns about $5,150 per listing, about twice as much as January. Bookings arrive closer to the date than in most of Colorado, about 41 days before check-in, and guests stay about 7 nights.
- What sells
- Smaller places set the market: only 28% of entire homes have three or more bedrooms, against about 45% in the typical market in Colorado.
- Who it suits
- Best for buyers who would rather price for occupancy than for rate and are comfortable adjusting prices close to the date.
- Registration
- Registration numbers appear on nearly three-quarters of listings; check with the local authority before buying.
Revenue per listing by month
$5,150 $2,640- Median listing
- $3,120/mo
- Top 25% of listings
- $5,070+/mo
- Booked ahead
- 41 days
- Average stay
- 7 nights
- Most common home size
- 1 bedroom
- Superhosts
- 67%
Areas in the full report: RiNo (River North Art District) · LoDo (Lower Downtown) · Capitol Hill
Full Denver Airbnb report9. Breckenridge
Known for: Large market · High earnings
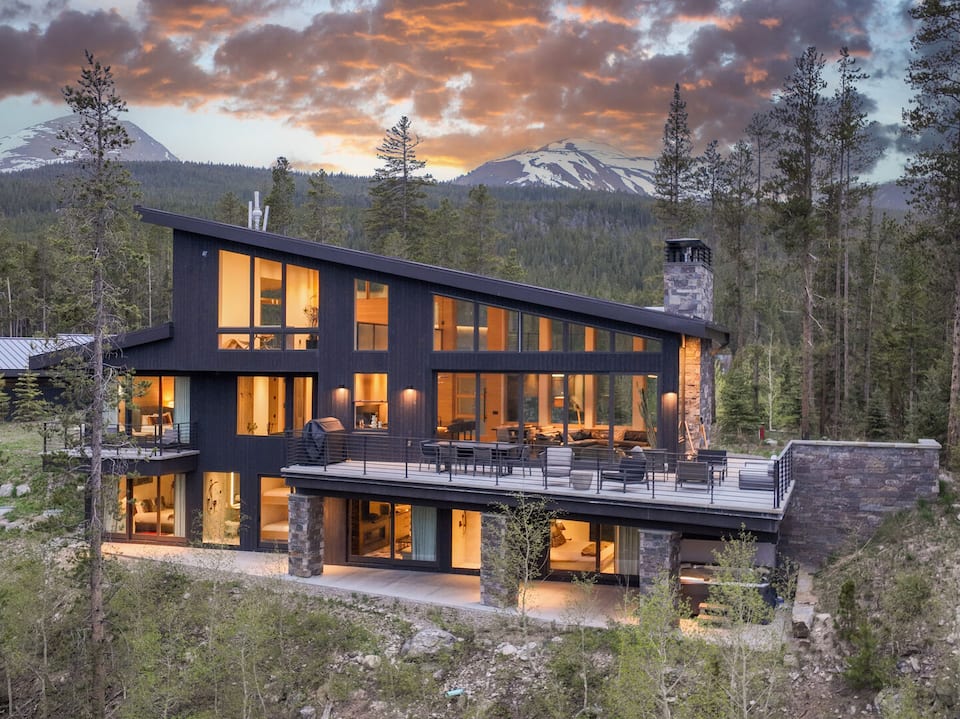
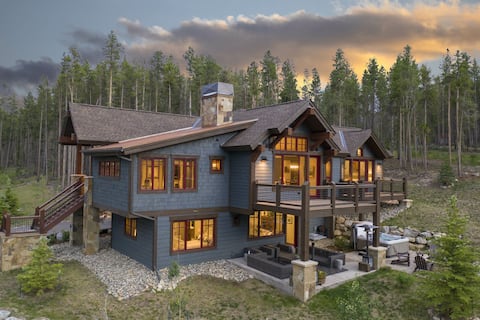
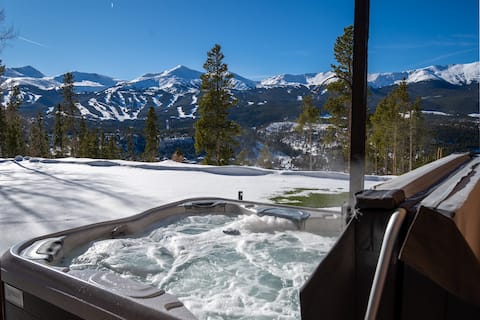
Top-earning Airbnb listings in Breckenridge - Avg. revenue
- $67,200 +9% vs. last year
- Occupancy
- 39%
- Nightly rate
- $590
- Active listings
- 3,120
Where it places among the 83 ranked markets in Colorado
- Revenue 5th of 83
- Occupancy 59th of 83
- Market size 2nd of 83
- Year-round 68th of 83
- Growth 33rd of 83
- How it earns
- Breckenridge earns on price: guests pay about $590 a night, 42% above the Colorado average. Average revenue per listing came to $67,200, the fifth-highest of the 83 ranked markets. In a typical month the median listing brings in about $5,130, and the best quarter clear $9,310. Revenue per listing rose 9% over the year, helped by nightly rates 11% higher.
- When it earns
- In Breckenridge, the months from December to March earn above the yearly average, led by February at about $13,200 per listing; October is the low point at about $3,220.
- The competition
- Professional managers run 44% of listings, against about 20% in the typical market in Colorado, and the largest operator runs 142 listings, so new hosts compete with polished operations.
- Guest expectations
- Average ratings (4.80 stars) trail the typical market in Colorado (4.87), which leaves room for a well-run listing to stand out.
- Who it suits
- A good fit for buyers who can carry costs through a quiet October and can furnish and price for a premium stay.
Revenue per listing by month
$13,200 $3,220- Median listing
- $5,130/mo
- Top 25% of listings
- $9,310+/mo
- Booked ahead
- 66 days
- Average stay
- 5 nights
- Most common home size
- 2 bedrooms
- Superhosts
- 60%
Areas in the full report: Peak 8 · Historic Main Street · Breck Ski Resort Base
Full Breckenridge Airbnb report10. Glenwood Springs
Known for: High earnings · High occupancy

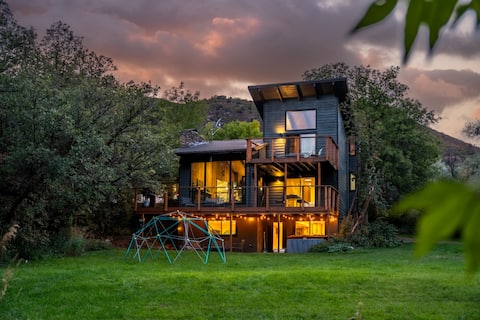

Top-earning Airbnb listings in Glenwood Springs - Avg. revenue
- $64,000 +1% vs. last year
- Occupancy
- 47%
- Nightly rate
- $385
- Active listings
- 265
Where it places among the 83 ranked markets in Colorado
- Revenue 8th of 83
- Occupancy 22nd of 83
- Market size 38th of 83
- Year-round 50th of 83
- Growth 63rd of 83
- How it earns
- Demand runs high in Glenwood Springs: 47% of nights booked, 6 points above the Colorado average, at about $385 a night. That adds up to $64,000 per listing over the year, the eighth-highest of the 83 ranked markets. Month to month, the median listing earns about $5,250 and a top-quarter listing $8,320 or more. Its 265 listings make it one of the smaller ranked markets, so its figures are less settled than those of larger ones.
- When it earns
- Glenwood Springs' season runs from June to September, peaking in July at about $10,600 per listing; April, the quietest month, brings in about $3,490. Visits are quick, about 3 nights on average against 5 nights for the typical market in Colorado, booked about 51 days ahead.
- What sells
- Two-bedroom homes lead the market (25% of entire homes), and houses make up 59% of supply.
- Who it suits
- It suits buyers who can ride out a slow April.
Revenue per listing by month
$10,600 $3,490- Median listing
- $5,250/mo
- Top 25% of listings
- $8,320+/mo
- Booked ahead
- 51 days
- Average stay
- 3 nights
- Most common home size
- 2 bedrooms
- Superhosts
- 73%
Full ranking
How All 83 Ranked Markets in Colorado Compare
The overall ranking with the five measures behind it. "Slow month" is a market's weakest month of revenue as a share of its best, so a higher figure means steadier income. Select a column heading to re-sort.
| Bailey Growing revenue, high occupancy | $65,540 | 53% | $377 | 40% | +30% | 157 | |
| Golden High occupancy, high earnings | $52,696 | 53% | $327 | 43% | +4% | 301 | |
| Arvada High occupancy, large market | $48,026 | 50% | $306 | 37% | +12% | 621 | |
| 4 | Boulder Large market, high earnings | $49,943 | 46% | $418 | 40% | +7% | 893 |
| 5 | Wheat Ridge High occupancy, growing revenue | $46,658 | 53% | $258 | 42% | +17% | 230 |
| 6 | Centennial High occupancy, growing revenue | $45,815 | 52% | $268 | 47% | +20% | 203 |
| 7 | Zuni High occupancy, growing revenue | $55,601 | 53% | $321 | 44% | +19% | 101 |
| 8 | Denver Large market, year-round demand | $32,333 | 50% | $224 | 51% | +12% | 3,599 |
| 9 | Breckenridge Large market, high earnings | $67,156 | 39% | $591 | 24% | +9% | 3,119 |
| 10 | Glenwood Springs High earnings, high occupancy | $64,032 | 47% | $386 | 33% | +1% | 265 |
| 11 | Black Hawk High earnings, high occupancy | $63,434 | 51% | $364 | 38% | 0% | 136 |
| 12 | Estes Park Large market, high earnings | $58,814 | 45% | $421 | 20% | +9% | 1,381 |
| 13 | Divide High occupancy, growing revenue | $52,531 | 51% | $306 | 35% | +15% | 115 |
| 14 | Aspen High earnings, large market | $92,818 | 36% | $1,079 | 32% | −2% | 654 |
| 15 | Westminster High occupancy, growing revenue | $40,565 | 48% | $259 | 39% | +14% | 328 |
| 16 | Colorado Springs Large market, high occupancy | $34,997 | 48% | $244 | 37% | +12% | 2,303 |
| 17 | Snowmass Village High earnings, large market | $68,874 | 36% | $800 | 20% | +11% | 637 |
| 18 | Cascade-Chipita Park High occupancy, high earnings | $59,668 | 50% | $349 | 29% | +14% | 110 |
| 19 | Ouray High earnings, growing revenue | $60,721 | 46% | $415 | 21% | +15% | 184 |
| 20 | Florissant Growing revenue, high earnings | $48,445 | 45% | $317 | 36% | +22% | 180 |
| 21 | Lakewood Growing revenue, high occupancy | $29,151 | 50% | $191 | 44% | +25% | 380 |
| 22 | Fort Collins High occupancy, large market | $39,832 | 48% | $282 | 32% | +9% | 549 |
| 23 | Loveland High occupancy, growing revenue | $36,131 | 51% | $228 | 38% | +11% | 319 |
| 24 | Blue River High earnings | $88,354 | 43% | $657 | 32% | −2% | 189 |
| 25 | Carbondale High earnings, high occupancy | $54,610 | 46% | $414 | 37% | −1% | 144 |
| 26 | Evergreen High earnings | $52,262 | 45% | $358 | 37% | +3% | 182 |
| 27 | Fairplay High earnings, large market | $49,711 | 42% | $359 | 35% | +5% | 373 |
| 28 | Telluride High earnings, large market | $65,164 | 36% | $728 | 27% | −1% | 628 |
| 29 | Idaho Springs High earnings, high occupancy | $50,011 | 46% | $318 | 37% | −3% | 180 |
| 30 | Cripple Creek Growing revenue, high occupancy | $46,448 | 46% | $290 | 39% | +30% | 101 |
| 31 | Mountain Village High earnings, large market | $89,038 | 31% | $1,233 | 28% | +2% | 343 |
| 32 | Grand Lake High earnings, large market | $51,782 | 41% | $390 | 22% | +8% | 461 |
| 33 | Silverthorne Large market, high earnings | $46,723 | 39% | $427 | 33% | +1% | 701 |
| 34 | Crested Butte High earnings, large market | $61,910 | 41% | $572 | 22% | −4% | 399 |
| 35 | Vail Large market, high earnings | $58,606 | 32% | $842 | 23% | +1% | 1,553 |
| 36 | Longmont Growing revenue, high occupancy | $28,915 | 48% | $205 | 43% | +17% | 231 |
| 37 | Steamboat Springs Large market, high earnings | $48,608 | 32% | $599 | 24% | +7% | 2,267 |
| 38 | Buena Vista Large market | $42,889 | 44% | $316 | 28% | +8% | 391 |
| 39 | Western Hills Growing revenue, high occupancy | $37,688 | 48% | $251 | 41% | +25% | 102 |
| 40 | Lafayette High occupancy, growing revenue | $28,886 | 53% | $184 | 52% | +26% | 103 |
| 41 | Grand Junction High occupancy, large market | $27,991 | 46% | $195 | 46% | +6% | 455 |
| 42 | Frisco Large market, high earnings | $46,526 | 37% | $455 | 23% | +5% | 880 |
| 43 | Woodland Park High occupancy | $40,023 | 46% | $304 | 34% | +3% | 242 |
| 44 | Littleton High occupancy, growing revenue | $33,459 | 47% | $232 | 43% | +9% | 193 |
| 45 | Durango Large market | $39,371 | 37% | $392 | 35% | +4% | 1,085 |
| 46 | Castle Rock High occupancy, growing revenue | $34,761 | 50% | $254 | 43% | +15% | 101 |
| 47 | Alma High earnings | $53,715 | 43% | $387 | 35% | −8% | 117 |
| 48 | Salida Large market | $41,922 | 41% | $311 | 34% | +2% | 359 |
| 49 | Montrose Growing revenue, high occupancy | $27,959 | 47% | $217 | 36% | +16% | 239 |
| 50 | Beaver Creek High earnings, large market | $59,371 | 29% | $964 | 19% | −1% | 539 |
| 51 | Monument Growing revenue | $44,430 | 43% | $382 | 33% | +12% | 113 |
| 52 | Ridgway High occupancy | $44,087 | 47% | $350 | 26% | +8% | 111 |
| 53 | Pagosa Springs Large market, growing revenue | $31,199 | 35% | $303 | 38% | +10% | 847 |
| 54 | Aurora Year-round demand, large market | $19,182 | 43% | $163 | 51% | +9% | 566 |
| 55 | Leadville | $37,332 | 43% | $269 | 32% | +2% | 291 |
| 56 | Greenwood Village Year-round demand, high occupancy | $20,451 | 49% | $146 | 55% | +10% | 124 |
| 57 | Granby Large market, growing revenue | $36,587 | 35% | $349 | 31% | +9% | 569 |
| 58 | Mount Crested Butte Large market | $42,586 | 36% | $422 | 24% | 0% | 546 |
| 59 | Winter Park Large market | $41,233 | 33% | $439 | 26% | −4% | 1,184 |
| 60 | Thornton Growing revenue | $27,588 | 45% | $205 | 41% | +18% | 129 |
| 61 | Pueblo Year-round demand, growing revenue | $15,883 | 42% | $161 | 62% | +18% | 206 |
| 62 | Keystone Large market | $39,725 | 35% | $411 | 23% | −1% | 1,441 |
| 63 | Commerce City Growing revenue | $26,453 | 43% | $204 | 48% | +9% | 159 |
| 64 | Greeley Growing revenue | $23,675 | 41% | $206 | 48% | +54% | 150 |
| 65 | Edwards | $43,682 | 33% | $663 | 26% | +8% | 205 |
| 66 | Manitou Springs | $39,865 | 45% | $278 | 29% | +2% | 115 |
| 67 | Fraser Large market | $37,570 | 33% | $406 | 35% | −2% | 581 |
| 68 | Fruita | $26,128 | 43% | $216 | 44% | +8% | 154 |
| 69 | Englewood Year-round demand, high occupancy | $20,980 | 47% | $159 | 54% | −5% | 142 |
| 70 | Dillon Large market | $34,563 | 37% | $349 | 28% | +2% | 519 |
| 71 | Avon Large market | $39,527 | 33% | $531 | 24% | −4% | 588 |
| 72 | Gunnison | $35,069 | 44% | $269 | 35% | +3% | 103 |
| 73 | Palisade | $31,544 | 41% | $274 | 45% | −3% | 118 |
| 74 | Copper Mountain | $44,982 | 32% | $566 | 15% | −2% | 194 |
| 75 | Cortez Year-round demand | $20,970 | 42% | $164 | 54% | +8% | 109 |
| 76 | South Fork Growing revenue | $27,841 | 32% | $315 | 30% | +24% | 235 |
| 77 | Crestone | $25,323 | 40% | $185 | 42% | +2% | 141 |
| 78 | Lake City | $29,862 | 45% | $318 | 23% | +2% | 127 |
| 79 | Cañon City | $23,370 | 38% | $217 | 39% | 0% | 171 |
| 80 | Bayfield | $22,025 | 35% | $273 | 36% | +4% | 191 |
| 81 | Paonia | $15,388 | 39% | $152 | 47% | +2% | 106 |
| 82 | Dolores | $23,064 | 40% | $226 | 39% | −11% | 107 |
| 83 | Silverton | $34,174 | 38% | $306 | 22% | −17% | 101 |
By measure
Colorado Airbnb Markets Ranked by Revenue, Nightly Rate and Occupancy
The overall ranking balances five measures. These lists take one at a time, for buyers who care most about income, pricing power, bookings, a steady calendar, momentum or market size.
Highest-earning Airbnb markets in Colorado
Average annual revenue per active listing over the past 12 months. Markets with at least 200 listings.
| # | Market | Revenue |
|---|---|---|
| Aspen #14 overall | $92,800 | |
| Mountain Village #31 overall | $89,000 | |
| Snowmass Village #17 overall | $68,900 | |
| 4 | Breckenridge #9 overall | $67,200 |
| 5 | Telluride #28 overall | $65,200 |
| 6 | Glenwood Springs #10 overall | $64,000 |
| 7 | Crested Butte #34 overall | $61,900 |
| 8 | Beaver Creek #50 overall | $59,400 |
| 9 | Estes Park #12 overall | $58,800 |
| 10 | Vail #35 overall | $58,600 |
| 11 | Golden #2 overall | $52,700 |
| 12 | Grand Lake #32 overall | $51,800 |
| 13 | Boulder #4 overall | $49,900 |
| 14 | Fairplay #27 overall | $49,700 |
| 15 | Steamboat Springs #37 overall | $48,600 |
| 16 | Arvada #3 overall | $48,000 |
| 17 | Silverthorne #33 overall | $46,700 |
| 18 | Wheat Ridge #5 overall | $46,700 |
| 19 | Frisco #42 overall | $46,500 |
| 20 | Centennial #6 overall | $45,800 |
| 21 | Edwards #65 overall | $43,700 |
| 22 | Buena Vista #38 overall | $42,900 |
| 23 | Mount Crested Butte #58 overall | $42,600 |
| 24 | Salida #48 overall | $41,900 |
| 25 | Winter Park #59 overall | $41,200 |
Most expensive Airbnb markets in Colorado by nightly rate
Average rate per booked night. A high rate earns most where occupancy holds up too. Markets with at least 200 listings.
| # | Market | Nightly |
|---|---|---|
| Mountain Village #31 overall | $1,235 | |
| Aspen #14 overall | $1,080 | |
| Beaver Creek #50 overall | $965 | |
| 4 | Vail #35 overall | $840 |
| 5 | Snowmass Village #17 overall | $800 |
| 6 | Telluride #28 overall | $730 |
| 7 | Edwards #65 overall | $665 |
| 8 | Steamboat Springs #37 overall | $600 |
| 9 | Breckenridge #9 overall | $590 |
| 10 | Crested Butte #34 overall | $570 |
| 11 | Avon #71 overall | $530 |
| 12 | Frisco #42 overall | $455 |
| 13 | Winter Park #59 overall | $440 |
| 14 | Silverthorne #33 overall | $425 |
| 15 | Mount Crested Butte #58 overall | $420 |
| 16 | Estes Park #12 overall | $420 |
| 17 | Boulder #4 overall | $420 |
| 18 | Keystone #62 overall | $410 |
| 19 | Fraser #67 overall | $405 |
| 20 | Durango #45 overall | $390 |
| 21 | Grand Lake #32 overall | $390 |
| 22 | Glenwood Springs #10 overall | $385 |
| 23 | Fairplay #27 overall | $360 |
| 24 | Dillon #70 overall | $350 |
| 25 | Granby #57 overall | $350 |
Highest-occupancy Airbnb markets in Colorado
Share of available nights booked over the past 12 months. Markets with at least 200 listings.
| # | Market | Occupancy |
|---|---|---|
| Wheat Ridge #5 overall | 53% | |
| Golden #2 overall | 53% | |
| Centennial #6 overall | 52% | |
| 4 | Loveland #23 overall | 51% |
| 5 | Arvada #3 overall | 50% |
| 6 | Denver #8 overall | 50% |
| 7 | Lakewood #21 overall | 50% |
| 8 | Westminster #15 overall | 48% |
| 9 | Fort Collins #22 overall | 48% |
| 10 | Colorado Springs #16 overall | 48% |
| 11 | Longmont #36 overall | 48% |
| 12 | Glenwood Springs #10 overall | 47% |
| 13 | Montrose #49 overall | 47% |
| 14 | Grand Junction #41 overall | 46% |
| 15 | Boulder #4 overall | 46% |
| 16 | Woodland Park #43 overall | 46% |
| 17 | Estes Park #12 overall | 45% |
| 18 | Buena Vista #38 overall | 44% |
| 19 | Leadville #55 overall | 43% |
| 20 | Aurora #54 overall | 43% |
| 21 | Fairplay #27 overall | 42% |
| 22 | Pueblo #61 overall | 42% |
| 23 | Grand Lake #32 overall | 41% |
| 24 | Salida #48 overall | 41% |
| 25 | Crested Butte #34 overall | 41% |
Most year-round Airbnb markets in Colorado
Revenue in the slowest month as a share of the best month, so a higher figure means steadier income. Markets with at least 200 listings.
| # | Market | Slow month |
|---|---|---|
| Pueblo #61 overall | 62% | |
| Denver #8 overall | 51% | |
| Aurora #54 overall | 51% | |
| 4 | Centennial #6 overall | 47% |
| 5 | Grand Junction #41 overall | 46% |
| 6 | Lakewood #21 overall | 44% |
| 7 | Golden #2 overall | 43% |
| 8 | Longmont #36 overall | 43% |
| 9 | Wheat Ridge #5 overall | 42% |
| 10 | Boulder #4 overall | 40% |
| 11 | Westminster #15 overall | 39% |
| 12 | Pagosa Springs #53 overall | 38% |
| 13 | Loveland #23 overall | 38% |
| 14 | Colorado Springs #16 overall | 37% |
| 15 | Arvada #3 overall | 37% |
| 16 | Montrose #49 overall | 36% |
| 17 | Durango #45 overall | 35% |
| 18 | Fraser #67 overall | 35% |
| 19 | Fairplay #27 overall | 35% |
| 20 | Salida #48 overall | 34% |
| 21 | Woodland Park #43 overall | 34% |
| 22 | Silverthorne #33 overall | 33% |
| 23 | Glenwood Springs #10 overall | 33% |
| 24 | Aspen #14 overall | 32% |
| 25 | Fort Collins #22 overall | 32% |
Fastest-growing Airbnb markets in Colorado
Change in revenue per listing from the year before, among markets where it rose. Markets with at least 200 listings.
| # | Market | Change |
|---|---|---|
| Lakewood #21 overall | +25% | |
| South Fork #76 overall | +24% | |
| Centennial #6 overall | +20% | |
| 4 | Pueblo #61 overall | +18% |
| 5 | Longmont #36 overall | +17% |
| 6 | Wheat Ridge #5 overall | +17% |
| 7 | Montrose #49 overall | +16% |
| 8 | Westminster #15 overall | +14% |
| 9 | Colorado Springs #16 overall | +12% |
| 10 | Denver #8 overall | +12% |
| 11 | Arvada #3 overall | +12% |
| 12 | Loveland #23 overall | +11% |
| 13 | Snowmass Village #17 overall | +11% |
| 14 | Pagosa Springs #53 overall | +10% |
| 15 | Granby #57 overall | +9% |
| 16 | Fort Collins #22 overall | +9% |
| 17 | Breckenridge #9 overall | +9% |
| 18 | Estes Park #12 overall | +9% |
| 19 | Aurora #54 overall | +9% |
| 20 | Edwards #65 overall | +8% |
| 21 | Grand Lake #32 overall | +8% |
| 22 | Buena Vista #38 overall | +8% |
| 23 | Steamboat Springs #37 overall | +7% |
| 24 | Boulder #4 overall | +7% |
| 25 | Grand Junction #41 overall | +6% |
Largest Airbnb markets in Colorado
Active listings. Bigger markets have more comparable rentals to price against and more buyers at resale.
| # | Market | Listings |
|---|---|---|
| Denver #8 overall | 3,600 | |
| Breckenridge #9 overall | 3,120 | |
| Colorado Springs #16 overall | 2,300 | |
| 4 | Steamboat Springs #37 overall | 2,270 |
| 5 | Vail #35 overall | 1,550 |
| 6 | Keystone #62 overall | 1,440 |
| 7 | Estes Park #12 overall | 1,380 |
| 8 | Winter Park #59 overall | 1,180 |
| 9 | Durango #45 overall | 1,090 |
| 10 | Boulder #4 overall | 893 |
| 11 | Frisco #42 overall | 880 |
| 12 | Pagosa Springs #53 overall | 847 |
| 13 | Silverthorne #33 overall | 701 |
| 14 | Aspen #14 overall | 654 |
| 15 | Snowmass Village #17 overall | 637 |
| 16 | Telluride #28 overall | 628 |
| 17 | Arvada #3 overall | 621 |
| 18 | Avon #71 overall | 588 |
| 19 | Fraser #67 overall | 581 |
| 20 | Granby #57 overall | 569 |
| 21 | Aurora #54 overall | 566 |
| 22 | Fort Collins #22 overall | 549 |
| 23 | Mount Crested Butte #58 overall | 546 |
| 24 | Beaver Creek #50 overall | 539 |
| 25 | Dillon #70 overall | 519 |
Seasonality
When Airbnbs in Colorado Earn the Most
July is the best month for about seven in ten ranked markets in Colorado. February is the most common slowest month, in 31 markets.
July earns about 2.2 times what April does
Average revenue per listing across the 83 ranked markets in Colorado, by month
| Month | Avg. revenue per listing | Best month for | Highest-ranked examples |
|---|---|---|---|
| January | $6,060 | – | – |
| February | $6,800 | 11 markets | Breckenridge, Aspen, Snowmass Village |
| March | $7,060 | 7 markets | Silverthorne, Frisco, Mount Crested Butte |
| April | $3,220 | – | – |
| May | $3,710 | 1 market | Fruita |
| June | $5,480 | 2 markets | Grand Junction, Cortez |
| July | $7,200 | 58 markets | Bailey, Golden, Arvada |
| August | $5,550 | 1 market | Crestone |
| September | $4,590 | 1 market | Palisade |
| October | $3,560 | – | – |
| November | $3,290 | – | – |
| December | $6,000 | 2 markets | Blue River, Alma |
Average revenue is per listing across the ranked markets, the line in the chart above. "Best month for" counts the ranked markets whose own revenue peaks in that month.
Named regions
Regions in Colorado
These pages compare the towns of a region that people search by name, with figures for the region as a whole.
- Summit County 7 towns
- Crested Butte 2 towns
Management
Who Manages Airbnbs in Colorado?
AirROI ranks the 50 largest of the 309 companies that run 5 or more Airbnb listings in Colorado, by listings, guest rating and growth; companies run 38% of its listings.
Method
How the Ranking Works
The ranking covers the 83 markets in Colorado with at least 100 active Airbnb listings and data through October 2026. Each market is compared with the others on five measures, and markets are ordered by a weighted blend of where they place on each:
- Revenue per listing (35%): average revenue an active listing earned over the past 12 months.
- Occupancy (20%): share of available nights that were booked.
- Market size (20%): active listings. Bigger markets offer more comparable rentals to price against and more buyers when you sell.
- Year-round demand (15%): revenue in the slowest month as a share of the best month. The latest month is left out when its bookings look incomplete.
- Growth (10%): change in revenue per listing from the year before. Markets whose boundaries changed between years are scored in the middle.
Left out: 20 markets whose data predate the latest refresh. The score measures how rentals perform. It does not include purchase prices, financing, operating costs or local short-term rental rules, which vary by address and should be checked before buying. Figures are in US dollars and match each market's own report; see the data methodology for how listings are tracked.
To check one property before buying, run its address and size through the Airbnb profit calculator for a revenue, occupancy and nightly-rate range from comparable listings.
FAQ
Frequently Asked Questions About Airbnb Investing in Colorado
What is the best place to buy an Airbnb in Colorado?
Bailey ranks first of the 83 markets in Colorado in AirROI's ranking, with $65,500 in average revenue per listing and 53% occupancy. Golden and Arvada follow. The ranking weighs revenue, occupancy, market size, seasonality and growth; it leaves out purchase prices.
What are the most profitable Airbnb locations in Colorado?
By revenue per listing, among markets with at least 200 listings, Aspen leads at $92,800 a year, ahead of Mountain Village at $89,000. Profit also depends on what a property costs to buy and run, which varies far more between markets than revenue does.
How much does an Airbnb make in Colorado?
The average active listing in Colorado earned $44,600 over the 12 months to October 2026, at 41% occupancy. Across the ranked markets, the middle half averaged between $29,900 and $51,800 per listing. Averages include listings that operated for only part of the year, so a listing rented all year typically earns more.
What is a good Airbnb occupancy rate in Colorado?
The average listing in Colorado was booked on 41% of available nights over the past 12 months. Half of the ranked markets fall between 37% and 47%, so a market above about 47% sits in the top quarter. Occupancy is only half the picture: a market with lower occupancy can still earn more if its nightly rates are higher.
Where is Airbnb demand highest in Colorado?
Among ranked markets with at least 200 listings, Wheat Ridge has the highest occupancy, with 53% of available nights booked, followed by Golden at 53%. Its listings average about $260 a night and $46,700 a year.
Where are Airbnb nightly rates highest in Colorado?
Among ranked markets with at least 200 listings, Mountain Village has the highest average nightly rate, about $1,235, followed by Aspen at $1,080. Pueblo is the least expensive, at about $160. The average booked night in Colorado costs about $415.
What is the best month for Airbnb in Colorado?
July is the highest-earning month for 58 of the 83 ranked markets, followed by February (11). February is the most common slowest month, in 31 of the 83 markets. Each market's report shows its own month-by-month revenue, occupancy and rates.
Which Airbnb markets in Colorado earn the most evenly through the year?
Among ranked markets with at least 200 listings, Pueblo has the steadiest income: its slowest month, November, still earns about 62% of its best. Denver follows, at 51%. Steadier markets are easier to budget for, though they do not always earn the most per listing.
Which Airbnb markets are growing fastest in Colorado?
Among ranked markets with at least 200 listings, revenue per listing grew most in Lakewood, up 25% on the year before, and in South Fork, up 24%. A single strong year can reflect events or new supply, so it is worth checking a market's monthly trend before relying on it.
Is Airbnb still profitable in Colorado in 2026?
Revenue per listing grew in 64 of the 83 ranked markets with a comparable year of data; in the typical market it rose 7%. Whether a given property profits depends on its purchase price, financing and running costs.
What are the best smaller Airbnb markets in Colorado?
Among ranked markets with fewer than 200 active listings, Bailey (#1 overall, $65,500 per listing), Zuni (#7, $55,600) and Black Hawk (#11, $63,400) place highest. Smaller markets have fewer comparable rentals to price against, so their averages can move more from year to year.
How many Airbnb listings are there in Colorado?
AirROI tracked 43,800 active Airbnb listings in Colorado over the 12 months to October 2026, across 183 markets. The largest ranked market is Denver, with 3,600 listings, followed by Breckenridge with 3,120.
Do Airbnb hosts need a permit in Colorado?
Rules can come from the state as well as the city or county, and they change often, so check both for any address you consider. In the listing data, most listings display a registration number in 3 of the 83 ranked markets, including Wheat Ridge, Denver and Aurora, though that shows what hosts display, not what the rules allow.
Directory
All 183 Airbnb Markets in Colorado
Every Colorado city with an AirROI Airbnb market report, A–Z, with its active listing count.
A
B
- Bailey 157 listings
- Basalt 87 listings
- Bayfield 191 listings
- Beaver Creek 539 listings
- Bellvue 38 listings
- Berthoud 29 listings
- Black Hawk 136 listings
- Blanca 22 listings
- Blue River 189 listings
- Boulder 893 listings
- Breckenridge 3,119 listings
- Brighton 82 listings
- Broomfield 51 listings
- Buena Vista 391 listings
C
- Cañon City 171 listings
- Carbondale 144 listings
- Cascade-Chipita Park 110 listings
- Castle Rock 101 listings
- Cedaredge 62 listings
- Centennial 203 listings
- Cimarron 28 listings
- Clark 18 listings
- Clear Creek County 19 listings
- Clifton 27 listings
- Collbran 21 listings
- Colorado Springs 2,303 listings
- Commerce City 159 listings
- Conifer 34 listings
- Copper Mountain 194 listings
- Cortez 109 listings
- Cotopaxi 34 listings
- Craig 25 listings
- Crawford 42 listings
- Creede 80 listings
- Crested Butte 399 listings
- Crested Butte South 33 listings
- Crestone 141 listings
- Cripple Creek 101 listings
D
E
F
- Fairplay 373 listings
- Florence 21 listings
- Florissant 180 listings
- Fort Collins 549 listings
- Fort Morgan 19 listings
- Fountain 43 listings
- Fraser 581 listings
- Frederick 19 listings
- Frisco 880 listings
- Fruita 154 listings
G
- Georgetown 62 listings
- Gleneagle 23 listings
- Glenwood Springs 265 listings
- Golden 301 listings
- Granby 569 listings
- Grand Junction 455 listings
- Grand Lake 461 listings
- Greeley 150 listings
- Green Mountain Falls 78 listings
- Greenwood Village 124 listings
- Gunbarrel 28 listings
- Gunnison 103 listings
- Gypsum 29 listings
H
- Hartsel 25 listings
- Hayden 24 listings
- Hesperus 28 listings
- Highlands Ranch 18 listings
- Holly Hills 28 listings
- Hotchkiss 33 listings
- Howard 27 listings
I
- Idaho Springs 180 listings
L
- La Junta 33 listings
- La Plata County 30 listings
- La Veta 77 listings
- Lafayette 103 listings
- Lake City 127 listings
- Lake George 70 listings
- Lakewood 380 listings
- Larkspur 29 listings
- Leadville 291 listings
- Littleton 193 listings
- Lone Tree 22 listings
- Longmont 231 listings
- Louisville 47 listings
- Loveland 319 listings
- Lyons 80 listings
M
- Mancos 91 listings
- Manitou Springs 115 listings
- Marble 36 listings
- Meeker 57 listings
- Meredith 17 listings
- Mesa 31 listings
- Minturn 35 listings
- Monte Vista 22 listings
- Montrose 239 listings
- Monument 113 listings
- Morrison 56 listings
- Mosca 31 listings
- Mount Crested Butte 546 listings
- Mountain Village 343 listings
N
- Nathrop 70 listings
- Nederland 86 listings
- New Castle 40 listings
- Niwot 18 listings
- Northglenn 83 listings
- Norwood 18 listings
P
- Pagosa Springs 847 listings
- Palisade 118 listings
- Palmer Lake 56 listings
- Paonia 106 listings
- Parker 91 listings
- Penrose 24 listings
- Peyton 28 listings
- Pine 24 listings
- Placerville 22 listings
- Poncha Springs 45 listings
- Pueblo 206 listings
- Pueblo West 37 listings
R
S
- Salida 359 listings
- Silt 30 listings
- Silver Plume 21 listings
- Silverthorne 701 listings
- Silverton 101 listings
- Snowmass 18 listings
- Snowmass Village 637 listings
- South Fork 235 listings
- Steamboat Springs 2,267 listings
- Sterling 30 listings
- Superior 42 listings
T
- Tabernash 91 listings
- Telluride 628 listings
- Thornton 129 listings
- Trinidad 72 listings
- Twin Lakes 59 listings
W
- Walden 37 listings
- Walsenburg 25 listings
- West Pleasant View 23 listings
- Westcliffe 85 listings
- Western Hills 102 listings
- Westminster 328 listings
- Weston 17 listings
- Wheat Ridge 230 listings
- Windsor 70 listings
- Winter Park 1,184 listings
- Woodland Park 242 listings
- Woodmoor 35 listings
Z
- Zuni 101 listings