
Market Saturation
Key Takeaways
- Saturation sets in when active-listing growth outpaces booking volume — the clearest early signal is an occupancy rate in sustained decline
- AirROI data shows occupancy ranging from 42% in Las Vegas to 53% in San Diego across major US STR markets — a spread that separates oversupplied from healthy
- A falling absorption rate for new listings is the leading indicator that saturation is approaching, not trailing
- Saturation is market-wide and average-driven — individual listings with strong positioning routinely outperform their saturated surroundings
- The correction mechanism is natural attrition: underperforming hosts exit, supply contracts, and RevPAR stabilizes
How to Identify Market Saturation
Saturation reveals itself through a cluster of concurrent signals, not any single data point:
| Indicator | Healthy Market | Approaching Saturation | Saturated |
|---|---|---|---|
| Occupancy rate trend | Stable or rising | Gradual decline | Below 45% and falling |
| ADR trend | Stable or rising | Flat despite inflation | Declining year-over-year |
| New-listing growth | Moderate (5–10% yr) | Rapid (15–25% yr) | Far outpacing demand |
| Absorption rate | Above 70% | 50–70% | Below 50% |
| RevPAR trend | Rising | Flat | Declining |
The absorption rate — the share of new listings that achieve meaningful booking volume within 60–90 days — is the most forward-looking indicator. When it drops below 50%, the market is already digesting more supply than demand can support.
STR Occupancy Rates Across US Markets
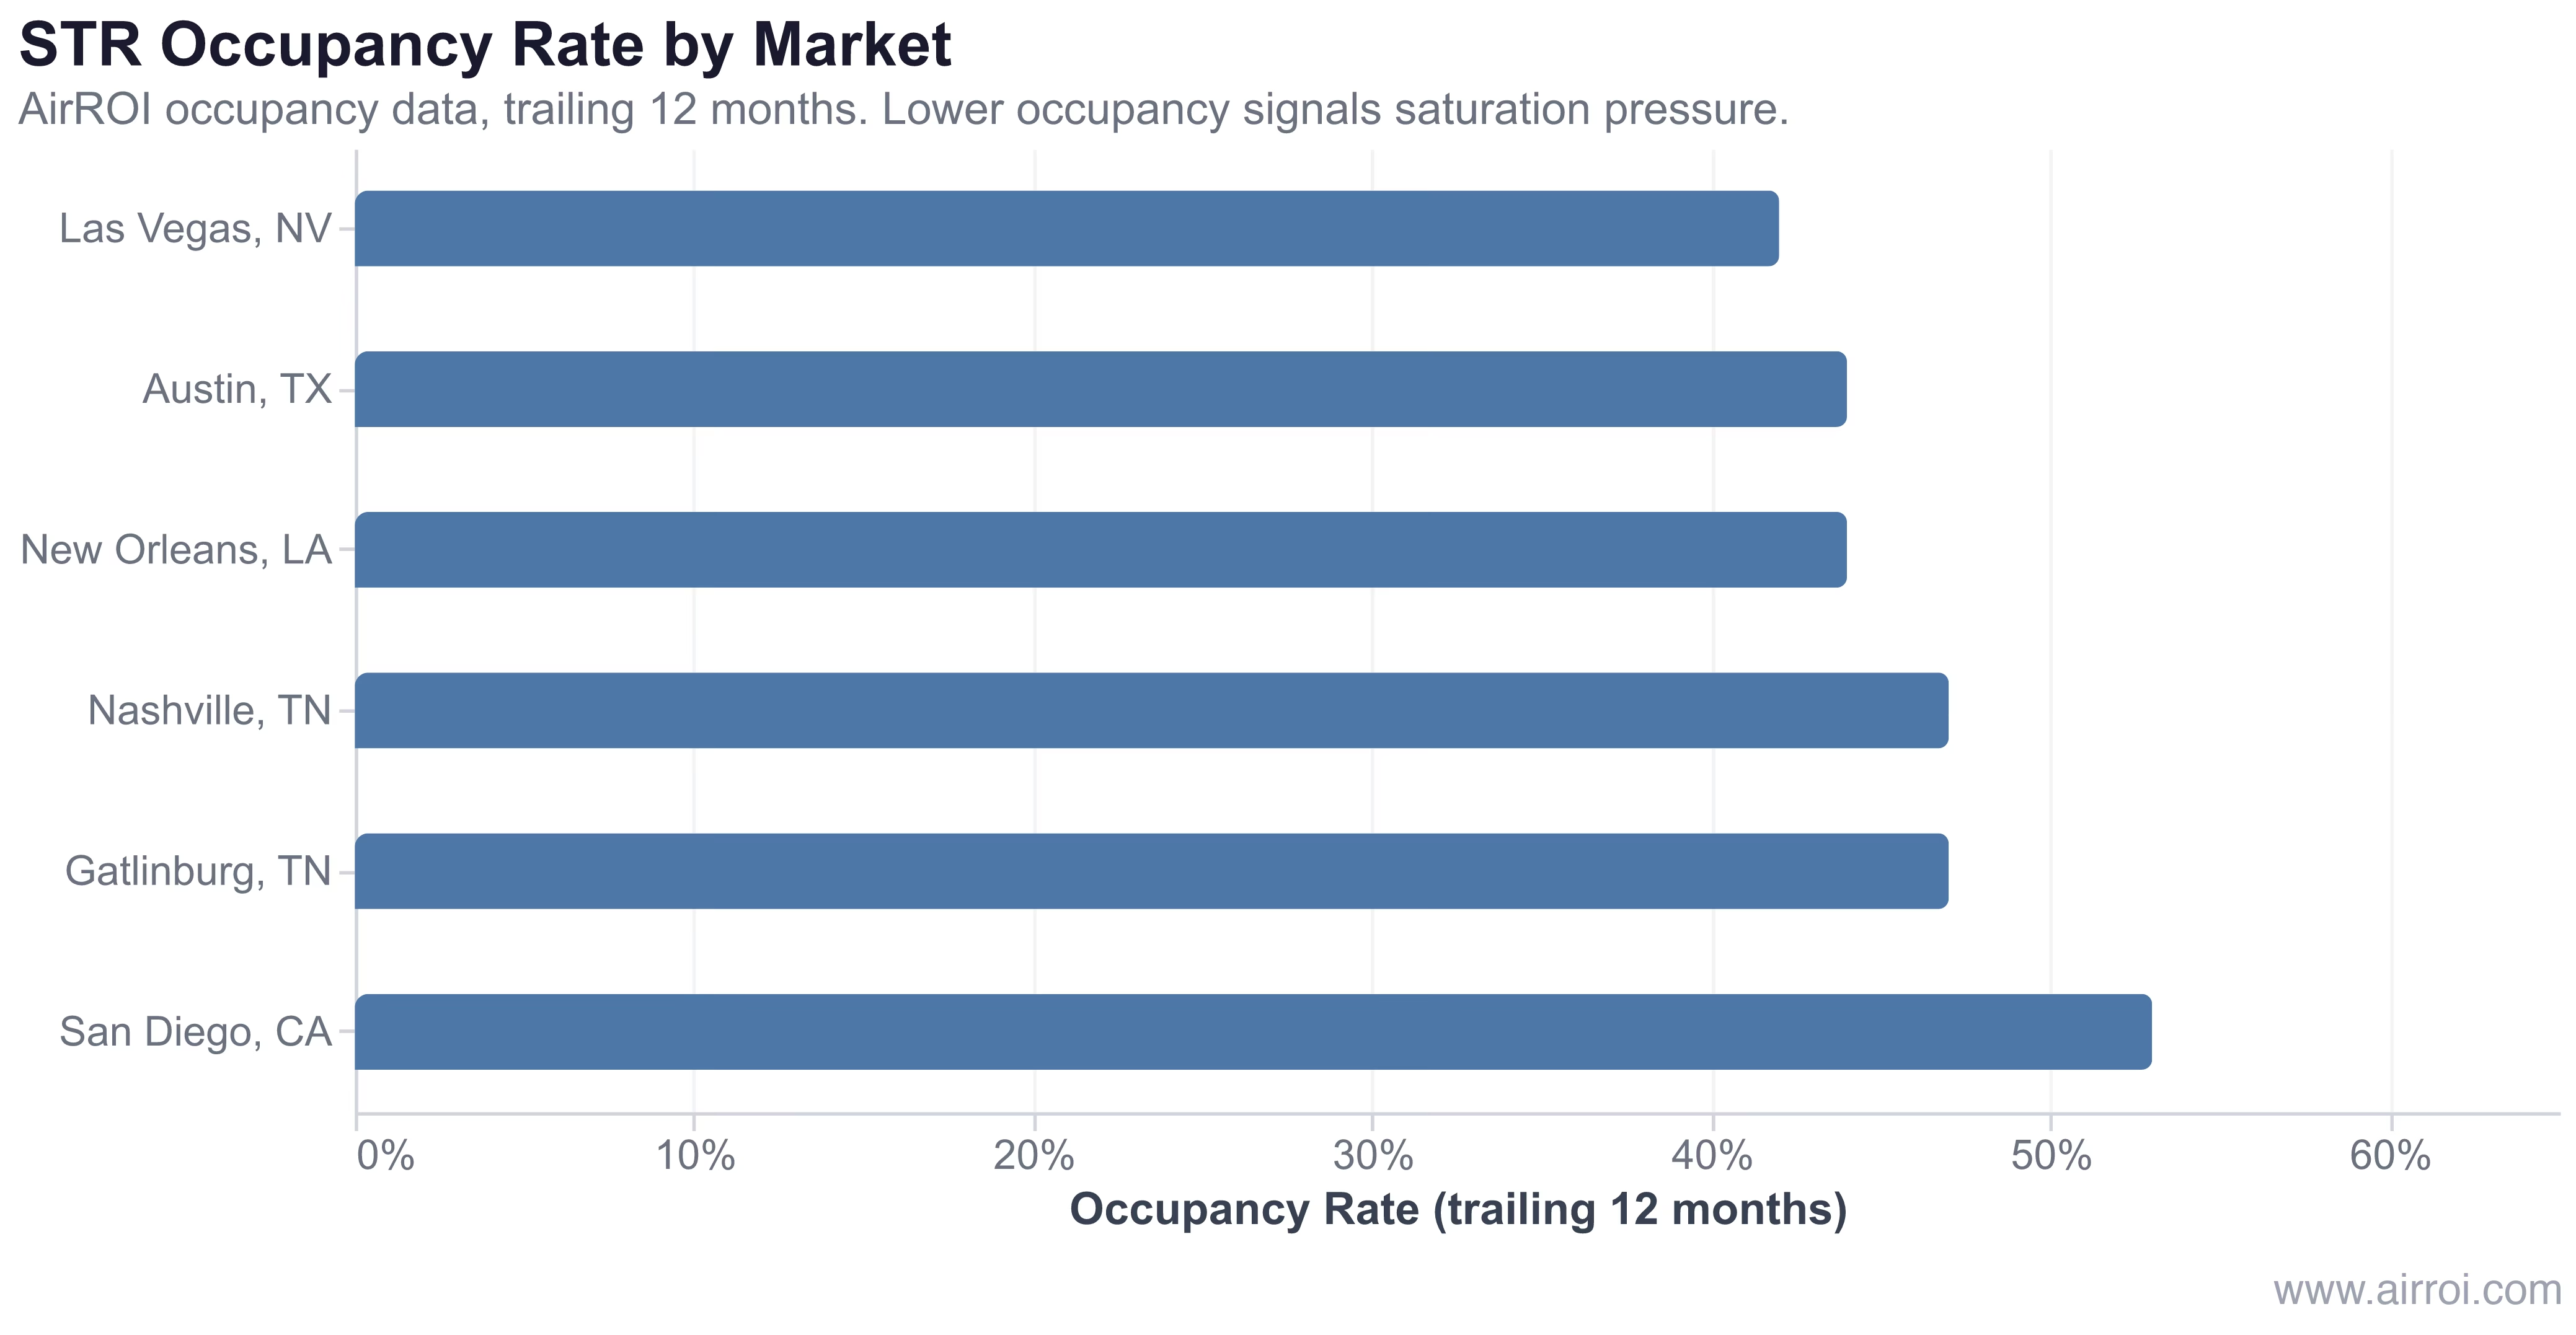
In AirROI's analysis of more than 39,000 active listings across six US markets, occupancy diverges sharply — and the gap directly reflects saturation pressure. Las Vegas (42%), Austin (44%), and New Orleans (44%) cluster at the low end, each carrying heavy listing counts relative to their booking depth. San Diego (53%) holds the strongest position, supported by consistent coastal leisure demand and supply constraints.
The markets investors most associate with Airbnb opportunity — Vegas for events, Austin for tech growth — are precisely the markets where listing supply surged fastest and where occupancy compression now bites hardest.
The Saturation Cycle
Most STR markets follow a predictable arc:
- Discovery: Early adopters earn outsized returns; media coverage amplifies the opportunity
- Growth: New hosts enter; supply increases but demand keeps pace and occupancy holds
- Saturation: Supply growth outruns demand; occupancy and ADR compress across the board
- Correction: Underperforming hosts exit the platform; supply contracts naturally
- Maturity: Remaining operators are typically more professional; RevPAR stabilizes at a new equilibrium
Why Market Saturation Matters for Airbnb Hosts
Understanding saturation directly shapes the four decisions that determine STR investment outcomes:
- Pricing strategy: In saturated markets, rate cuts alone do not recover occupancy — they start a race to the bottom. Sophisticated dynamic pricing that holds rate on high-demand nights while filling shoulder periods outperforms blanket discounting. See how the booking-window compression in saturated markets changes the optimal dynamic-pricing response.
- Investment timing: Monitoring active-listing growth rates before acquisition is as important as underwriting revenue. A market with 20% annual listing growth and flat demand is approaching saturation regardless of current occupancy.
- Portfolio diversification: If a primary market is saturated, adjacent submarkets with stronger occupancy fundamentals often offer better risk-adjusted returns.
- Operational focus: In saturated markets, guest-experience quality — fast responses, pristine cleanliness, thoughtful amenities — becomes a durable competitive moat. Guest analytics show exactly where the highest-performing hosts in any market concentrate their operational attention.
Competing in a Saturated Market
Saturation raises the performance bar for every host in the market. The strategies that consistently separate top-quartile performers from the field:
- Analyze your comp set at the submarket level, not the city level — saturation is often a neighborhood-by-neighborhood phenomenon
- Target underserved niches: pet-friendly properties, remote-worker setups, and large-group configurations each tap demand pools that generic listings underserve
- Optimize seasonal pricing: Capturing full rate on peak weekends funds the volume discounts needed to sustain occupancy in shoulder periods — the data-driven dynamic pricing playbook details the exact approach
- Invest in amenities that command rate premiums: hot tubs, game rooms, and fast Wi-Fi consistently lift ADR in markets where standard listings compete on price alone
- Monitor your market dashboard regularly to spot absorption-rate changes and competitor-count shifts before they hit your calendar
Frequently Asked Questions
A saturated market shows occupancy falling below 45%, ADR declining year-over-year despite stable travel demand, and active-listing growth running well ahead of booking volume. In AirROI's data, Las Vegas and Austin both sit at 44% occupancy — among the lowest in the dataset — while markets like San Diego hold 53%, illustrating the spread between saturated and healthy fundamentals.
Yes. Hosts who differentiate through unique amenities, superior guest experience, professional photography, and dynamic pricing consistently outperform market-average occupancy even in oversupplied conditions. Niche positioning — pet-friendly stays, remote-worker setups, large-group properties — captures underserved demand that generic listings miss.
Saturation most commonly follows a supply surge: media coverage of STR profitability attracts new hosts, regulatory light-touch periods lower barriers, and institutional investors add inventory at scale. New York City's experience is instructive in reverse — Local Law 18 enforcement cut active short-stay listings by roughly 90%, tightening supply and lifting RevPAR for compliant hosts.
Saturation is a supply-side condition: too many listings chasing the same demand pool. A down market is a demand-side contraction — fewer travelers, lower booking intent, recession-driven pullback. Both compress occupancy, but the cure differs: saturation resolves as weak hosts exit; a demand downturn requires pricing down to stimulate volume regardless of supply.
Saturation reduces RevPAR directly, shrinking net operating income and compressing implied cap rates. A host earning $44,039 annually in a balanced market can see revenue fall 15–25% if occupancy drops from 47% to 38%, turning a viable investment into a break-even or loss position. Monitoring active-listing growth rates before purchasing is a critical pre-investment check.