
Airbnbust
Key Takeaways
- Airbnbust describes market saturation driving down STR profitability — it is real in specific markets, not a universal trend
- Supply growth of 20–40% across many markets outpaced post-pandemic demand normalization
- RevPAR diverges sharply by market: AirROI data shows a $97 gap between the lowest- and highest-performing markets in the basket
- Well-differentiated properties with dynamic pricing hold pricing power even in saturated markets
- Data-driven monitoring — occupancy trend, supply growth rate, RevPAR — gives hosts early warning before revenue erodes
What Caused the Airbnbust
The Airbnbust resulted from a convergence of market forces that arrived at the same time:
| Factor | Impact | Timeline |
|---|---|---|
| Pandemic-era STR boom | Wave of new hosts entered chasing peak-era returns | 2020–2022 |
| Rapid supply growth | Active listings grew 20–40% in many markets | 2021–2023 |
| Travel normalization | Post-pandemic revenge travel subsided; demand plateaued | 2023–2024 |
| Rising interest rates | Higher mortgage costs squeezed investor-level margins | 2022–2024 |
| Regulatory tightening | Some cities capped permits or imposed night limits, but others added supply freely | Ongoing |
| Inflation | Operating costs rose while guests grew more price-sensitive | 2022–present |
Measuring Airbnbust Pressure in Your Market
Airbnbust pressure shows up in four metrics. Watching all four together is more reliable than any single indicator:
| Metric | Healthy Range | Airbnbust Warning Signal |
|---|---|---|
| Occupancy rate YoY | Stable or growing | Declining 10%+ year-over-year |
| ADR YoY | Stable or growing | Falling in nominal terms |
| Supply growth | Under 10% annually | 15%+ with no matching demand gain |
| RevPAR trend | Stable or growing | Declining two or more consecutive quarters |
RevPAR Across Key Markets: Where the Bust Bites
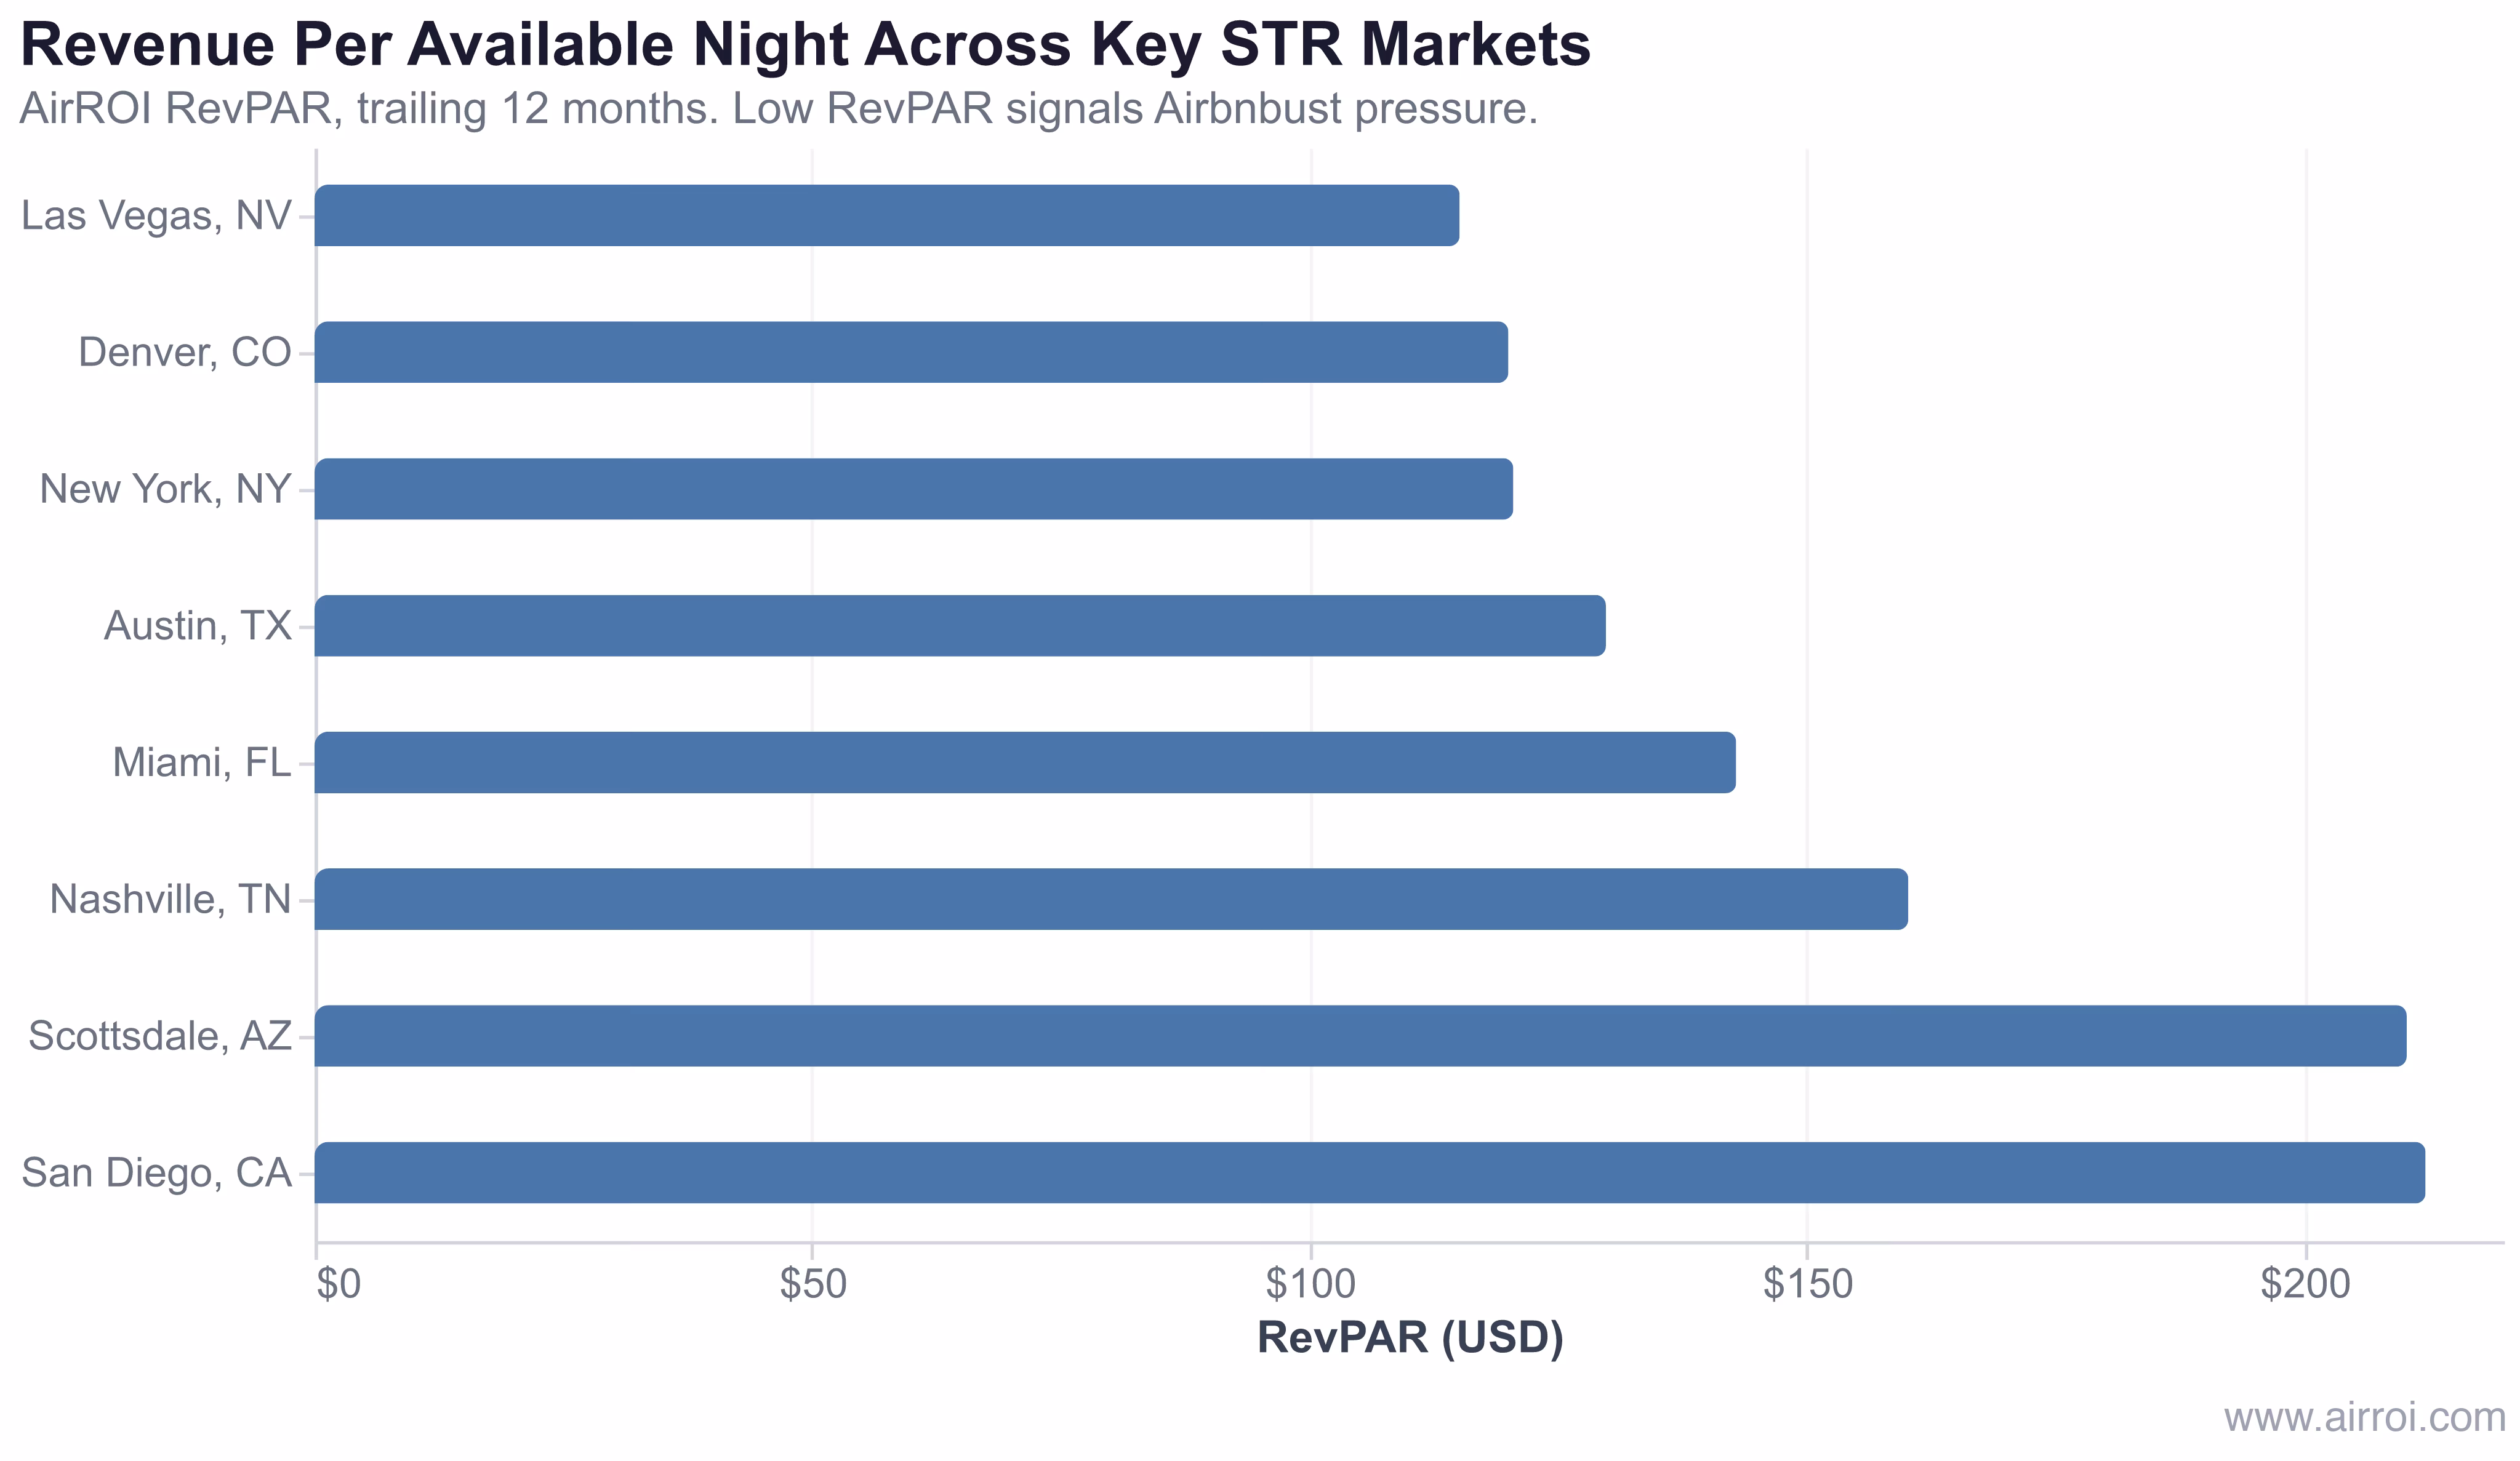
RevPAR divergence is the clearest fingerprint of Airbnbust pressure: when markets that share similar demand profiles show $80–$100 RevPAR gaps, supply imbalance is almost always the explanation.
Why the Airbnbust Is Highly Localized
The most important fact about the Airbnbust is that it does not apply uniformly. A host in Gatlinburg, TN — where AirROI data shows $50,438 median annual revenue and a $376.50 ADR — is operating in a fundamentally different environment than a host in a flooded inland market. Several factors determine how exposed a market is:
- Supply constraint: Markets with geographic limits (mountains, coastlines) or strict permitting cannot be flooded with new listings
- Demand base: Markets drawing leisure travelers year-round — not just pandemic-era "work from anywhere" guests — have stickier demand
- Price point flexibility: Higher-ADR markets have room to discount and still remain profitable; budget markets have no cushion
- Regulatory friction: Cities that cap STR permits effectively limit the supply side of the equation
How to Operate Through an Airbnbust Market
Surviving — and outperforming — in a supply-saturated market requires operating at a fundamentally higher level than the market's median host:
- Know your market numbers — track supply growth, occupancy trends, and RevPAR in your specific submarket, not just at the city level
- Differentiate aggressively — generic listings get punished first in crowded markets; unique amenities and standout photography retain pricing power
- Implement dynamic pricing — manual pricing in a shifting market almost always leaves revenue on the table or produces empty nights; see the analysis of the closing dynamic-pricing window for why this matters more now than it did in 2021
- Audit operating costs — negotiate aggressively with cleaners, maintenance, and supply vendors; margin recovery through cost reduction is immediate where revenue recovery is not
- Diversify booking channels — platform dependency increases vulnerability when one channel suppresses a listing's visibility during downturns
- Monitor your comp set — build a comparable set of 5–10 similar listings and track their pricing and availability weekly so you can respond to competitive moves before they erode your occupancy
Frequently Asked Questions
The Airbnbust is real in supply-saturated markets but overstated as a universal trend. Markets where listings grew 20–40% without matching demand gains — particularly pandemic-era boomtowns — have seen genuine RevPAR compression. AirROI data shows Las Vegas and Austin sitting at $115–$130 RevPAR while Scottsdale and San Diego clear $210, illustrating how sharply outcomes diverge by market.
The primary driver is supply growing faster than demand. A pandemic-era surge of new hosts chasing peak returns flooded many markets with listings. When post-pandemic revenge travel normalized and supply kept rising, occupancy and nightly rates fell. Rising mortgage rates squeezed investor margins further, and tightening regulations in some cities added additional pressure.
Watch for occupancy falling below 45% year-over-year, RevPAR declining two or more consecutive quarters, supply growing faster than 15% annually, and ADR falling in nominal terms. AirROI's Market Atlas lets you track all four metrics in real time so you can distinguish a temporary dip from a structural decline.
Differentiate with unique amenities, implement data-driven dynamic pricing, diversify across booking platforms, and audit operating costs ruthlessly. Above all, monitor your specific submarket — the Airbnbust is highly localized, and knowing your numbers early gives you time to adapt before revenue erodes.
Supply-demand imbalances in STR markets tend to self-correct over two to four years as marginal hosts exit, regulations limit new supply, and demand gradually absorbs the inventory. Markets with strong underlying travel demand and high barriers to new supply — coastal leisure destinations, cities with strict permit caps — typically recover faster than undifferentiated inland markets.