
Active Listing
Key Takeaways
- An active listing has had at least one booking or calendar update in the trailing 12 months — the standard window used by STR analytics platforms
- Active listing count is the correct measure of real supply; total listing counts routinely overstate competition by 20–40%
- Not all published listings are active — many are dormant, seasonal, or outright abandoned profiles still indexed by platforms
- Tracking active listing growth against demand reveals saturation pressure before it hits revenue
- Your comp set must be built exclusively from active listings for any benchmarking to be meaningful
Active vs. Inactive Listings
Understanding the distinction is the foundation of accurate market analysis:
| Classification | Definition | Market Impact |
|---|---|---|
| Active listing | Booking or calendar activity within 12 months | Genuine competitor; counts toward true supply |
| Seasonal listing | Active only during certain months | Increases supply during peak periods; eases off-season competition |
| Dormant listing | Published but no activity for 12+ months | Inflates raw platform counts but not actual supply |
| Delisted property | Removed from platform | No longer part of supply; sometimes a leading indicator of host attrition |
Active Listing Counts Across US Markets
Active listing volume varies enormously by market size, regulatory environment, and investment maturity. In AirROI's analysis of more than 59,000 active listings across seven US markets, the range runs from New York's 11,468 to New Orleans' 5,007 — but raw count alone is less informative than count relative to local demand.
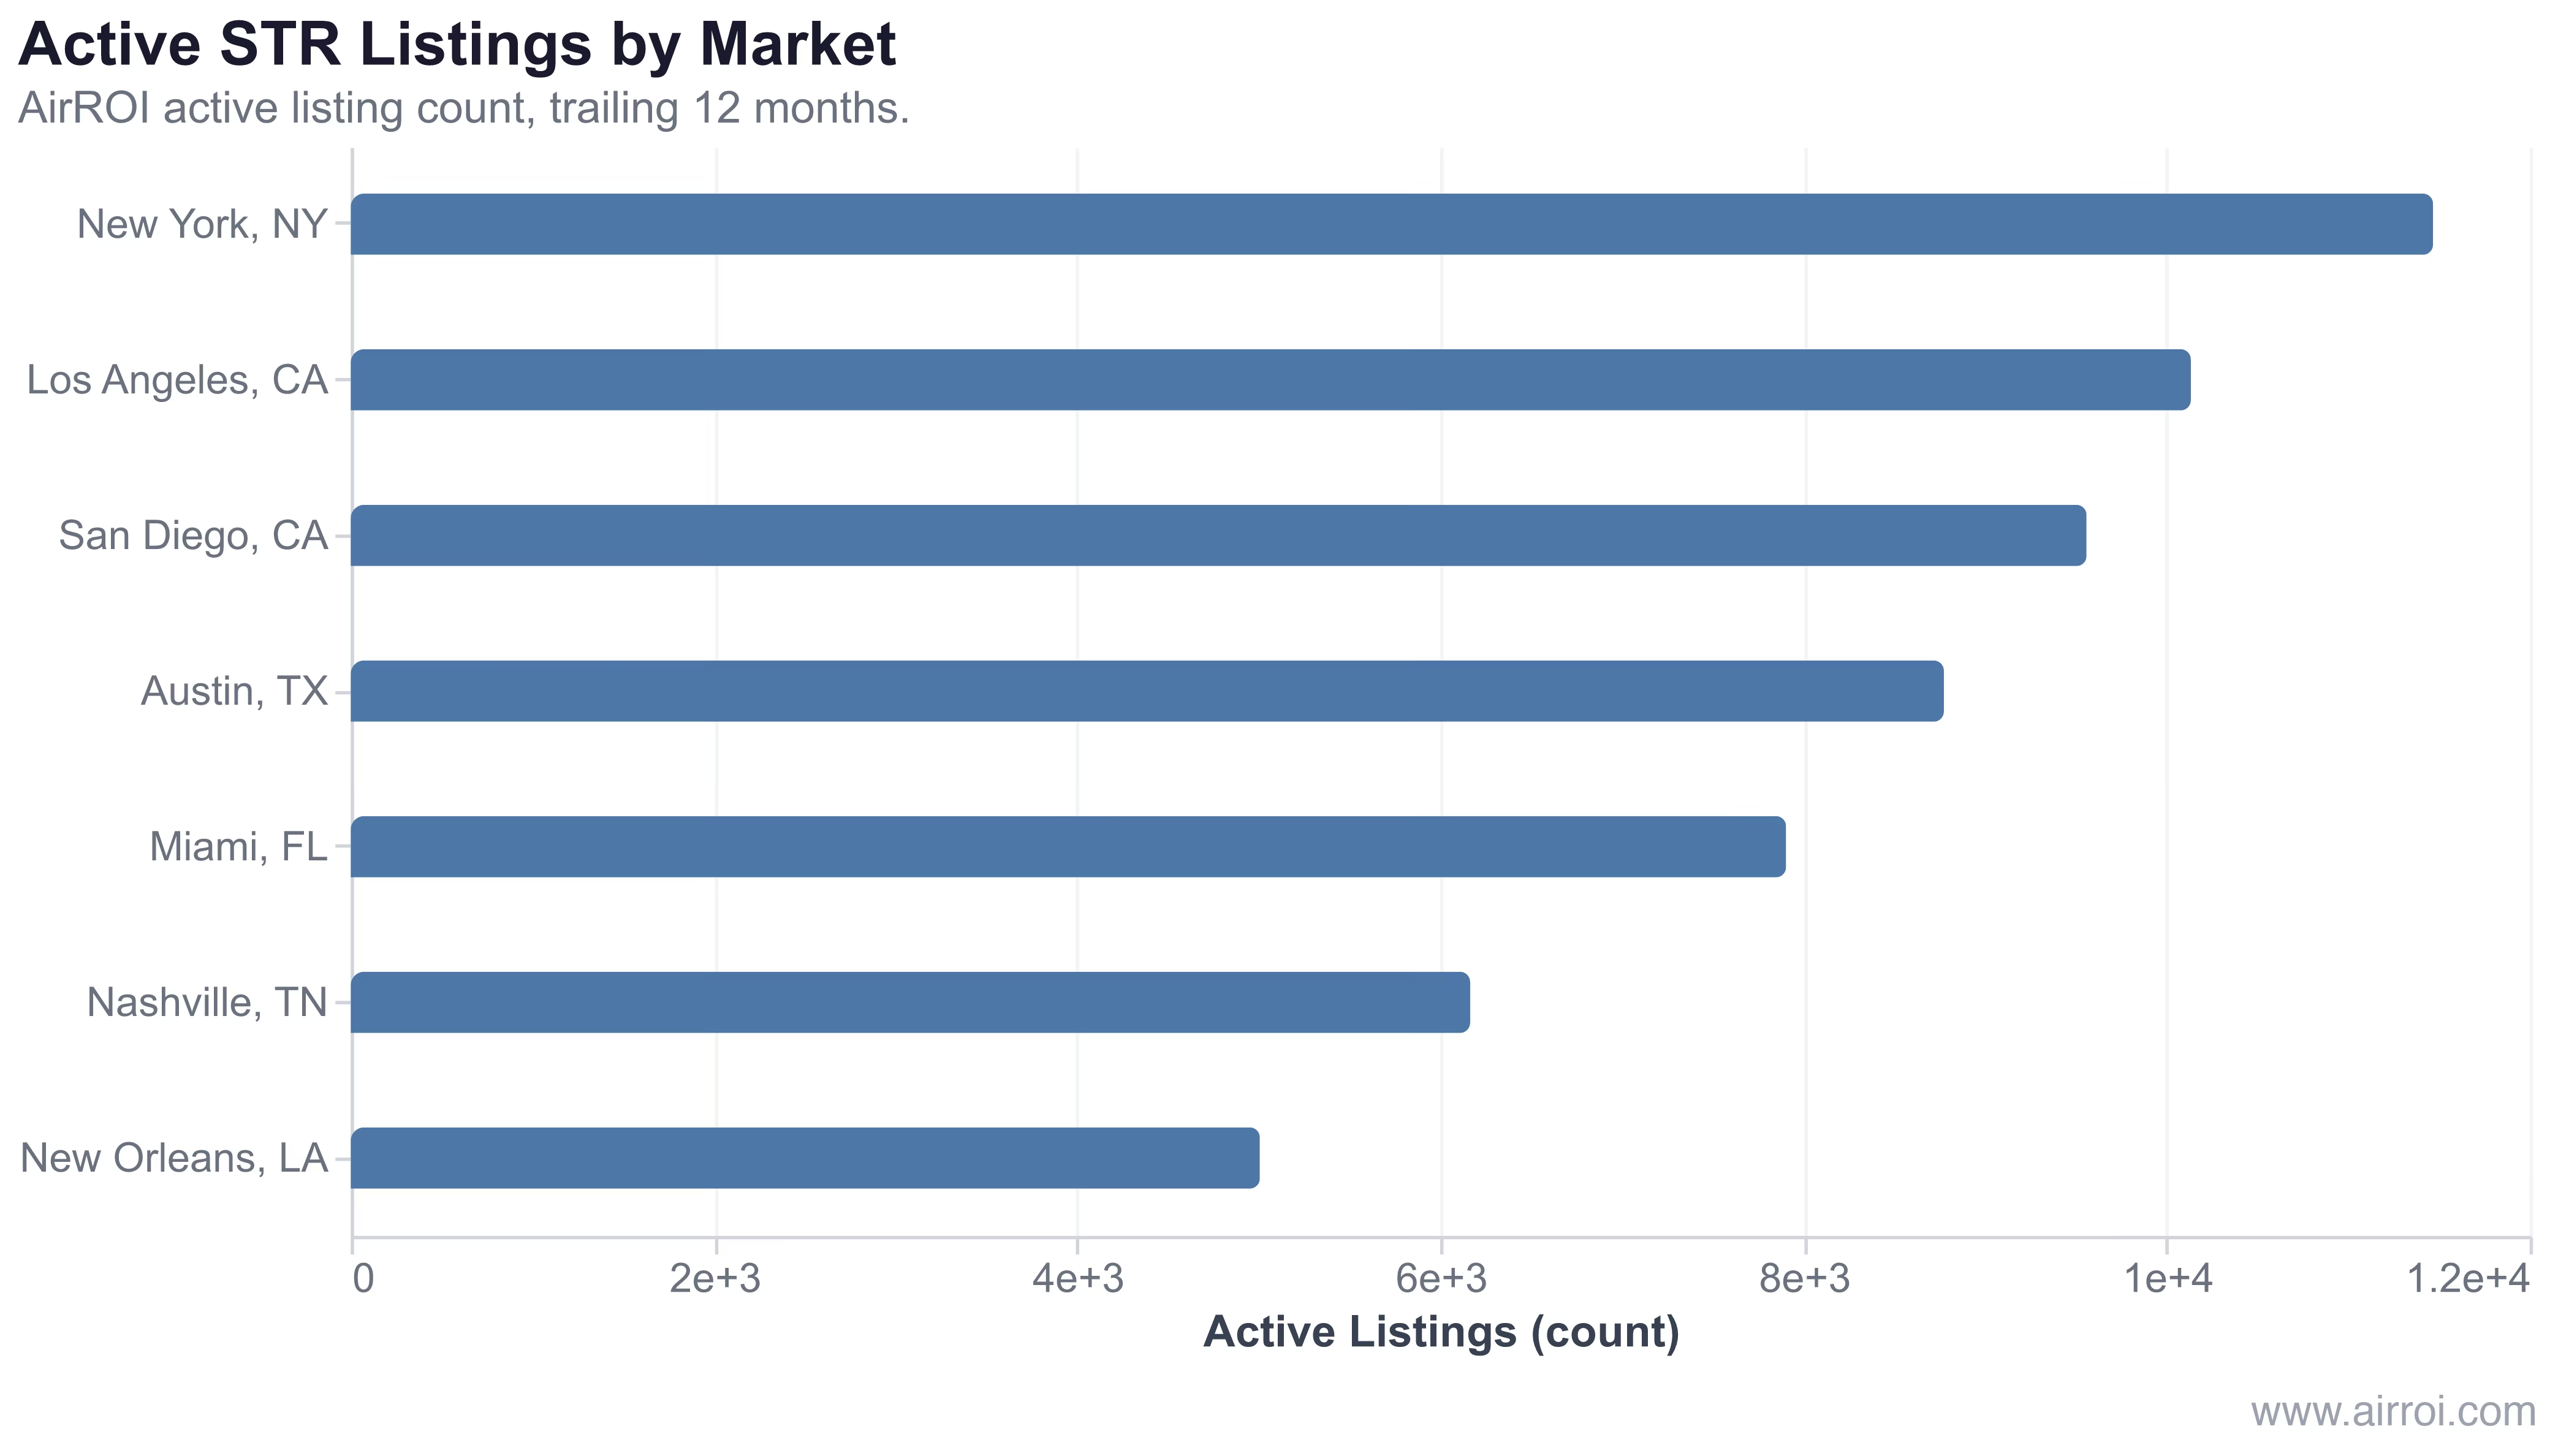
In AirROI's analysis of 59,013 active listings across New York, Los Angeles, San Diego, Austin, Miami, Nashville, and New Orleans, New York leads by count (11,468) while New Orleans posts the lowest (5,007) — yet New Orleans hosts achieved a median ADR of $335, higher than New York's $225, illustrating that smaller active supply does not mean weaker pricing power.
The number that matters is not how many listings a platform shows — it is how many hosts are actually competing for guests right now. Active listing count is the answer to that question.
Why Active Listing Count Matters for Market Analysis
Active listing data drives several core analytical workflows:
- Accurate competition assessment: A market with 2,000 total listings but only 1,200 active ones is 40% less competitive than the headline count implies. Basing pricing strategy on inflated totals leads to unnecessary rate concessions.
- Supply-demand balance: Rising active listings relative to demand signals emerging saturation — typically showing up as declining occupancy rates 2–3 months later. AirROI's trailing data across 12 markets shows occupancy ranging from 42% in Las Vegas to 55% in San Francisco, gaps that track closely with active supply intensity.
- Absorption rate calculation: The pace at which new active listings enter a market (net of attrition) determines how quickly supply pressure builds. A market adding 50 active listings per month against stable demand is a different investment proposition than one losing 30.
- Investment due diligence: A high ratio of active-to-total listings signals healthy host engagement. A low ratio — say, 50% or less — often means the market has seen significant host burnout or regulatory attrition.
How Regulation Reshapes Active Supply
Regulation is the most abrupt force acting on active listing counts. In New York City, after Local Law 18 took effect in September 2023, AirROI data shows active listings declined from approximately 26,775 to roughly 10,500 by April 2026 — a drop of more than 60%. Short-stay listings under 30 nights fell by approximately 90% (NYC Mayor's Office). The median minimum-night requirement in New York now sits at 25.8 nights, reflecting a near-complete shift to 30-day-minimum stays.
Active Listing Trends to Watch
| Trend | What It Means | Recommended Action |
|---|---|---|
| Active listings growing faster than demand | Increasing competition | Strengthen differentiation; optimize pricing with dynamic pricing |
| Active listings declining | Hosts exiting the market | Potential opportunity if demand holds stable |
| Seasonal active listing spikes | Part-time hosts entering during peaks | Raise peak-season rates proactively |
| Active listing count stable | Mature, balanced market | Focus on operational excellence and reviews |
How to Use Active Listing Data
- Filter your market analysis to include only active listings for accurate supply assessment — never anchor on platform totals
- Track month-over-month changes to spot emerging competition in your submarket before it reaches your booking curve
- Compare active listing growth against occupancy rate trends to gauge the supply-demand balance; divergence is a leading warning signal
- Build your comp set exclusively from active listings with bookings in the last 90 days for the most accurate benchmarking
- Monitor regulatory developments in your market — a single ordinance can cut active supply by half, reshaping your competitive position overnight
Frequently Asked Questions
An active listing is a short-term rental property that has had at least one booking, calendar update, or availability change within the past 12 months. This distinguishes it from stale or abandoned listings that still appear on platforms but are no longer genuinely available for guests.
Total listing counts include dormant, delisted, or abandoned properties that inflate supply figures. Active listings provide a more accurate picture of the real competitive landscape because they represent properties that are actually competing for bookings in the market.
Look for recent reviews (within the last 3-6 months), updated calendar availability, and current pricing. A market analytics tool like AirROI can filter for active listings automatically, showing you only the properties that are genuinely competing in your market.
When active listing count grows faster than demand, occupancy rates compress and ADR tends to soften as hosts compete for the same pool of guests. Conversely, a declining active supply in a stable-demand market gives remaining hosts pricing leverage and higher occupancy. Tracking the ratio of active listings to demand is the earliest indicator of shifting market dynamics.
Strict regulation can dramatically shrink active supply. In New York City, after Local Law 18 took effect in September 2023, AirROI data shows active listings fell from roughly 26,775 to approximately 10,500 by April 2026 — a drop of more than 60%. Markets with lighter regulatory regimes like Gatlinburg, TN maintain far more stable active supply, which directly supports host revenue.