Market Dashboard
Key Takeaways
- A market dashboard centralizes the metrics that define market health: occupancy, ADR, RevPAR, supply growth, and demand trends
- Submarket-level filtering is essential — city-wide averages routinely mask 30-50% performance gaps between neighborhoods
- RevPAR is the most efficient single metric for cross-market comparison because it captures both pricing power and occupancy simultaneously
- Trend analysis over 12-24 months is more actionable than any single-point snapshot; patterns reveal what isolated numbers hide
- The most valuable dashboards layer comp set tools and forward-looking booking pace data on top of historical performance
What a Market Dashboard Measures
A well-designed market dashboard organizes data into five functional layers:
| Category | Key Metrics | What They Tell You |
|---|---|---|
| Performance | Occupancy rate, ADR, RevPAR | Current market health and pricing power |
| Supply | Active listings, growth rate, property type mix | Competitive pressure and market saturation trajectory |
| Demand | Booked nights, booking pace, search trends | Traveler intent and short-term booking momentum |
| Seasonality | Monthly and weekly performance distributions | Seasonal patterns that govern dynamic pricing windows |
| Composition | Bedroom count breakdown, property type, amenity profile | Market structure and where your listing sits within it |
RevPAR Across Key STR Markets
RevPAR (revenue per available rental day) is the single number that most market dashboards center their analysis on because it compresses pricing power and occupancy rate into one comparable figure. The spread across major US markets is striking.
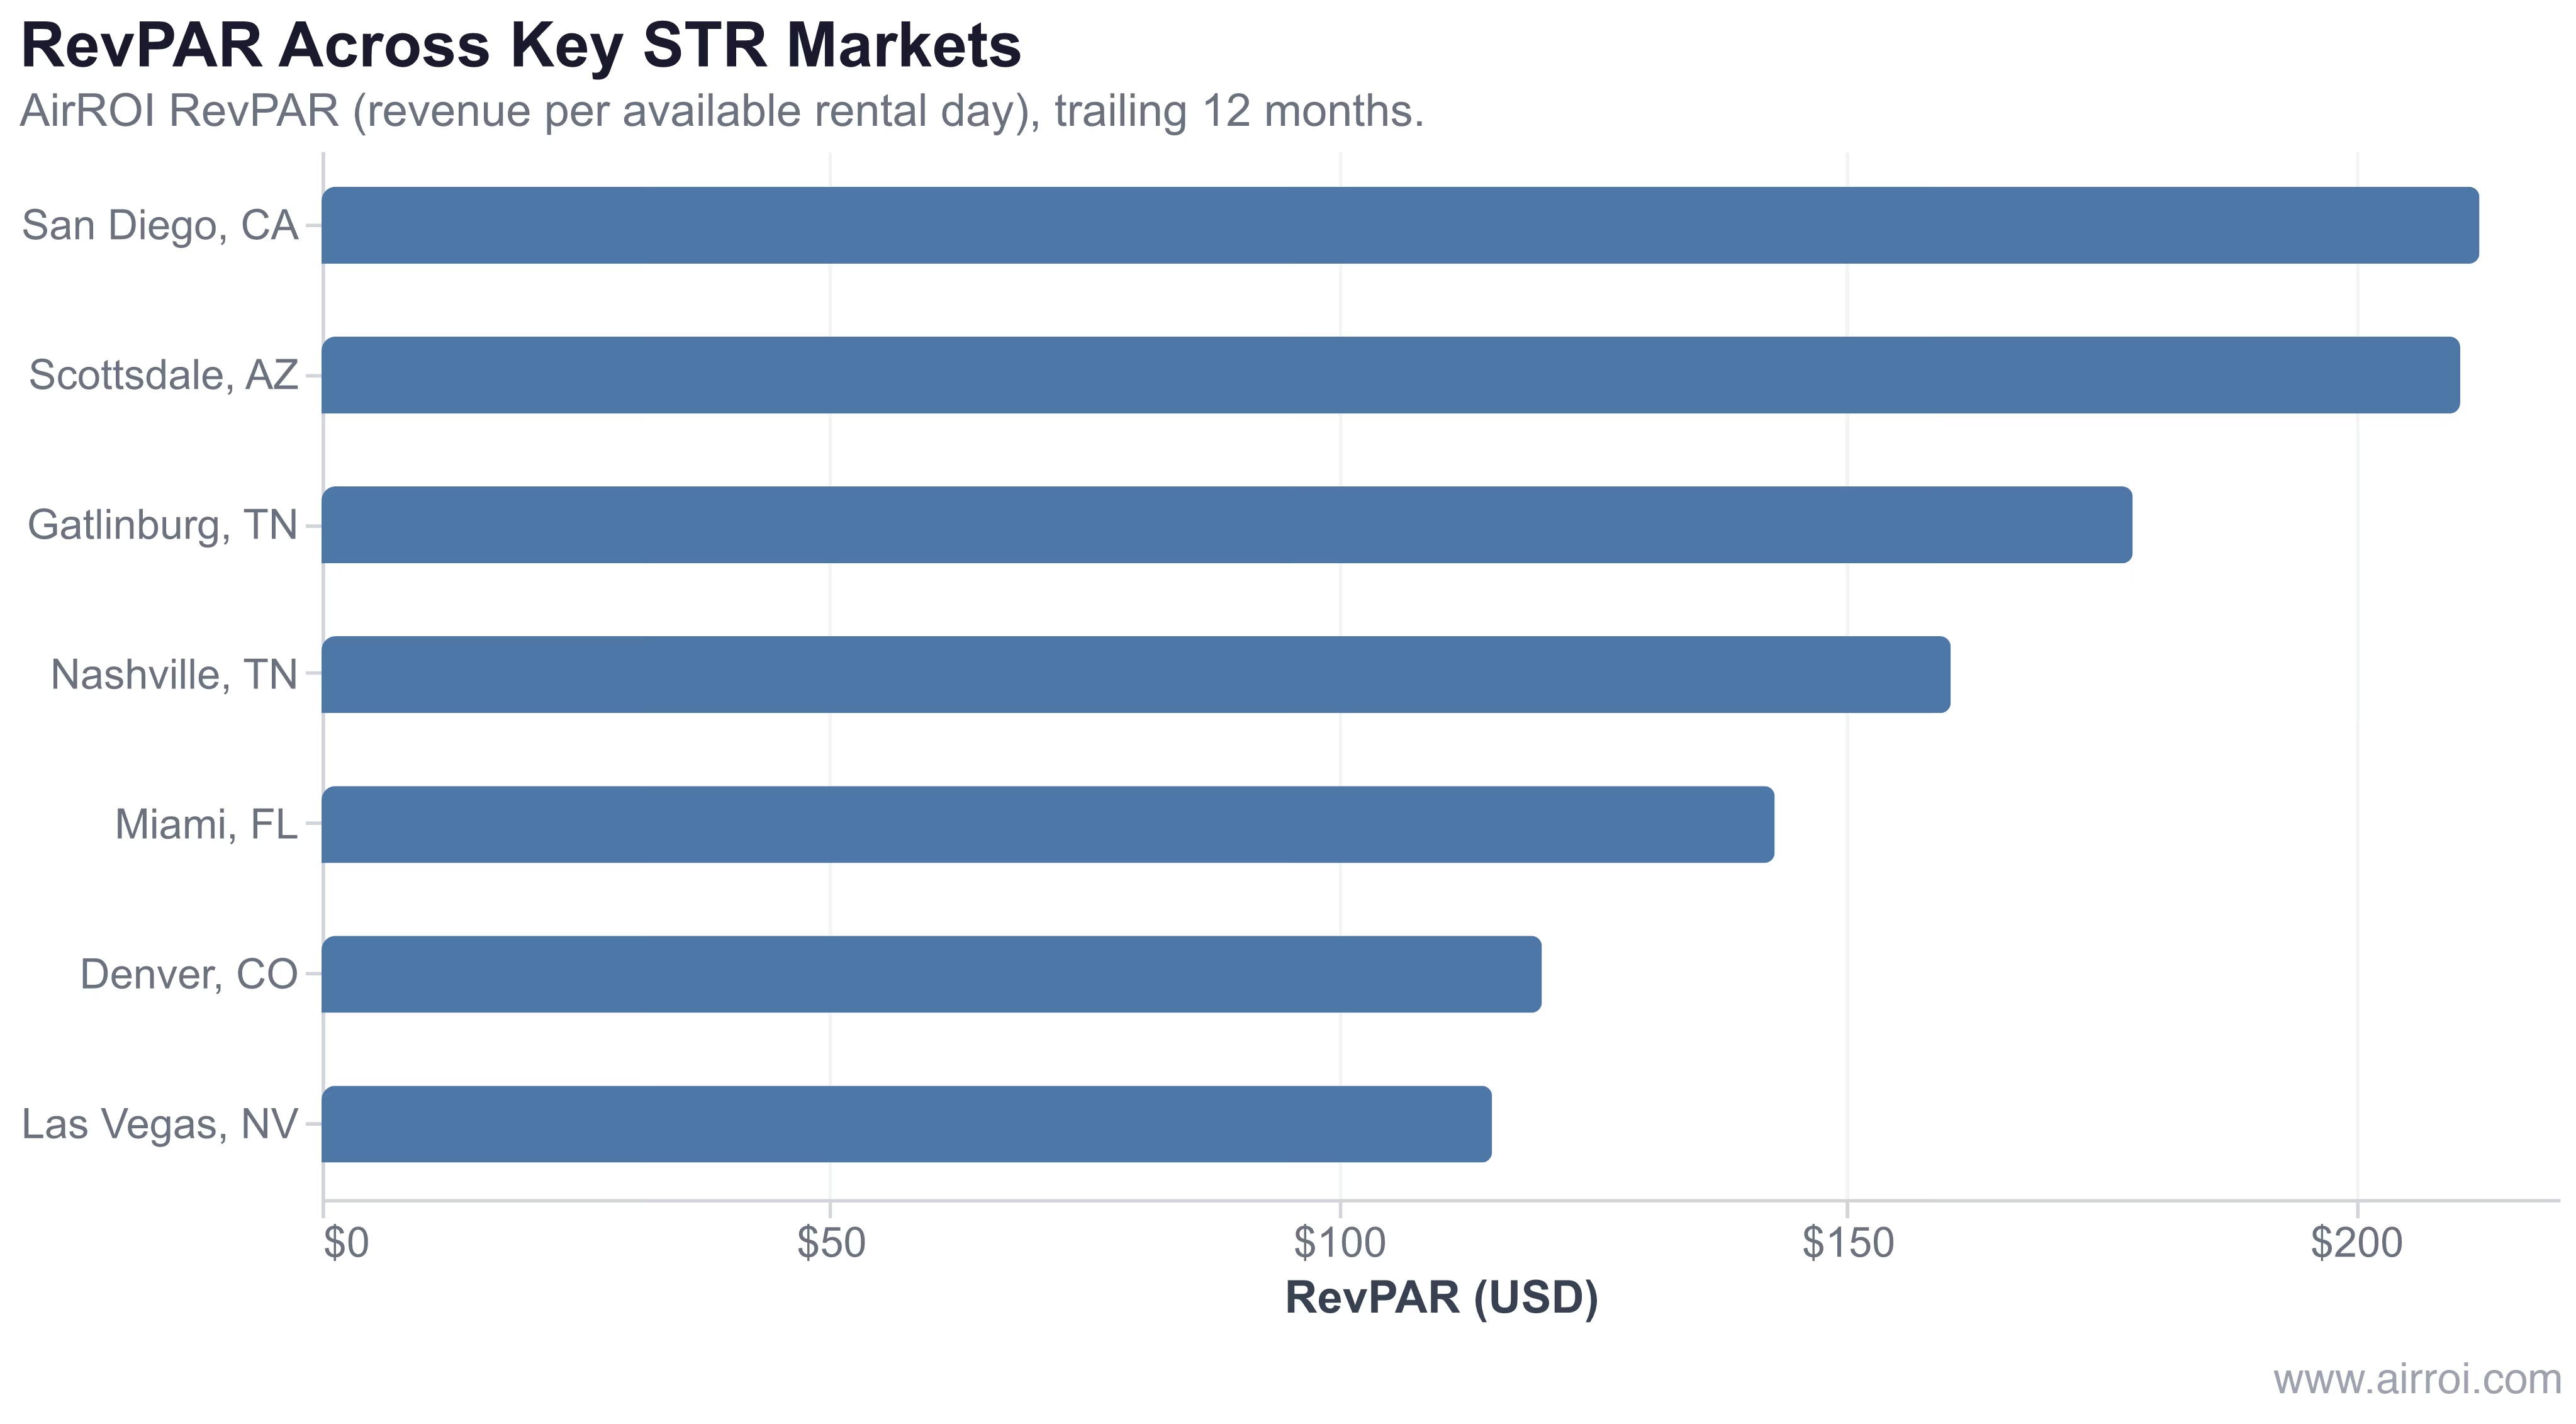
In AirROI's analysis of 38,720 active listings across seven US markets, San Diego leads at $212 RevPAR while Las Vegas trails at $115 — a 84% performance gap within the same country. Nashville ($160) and Gatlinburg ($178) deliver the strongest RevPAR among inland markets, a pattern driven by high ADR rather than occupancy, which sits at 47% for both. A host relying solely on their own booking calendar cannot see this spread; a market dashboard makes it immediate.
| Market | Occupancy | ADR | RevPAR | Active Listings |
|---|---|---|---|---|
| San Diego, CA | 53% | $394.90 | $212.20 | 9,560 |
| Scottsdale, AZ | 49% | $421.10 | $210.30 | 4,310 |
| Gatlinburg, TN | 47% | $376.50 | $178.10 | 3,622 |
| Nashville, TN | 47% | $353.60 | $160.20 | 6,165 |
| Miami, FL | 49% | $291.00 | $142.90 | 7,905 |
| Denver, CO | 54% | $221.50 | $120.00 | 3,739 |
| Las Vegas, NV | 42% | $274.20 | $115.10 | 3,419 |
RevPAR doesn't just rank markets — it diagnoses them. Denver's 54% occupancy with a $120 RevPAR signals a pricing problem; Scottsdale's 49% occupancy with a $210 RevPAR signals a positioning advantage. The same occupancy number in different markets tells completely different revenue stories.
Why a Market Dashboard Matters for STR Hosts and Investors
Operating without market data is like driving without a speedometer. A market dashboard provides the context behind every major decision:
- Pricing confidence: Knowing your market's median ADR is $353 while your rate sits at $280 reveals a concrete opportunity to test higher prices — without a dashboard, underpricing reads as "staying competitive."
- Trend spotting: A dashboard showing 18% supply growth against only 4% demand growth reveals approaching market saturation months before it shows up in your own booking rate.
- Investment underwriting: Before acquiring a property, market dashboard data provides the revenue benchmarks, occupancy expectations, and competitive landscape a lender or underwriter needs. Platforms like AirROI's top US markets analysis map these metrics across hundreds of markets.
- Performance diagnosis: Comparing your metrics against submarket averages distinguishes a market-wide softening from a listing-specific problem — two issues that require completely different responses.
What to Look for in a Market Dashboard
| Feature | Why It Matters |
|---|---|
| Submarket filtering | City-wide data masks neighborhood-level variations — a beach district and an urban core are different markets |
| 12-24 months of history | Enough history to separate seasonal patterns from structural trends |
| Property type segmentation | A 2BR condo competes differently than a 5BR vacation home; mixed data skews every benchmark |
| Weekly data refresh | Monthly updates are the floor; weekly updates catch booking pace shifts before they turn into lost revenue |
| Export capabilities | Raw data access enables deeper analysis in spreadsheets or investment models |
| Comp set tools | Narrows the benchmark to your actual competitors rather than all listings in the city |
| Forward-looking data | Booking pace and future availability show where the market is heading, not just where it has been |
How to Use a Market Dashboard Effectively
- Start market-wide — review city-level occupancy and RevPAR trends to understand the macro before filtering down
- Filter to your comp set by matching bedroom count, property type, and neighborhood to get benchmarks that actually apply to your listing
- Compare year-over-year rather than month-to-month — seasonal variation makes sequential monthly comparisons misleading
- Track supply growth monthly — new listings entering a market depress occupancy and ADR before the effect becomes obvious in your own calendar
- Use booking pace for forward rates — if the next 60 days are booking faster than the same period last year, the market can support higher rates now, not after the window closes
- Check before seasonal pricing adjustments — market data should anchor every major rate decision, especially for high-demand periods where mispricing has an outsized revenue cost
Frequently Asked Questions
A comprehensive market dashboard displays occupancy rate trends, ADR, RevPAR, active listing counts and growth rates, demand trends, seasonality patterns, property type breakdowns, and submarket filtering. The best dashboards add comp set analysis and forward-looking booking pace data so hosts can act before market shifts hit their calendar.
Review your market dashboard at least weekly for pricing decisions and monthly for strategic planning. During peak seasons, event weekends, or whenever your booking pace slows unexpectedly, daily monitoring lets you respond to market shifts before revenue is lost.
Free dashboards provide useful directional data but typically lack data freshness, geographic granularity, and metric depth. For hosts and investors making significant financial decisions, a paid analytics tool with weekly data updates and submarket-level detail delivers the accuracy needed for confident pricing and investment analysis.
Occupancy rate measures the share of available nights that are booked; RevPAR (revenue per available rental day) multiplies occupancy by ADR to capture both booking frequency and pricing power in one number. AirROI data shows San Diego at $212 RevPAR versus Las Vegas at $115, a gap that occupancy alone would not reveal since both markets have similar booking rates.