
Booking Pace
Key Takeaways
- Booking pace tracks how quickly future dates accumulate reservations compared to a historical benchmark — not just how many are booked
- A pace running ahead of last year's trajectory is a signal to hold or raise ADR, not to discount open dates
- A lagging pace more than 30 days from arrival typically calls for targeted rate reductions, not panic discounting
- AirROI data shows vacation and resort markets book 54–58 days in advance on average; urban markets cluster at 35–42 days
- Dynamic pricing engines treat booking pace as a primary input — understanding it makes those rate recommendations legible
How Booking Pace Works
Booking pace compares the percentage of nights already reserved for a future period at a given point in time against the same measurement from one year prior:
| Days Out | This Year Booked | Last Year at Same Point | Pace Assessment |
|---|---|---|---|
| 90 days | 20% | 15% | Ahead of pace (+5%) |
| 60 days | 45% | 50% | Behind pace (−5%) |
| 30 days | 65% | 60% | Ahead of pace (+5%) |
| 14 days | 80% | 78% | On pace |
Booking Lead Time by Market
A key input to pace analysis is the market's typical booking horizon — how far in advance guests customarily plan. Markets with longer lead times give hosts more runway; short-lead-time markets compress the pricing window to weeks, not months.
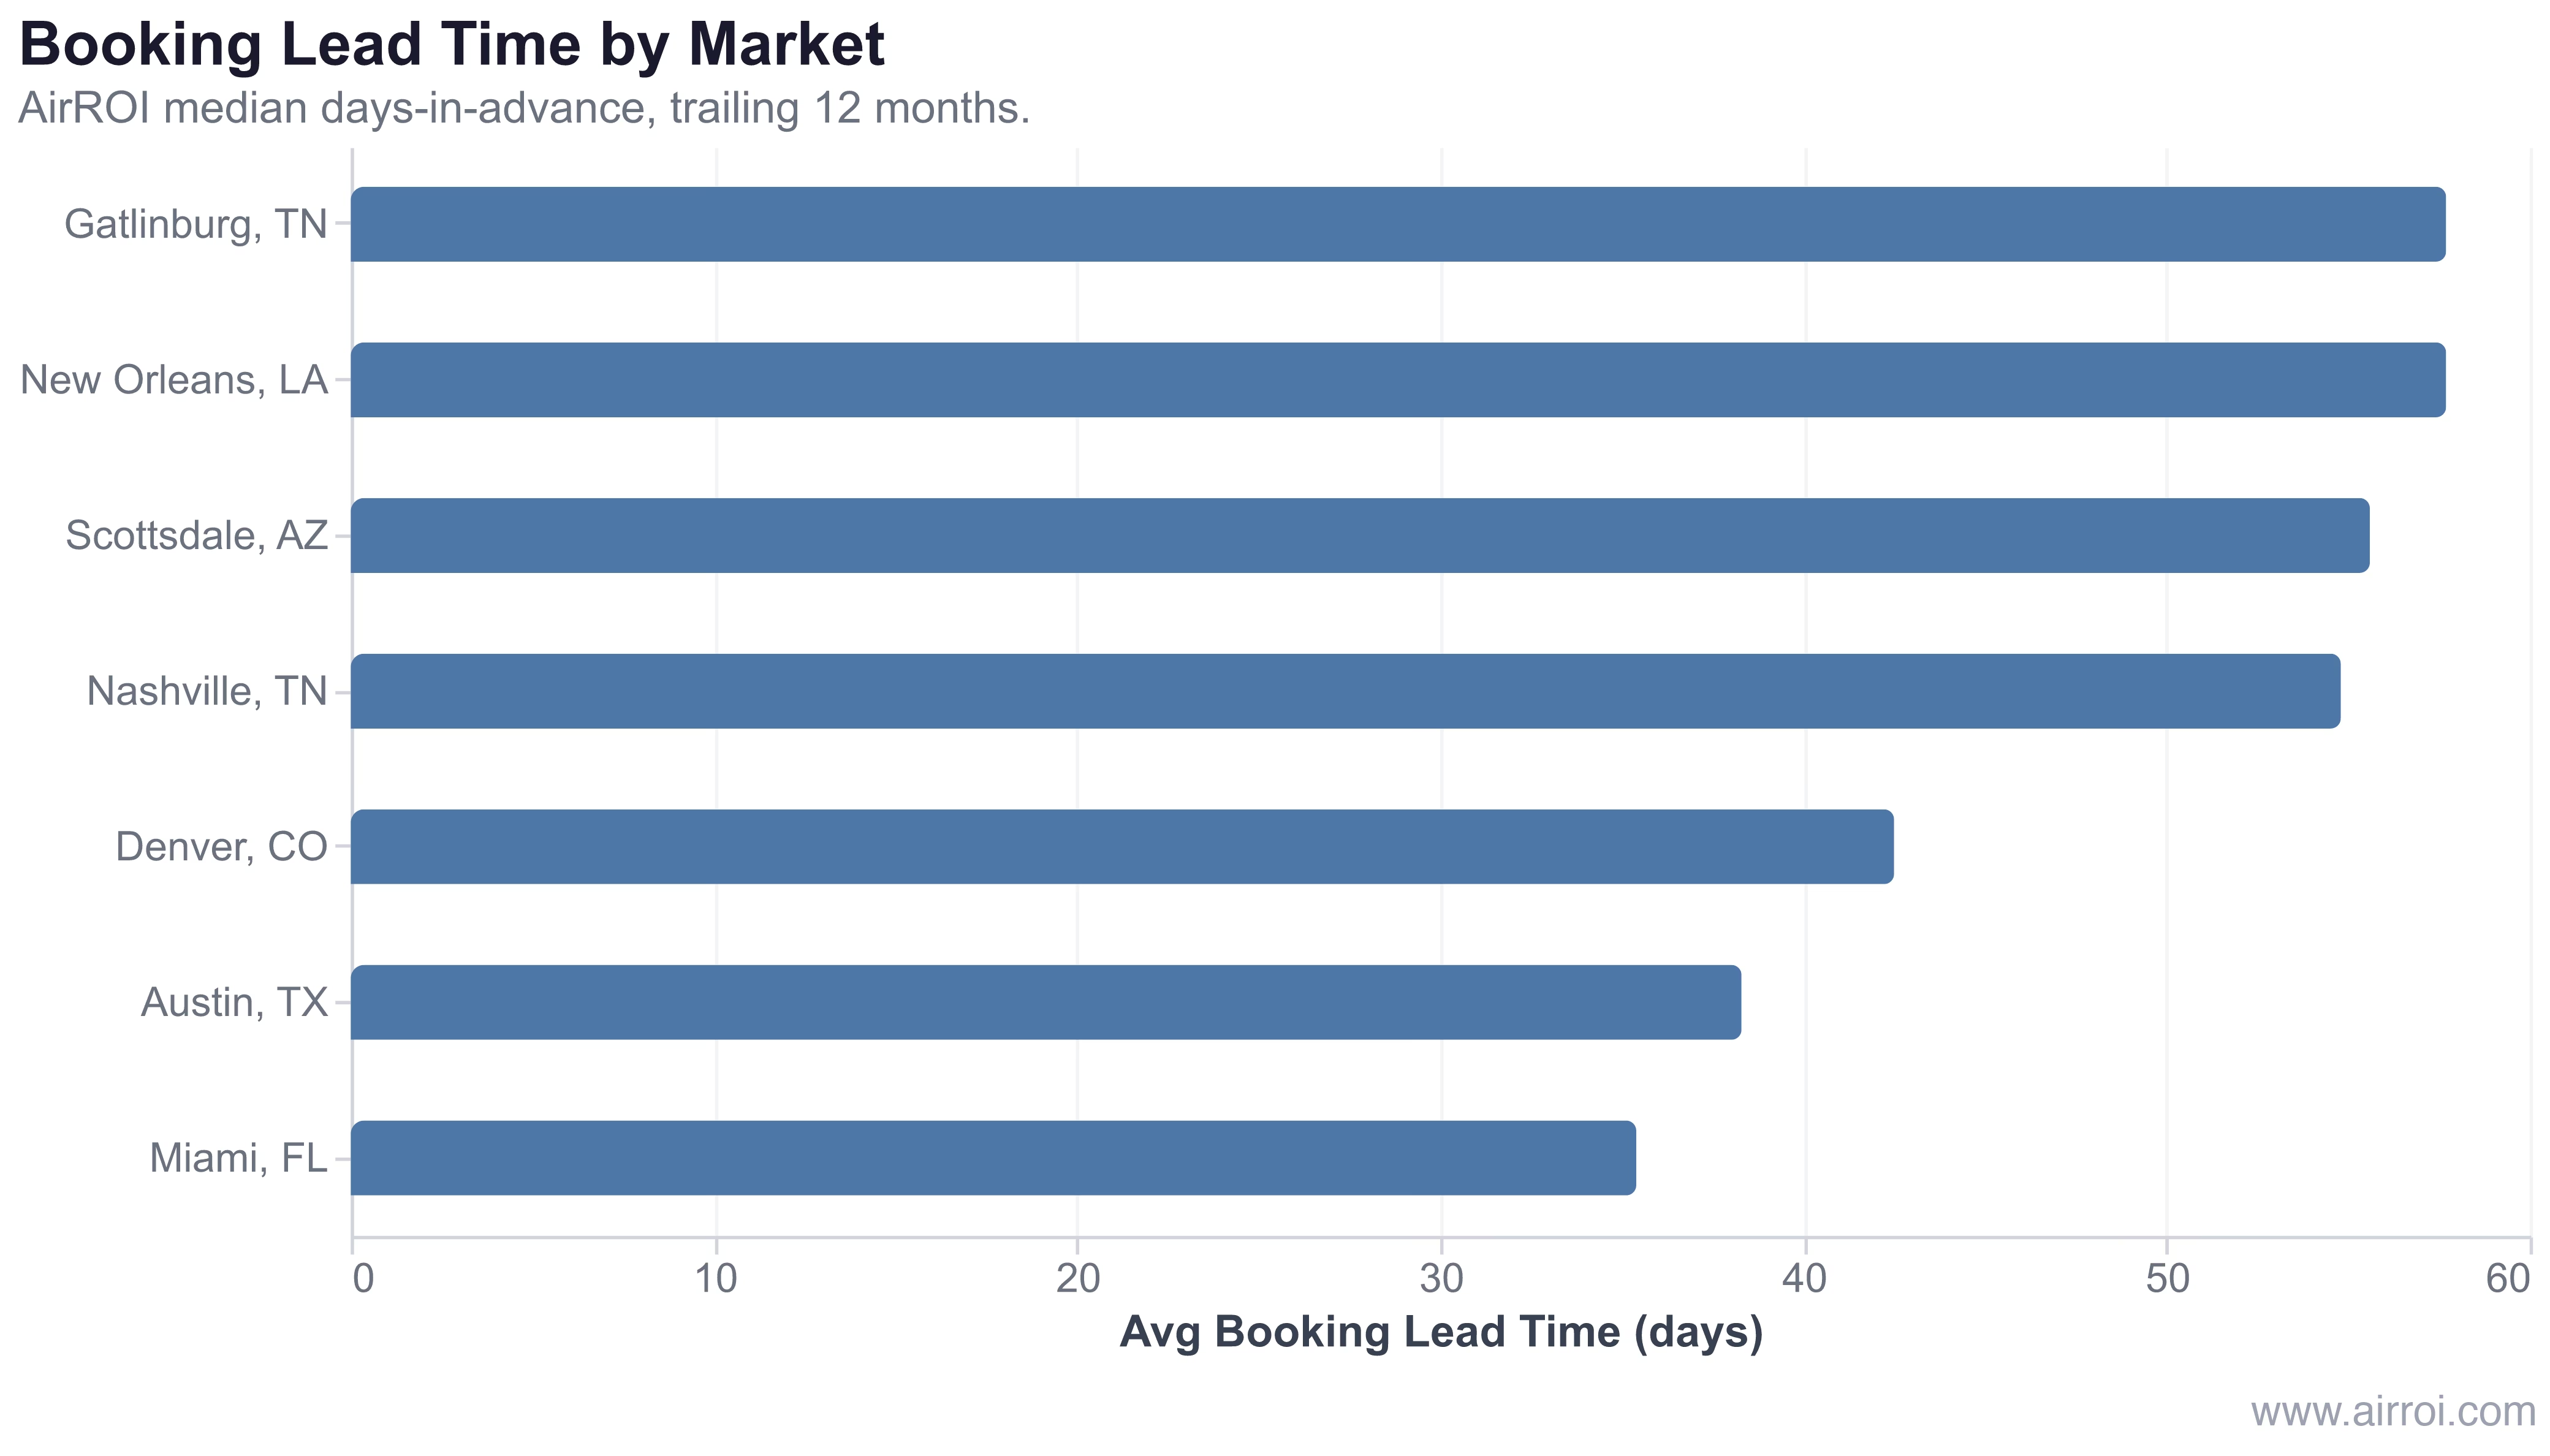
In AirROI's analysis of 39,522 active listings across seven US markets, booking lead time ranges from 35 days in Miami to 57.7 days in Gatlinburg — a 65% spread that fundamentally changes how pace should be read and acted on:
| Market | Avg Lead Time | Lead-Time Profile |
|---|---|---|
| Gatlinburg, TN | 57.7 days | Long-horizon vacationer |
| New Orleans, LA | 57.7 days | Event-driven planner |
| Scottsdale, AZ | 55.6 days | Seasonal snowbird |
| Nashville, TN | 54.8 days | Mixed leisure/events |
| Denver, CO | 42.5 days | Moderate planner |
| Austin, TX | 38.3 days | Short-to-medium horizon |
| Miami, FL | 35.4 days | Last-minute beach/urban |
A 10-day-behind pace in Gatlinburg at 90 days out still leaves 47 days of booking window to recover — the same deficit in Miami at 30 days out means the date may go dark.
Booking Pace Patterns by Market Type
Different property types produce systematically different booking curves, which determines when and how aggressively to act on a pace signal:
| Market Type | Typical Booking Window | Pace Characteristics |
|---|---|---|
| Urban business | 1–3 weeks out | Late-booking; pace spikes in the final 10 days |
| Beach vacation | 2–6 months out | Early-booking; slow weeks 30–90 out are a warning |
| Ski resort | 1–4 months out | Event-driven holiday spikes dominate pace shape |
| Rural getaway | 2–8 weeks out | Weekend pace healthy; weekday pace chronically lags |
| Event-driven | Varies by calendar | Sharp pace spikes follow announced events by 24–48 hours |
Why Booking Pace Matters for Pricing
Booking pace is valuable because it enables revenue action while the window is still open:
- Early warning system: A decelerating pace at 60 days out shows up in occupancy data only after the dates pass. Pace gives you four to six weeks to respond.
- Pricing confidence: When pace is 10%+ ahead of benchmark, you have data-backed evidence to raise rates rather than capitulating to empty-calendar anxiety.
- Market intelligence: Comparing your listing's pace against market-wide pace (available via a market dashboard) reveals whether a slowdown is listing-specific — solvable with photos, description, or price — or market-wide, which demands a different response.
- Seasonal calibration: Slow pace in January may be entirely normal for a beach property; the same reading in June signals a real problem. Pace only means something relative to the historical baseline for that specific month and property type.
How to Use Booking Pace for Pricing Decisions
- Establish your baseline by tracking booking pace for 3–6 months to map your property's typical booking curve for each season.
- Measure weekly — check every Monday what percentage of each forward month is booked and compare to the same date last year.
- Raise rates when ahead — if pace is 10%+ ahead of your historical benchmark, increase rates on remaining open dates; strong demand absorbs it.
- Lower rates when behind — trailing pace with fewer than 30 days to arrival warrants targeted discounts; trailing at 60+ days usually warrants patience and a smaller adjustment.
- Factor in seasonality — weight the benchmark to the same calendar month, not the same calendar week, to account for holiday shift.
- Watch the market level — if the entire market's pace is behind, systemic factors are at play. Across-the-board aggressive discounting in a soft market erodes ADR for everyone without recovering occupancy.
Frequently Asked Questions
A good booking pace depends on your market and how far in advance you are looking. Generally, having 50–70% of nights booked 30 days out is healthy for most markets. Pace is only meaningful when compared against the same period in prior years and against your comp set, not in absolute terms.
Track the percentage of available nights booked for a future date range at a specific point in time. If 15 of 30 nights are reserved for next month as of today, your 30-day forward booking pace is 50%. Repeat this measurement weekly to detect whether pace is accelerating or decelerating.
When pace is running ahead of your historical average, demand is strong — hold or raise rates on remaining open dates. When pace is trailing by 10% or more with fewer than 30 days to go, targeted discounts recover more revenue than leaving dates open at full price.
AirROI data shows Gatlinburg, TN and New Orleans, LA lead at 57.7 days, followed by Scottsdale, AZ (55.6 days) and Nashville, TN (54.8 days). Urban markets like Miami (35.4 days) and Austin (38.3 days) see much shorter lead times, reflecting last-minute booking behavior common in business-travel and urban leisure markets.
Booking lead time is the average number of days between when a reservation is made and the check-in date — a single summary number. Booking pace is the dynamic rate at which reservations accumulate over time for a specific future period. Both measure forward demand, but pace reveals the trajectory (accelerating or decelerating), while lead time measures the typical planning horizon.