
Demand
Key Takeaways
- STR demand equals total booked nights across all listings in a market during a given period
- Occupancy rate — booked nights divided by available nights — is the most practical real-time demand proxy
- Strong demand relative to supply drives higher ADR and occupancy rates; when supply grows faster, both compress
- Seasonality is the single largest factor creating demand swings in leisure markets; business and event travel moderate the cycle
- Booking pace — the rate at which future dates fill — is a leading indicator of demand strength 30-90 days out
How Demand Is Measured
| Metric | Definition | Use Case |
|---|---|---|
| Booked nights | Total occupied nights across all active listings | Primary demand volume measurement |
| Occupancy rate | Booked nights ÷ available nights | Demand relative to existing supply |
| Booking pace | Rate at which future calendar dates get reserved | Forward-looking demand signal |
| Search volume | Platform query volume for a destination | Early, upstream demand indicator |
| RevPAR trend | Revenue per available room over time | Demand × pricing power combined |
Example: A market with 1,000 active listings averaging 20 booked nights per month is generating 20,000 room nights of monthly demand. If 200 new listings enter the market next quarter with the same 20,000 demand, occupancy falls 17% — no change in traveler interest, just a supply-side shift.
Key Demand Drivers
Understanding what moves demand helps hosts price ahead of shifts rather than react to them after the fact:
- Seasonal tourism: Beach destinations peak in summer; ski and mountain resorts peak in winter. The seasonality index quantifies how severely each market swings.
- Events and conferences: A major music festival or convention can double or triple nightly rates for nearby listings over a single weekend. In AirROI's data, Nashville's 54.8-day median lead time reflects how far in advance event demand books.
- Business travel: Urban markets near corporate hubs sustain weekday demand that insulates occupancy from leisure-market seasonality.
- Remote work migration: The rise of digital nomads has created sustained mid-week demand in previously weekend-only resort markets, extending effective peak seasons in destinations like Scottsdale and Gatlinburg.
- Supply-side changes: New regulation that removes listings from a market can increase demand absorption for remaining hosts even with flat visitor volume — a dynamic AirROI documented in New York City after Local Law 18 took effect in September 2023, where active short-stay listings fell roughly 90% while remaining hosts captured concentrated demand.
STR Occupancy by Market — Demand Absorbed
Occupancy rate is the most transparent gauge of how efficiently market-level demand is being absorbed by available supply. In AirROI's analysis of approximately 44,808 active listings across seven US markets, trailing-12-month occupancy varies from 44% to 55%:
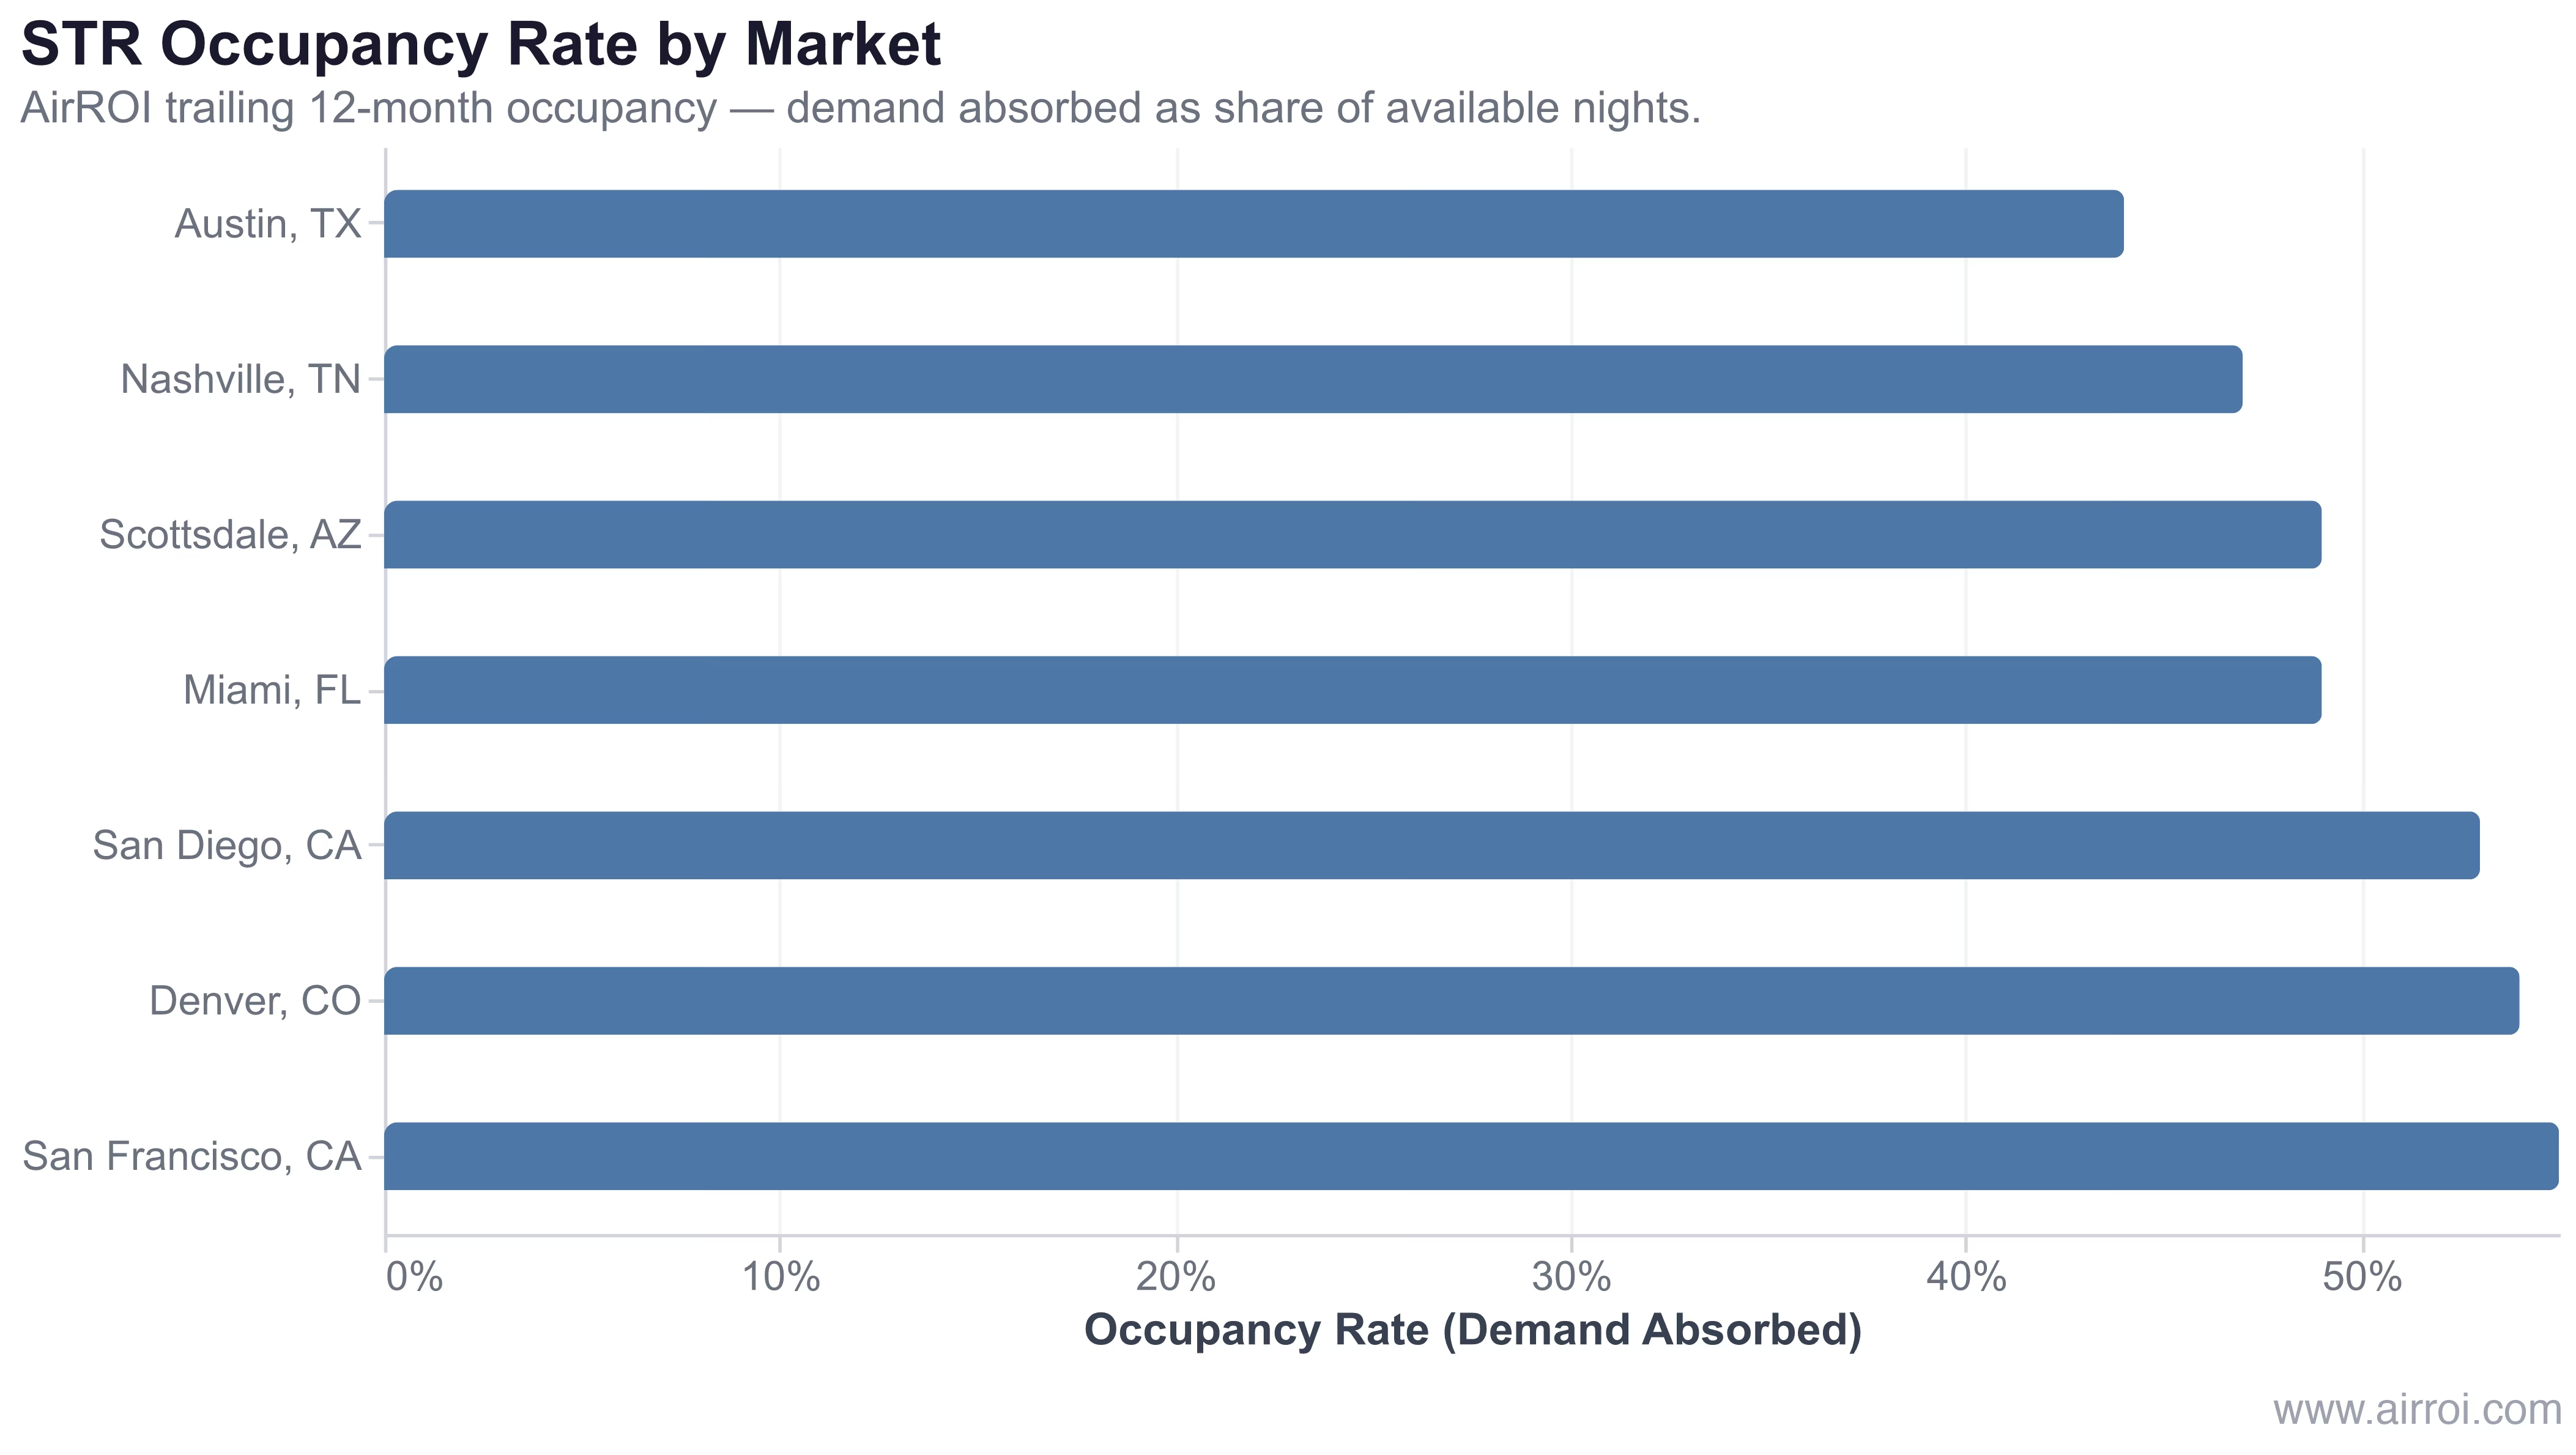
In AirROI's analysis of approximately 44,808 active listings across San Francisco, Denver, San Diego, Nashville, Scottsdale, Miami, and Austin, San Francisco leads at 55% occupancy — but that figure also reflects a constrained supply side from heavy regulation. Denver's 54% and San Diego's 53% represent more balanced demand-supply environments. Austin's 44% occupancy, the lowest in the group, reflects years of rapid new listing supply outpacing leisure travel growth rather than weak visitor interest in the city.
Occupancy tells you how much of available supply demand is filling — but it cannot tell you whether the ceiling is low because travelers aren't coming or because supply has grown beyond what current demand can absorb. That distinction shapes every pricing and investment decision.
Why Demand Matters for Airbnb Hosts
Demand trends ripple through every operational and financial decision:
- Revenue forecasting: Pairing demand trends with supply data allows accurate projection of future RevPAR. According to AirROI's 2026 market analysis, markets where demand growth exceeds supply growth by more than 5 percentage points annually show RevPAR expansion even when ADR stays flat.
- Pricing decisions: High-demand periods justify premium pricing — Scottsdale's $421 ADR holds precisely because the 49% occupancy reflects steady, pre-committed demand. Low-demand periods require either rate adjustments, promotional minimum-stay incentives, or length-of-stay targeting.
- Investment screening: Markets with strengthening demand and stable supply offer the best revenue growth trajectory. Markets experiencing the reverse — including several gateway cities during 2022–2025 — rewarded patience over speed of entry.
- Operational planning: Demand concentration (weekends, events, peak season) informs cleaning staffing, linen turnover scheduling, and maintenance windows.
Demand Trend Benchmarks
| Annual Demand Growth | Market Condition | Implication |
|---|---|---|
| 10%+ | Strong growth | Favorable for hosts; entry pricing and expansion both justified |
| 5–10% | Healthy growth | Solid fundamentals; watch supply pipeline for compression risk |
| 0–5% | Stable | Demand-supply balance; differentiation and quality drive share |
| Negative | Declining | Risk of market saturation; focus on cost discipline and guest loyalty |
How to Monitor and Respond to Demand Shifts
Tracking demand is a forward discipline: the goal is to be positioned before the shift, not explaining it after:
- Track booking pace weekly — a slowdown in pace for dates 30-60 days out is an early signal to sharpen pricing or loosen minimum-stay requirements before occupancy actually drops
- Monitor local event calendars — price adjustments for known demand spikes should be loaded 60-90 days in advance, not the week before
- Compare demand growth against supply growth — occupancy can hold flat even as demand rises if supply is growing in parallel; the ratio is what matters, not the absolute volume
- Analyze demand by day of week — markets with business travel show Monday–Thursday strength; targeting this segment with mid-week minimums captures demand that leisure-only pricing misses
- Use market-level data tools — platforms like AirROI's guest analytics dashboard surface booking-pace, lead time, and length-of-stay trends across your specific submarket
Frequently Asked Questions
STR demand is measured by the total number of booked nights across all listings in a market over a given period. Occupancy rate — booked nights divided by available nights — is the most accessible proxy. Booking pace trends and platform search volume serve as leading indicators of where demand is heading.
Key demand drivers include seasonal tourism patterns, local events and conferences, business travel, remote-work migration, economic conditions, and airline route expansion. Markets with a diverse demand mix — leisure, corporate, and event travel — hold occupancy more steadily through the year than single-driver destinations.
In AirROI's trailing-12-month data, San Francisco leads at 55% occupancy, followed by Denver at 54% and San Diego at 53%. Resort and event markets like Nashville, Scottsdale, and Miami cluster around 47-49%. Austin trails the group at 44%, reflecting ongoing supply growth outpacing leisure demand.
You cannot move market-level demand, but you can capture a larger share of it by optimizing your listing title and photos, maintaining a 4.8+ review rating, enabling Instant Book, and pricing competitively. Targeting underserved guest segments — mid-week corporate stays, pet-friendly travelers, longer-stay remote workers — also shifts your exposure toward higher-demand pockets.
When demand grows faster than supply, occupancy and ADR both rise, compounding revenue gains. When supply expands faster than demand — as happened in Austin from 2022–2025 — occupancy falls and pricing power erodes even if total visitor volume is increasing. Tracking demand and supply together, not in isolation, is what separates strategic hosts from reactive ones.