
Submarket
A submarket is a neighborhood-level segment within a larger short-term rental market that shares distinct occupancy, pricing, and demand characteristics. Defined by geographic boundaries, property types, and guest demographics, a submarket behaves differently from the metro it sits inside — and from adjacent submarkets — because it attracts a different guest profile, faces different competitive pressure, and responds to seasonality on its own schedule. City-level averages blend these differences away; submarket analysis preserves them.
Key Takeaways
- A submarket is a neighborhood or district where listings share correlated occupancy, ADR, and RevPAR patterns distinct from the broader market
- City-level averages can mask 30–50% performance differences between adjacent submarkets
- Your comp set should be drawn from your submarket — not from the broader metro — or benchmarks become misleading
- Supply growth, demand drivers, and seasonal curves all vary at the submarket level
- Submarket analysis is the minimum required precision for accurate investment underwriting and revenue forecasting
How Submarkets Are Defined
Submarkets emerge wherever a cluster of listings shares enough characteristics that its performance diverges consistently from neighboring clusters. The boundaries are typically geographic, but they may also track property type or regulatory zone.
| Dimension | Examples | Performance Impact |
|---|---|---|
| Geography | Neighborhood, zip code, waterfront zone | Proximity to attractions drives demand |
| Property type | Luxury homes, urban apartments, cabins | Different guest profiles and rate tiers |
| Guest segment | Business travelers, vacationers, groups | Booking windows and length of stay vary |
| Price tier | Budget, mid-range, premium | Competition dynamics differ by tier |
| Regulatory zone | STR-permitted vs. restricted areas | Supply constraints create pricing power |
No two beachfront submarkets are identical, and no downtown submarket behaves like the suburban fringe. The practical implication: a single "Nashville" figure is rarely actionable; "Lower Broadway Nashville" versus "East Nashville" are the actual units of analysis.
Submarket Performance Variation in Practice
The divergence between market segments is not subtle. Consider typical submarket archetypes within a single destination city:
| Submarket Type | Typical ADR | Occupancy | Primary Guest | Seasonality |
|---|---|---|---|---|
| Downtown core | $180–$280 | 70–80% | Business + tourism | Low variation |
| Beachfront | $200–$400 | 55–75% | Vacationers | High variation |
| Airport corridor | $90–$140 | 65–75% | Transit travelers | Low variation |
| University area | $100–$170 | 50–70% | Parents + events | Event-driven |
| Suburban family | $120–$200 | 45–65% | Families + groups | Moderate variation |
A host pricing a beachfront unit against city-wide ADR — which includes the airport corridor — is leaving revenue on the table. The host pricing a suburban family home against downtown comps is overpricing and losing occupancy. Neither error is visible without submarket data.
RevPAR Across Market Types
The same divergence that separates submarkets within a city also separates markets across geographies — and it shows just how wide the performance gap becomes once you slice at the right level.
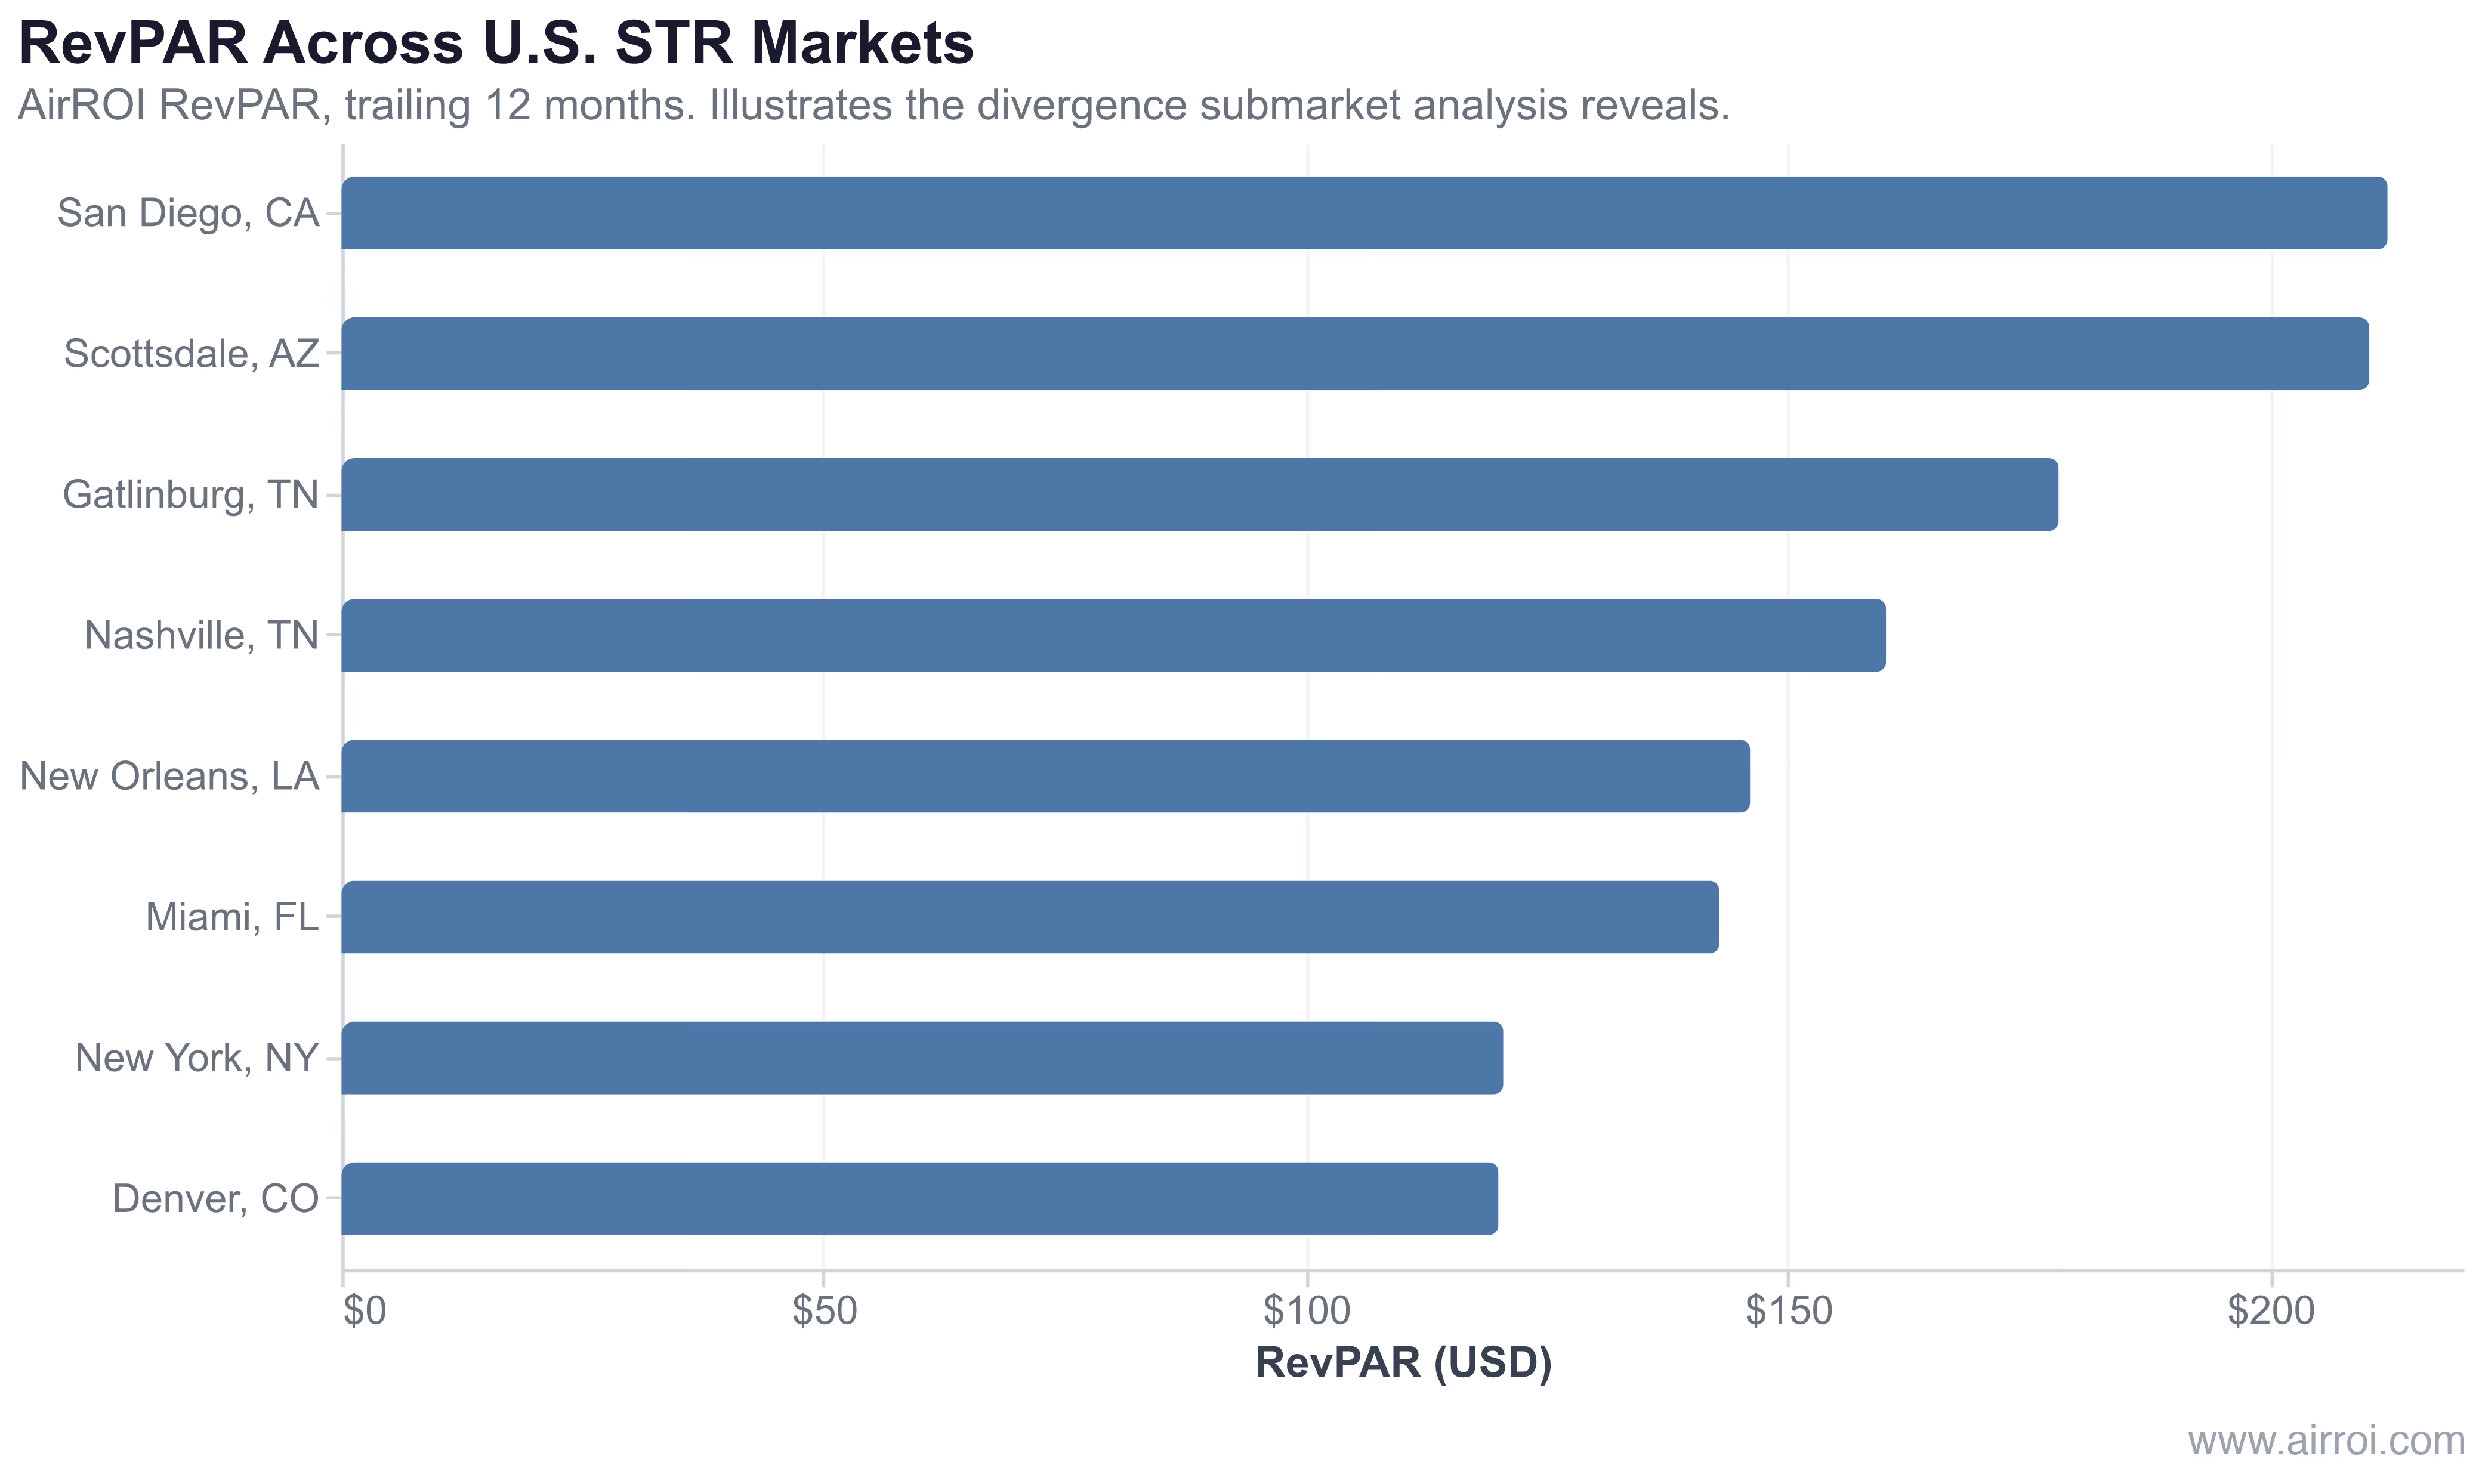
In AirROI's analysis of approximately 52,350 active listings across eight markets, trailing-12-month RevPAR spans from $120.0 (New York, heavily regulated; Denver, mid-market) to $212.2 (San Diego, coastal leisure demand). San Diego's beachfront submarkets push that figure even higher within the city — exactly the intra-market spread that city-level averages suppress. The same logic applies inside any metro: the number you see for "Nashville" is a weighted blend of Lower Broadway, East Nashville, and outlying bedroom communities, each operating at a different RevPAR.
Submarket analysis does not reveal a different truth about a market — it reveals the truth that city-level data is actively hiding.
Why Submarket Analysis Matters for Hosts and Investors
Accurate pricing. A downtown condo near the convention center and a suburban home 20 minutes away face entirely different demand curves. Pricing one against the other's data produces either lost revenue or chronic under-occupancy.
Regulatory divergence. Zoning overlays and permit caps often apply at the neighborhood level, not the city level. A city may permit STRs broadly while restricting them in the historic district or beachfront zone. Checking regulations at the submarket level — not just the city level — is essential before any acquisition.
How to Analyze Your Submarket
- Define your boundaries — identify the geographic area where your closest competitors operate using a market dashboard and map-based tools like AirROI Atlas
- Build a submarket comp set — benchmark against listings with similar property type, bedroom count, and price tier within your boundaries, not against city-wide averages
- Track submarket-specific trends — monitor supply growth, occupancy, and ADR trends in your submarket quarterly; a diverging trend is an early warning
- Compare across submarkets — use multi-submarket comparison to identify expansion opportunities; a second property one neighborhood over may face a completely different supply-demand balance
- Monitor the seasonality index for your specific submarket — peaks and troughs often shift by 2–4 weeks relative to the broader metro
Frequently Asked Questions
A submarket is defined by geographic boundaries (neighborhood, zip code, or district), shared demand characteristics (proximity to attractions, business districts, or beaches), and similar property profiles. Listings within a submarket tend to have correlated occupancy and pricing patterns that differ from the broader market.
City-level averages blend vastly different neighborhoods together, masking important variations. A beachfront submarket and an inland suburban submarket in the same city can have 30-50% differences in ADR and occupancy. Submarket data gives you the precision needed for accurate pricing and investment decisions.
Start with your geographic area (neighborhood or zip code), then look for clusters of listings with similar property types, pricing ranges, and guest demographics. Use a market analytics tool to compare performance across nearby areas and identify where natural performance boundaries exist.
Dramatically. AirROI data shows RevPAR ranging from $120 in heavily regulated metros like New York and Denver to $212 in high-demand markets like San Diego — and within a single city, beachfront or resort-adjacent submarkets routinely outperform inland areas by 40% or more on this measure.
Your comp set should be drawn from your specific submarket, not the broader city. A downtown high-rise and a suburban family home are in the same city but operate in entirely different competitive environments with different guest types, booking windows, and pricing ceilings. Mixing them produces misleading benchmarks.