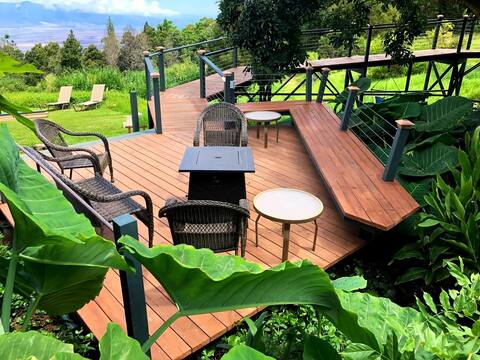
Kula, Hawaii Airbnb Market Data 2025: STR Report & Statistics
How much can you earn on Airbnb in Kula, Hawaii? Based on AirROI's 2025 dataset (May 2024 – April 2025), the short answer is $62,385 per year — at a $306 nightly rate, 55.8% occupancy, and a N/A RevPAR.
With just 19 active listings, Kula is a micro-market where solid booking activity throughout the year. Supply grew 26.7% year over year, and the market is recalibrating around a new competitive baseline. This is the stage where hosts who invest in amenities, guest experience, and dynamic pricing build durable advantages that compound as the market matures.
Regulation is high and 74% of listings show active registration — compliance is the cost of entry. In a market this size, differentiated listings with strong reviews can capture outsized returns relative to the competition.

Table of Contents [hide] [show]
What Are the Key Airbnb Metrics in Kula?
In Kula, the headline Airbnb metrics are $62,385 in average annual revenue,55.8% occupancy, $306 ADR, and $0 in RevPAR, and guests book about 114 days in advance.
How Much Do Airbnb Hosts Earn Monthly in Kula?
Understanding the monthly revenue variations for Airbnb listings in Kula is key to maximizing your short term rental income potential. Seasonality significantly impacts earnings. Our analysis, based on data from the past 12 months, shows that the peak revenue month for STRs in Kula is typically March, while July often presents the lowest earnings, highlighting opportunities for strategic pricing adjustments during shoulder and low seasons. Explore the typical Airbnb income in Kula across different performance tiers:
- Best-in-class properties (Top 10%) achieve $15,728+ monthly, often utilizing dynamic pricing and superior guest experiences.
- Strong performing properties (Top 25%) earn $8,545 or more, indicating effective management and desirable locations/amenities.
- Typical properties (Median) generate around $6,344 per month, representing the average market performance.
- Entry-level properties (Bottom 25%) see earnings around $4,530, often with potential for optimization.
Average Monthly Airbnb Earnings Trend in Kula
What Is the Monthly Airbnb Occupancy Rate in Kula?
Maximize your bookings by understanding the Kula STR occupancy trends. Seasonal demand shifts significantly influence how often properties are booked. Typically, Marchsees the highest demand (peak season occupancy), while July experiences the lowest (low season). Effective strategies, like adjusting minimum stays or offering promotions, can boost occupancy during slower periods. Here's how different property tiers perform in Kula:
- Best-in-class properties (Top 10%) achieve 93%+ occupancy, indicating high desirability and potentially optimized availability.
- Strong performing properties (Top 25%) maintain 91% or higher occupancy, suggesting good market fit and guest satisfaction.
- Typical properties (Median) have an occupancy rate around 81%.
- Entry-level properties (Bottom 25%) average 59% occupancy, potentially facing higher vacancy.
Average Monthly Occupancy Rate Trend in Kula
What Is the Average Airbnb Nightly Rate in Kula?
Effective short term rental pricing strategy in Kula involves understanding monthly ADR fluctuations. The Average Daily Rate (ADR) for Airbnb in Kula typically peaks in January and dips lowest during September. Leveraging Airbnb dynamic pricing tools or strategies based on this seasonality can significantly boost revenue. Here's a look at the typical nightly rates achieved:
- Best-in-class properties (Top 10%) command rates of $497+ per night, often due to premium features or locations.
- Strong performing properties (Top 25%) achieve nightly rates of $327 or more.
- Typical properties (Median) charge around $273 per night.
- Entry-level properties (Bottom 25%) earn around $145 per night.
Average Daily Rate (ADR) Trend by Month in Kula
What Is the RevPAR for Airbnb in Kula?
RevPAR in Kula is currently N/A. Because RevPAR combines nightly rates with realized occupancy, it is one of the cleanest ways to compare how efficiently listings turn demand into revenue across the market.
- Entry-level properties (Bottom 25%) see N/A RevPAR.
- Typical properties (Median) generate N/A RevPAR.
- Strong performers (Top 25%) earn N/A RevPAR.
- Best-in-class (Top 10%) achieve N/A RevPAR.
Average Monthly RevPAR Trend in Kula
RevPAR Insights for Kula
- RevPAR peaks in Jan and bottoms out in Jan, mirroring the broader seasonal demand pattern and suggesting opportunities for dynamic pricing.
Recommendations for Hosts
- Track your own RevPAR monthly against these Kula benchmarks. If your RevPAR falls below the median of N/A, examine whether low occupancy or low ADR is the primary drag.
- Use RevPAR rather than revenue alone when comparing properties of different sizes — it normalizes for available nights and gives a more accurate picture of performance.
Get Live Kula Market Intelligence 👇
Explore Real-time Analytics
When Is the Peak Season for Airbnb in Kula?
Kula's peak Airbnb season falls in March, January, February, while the softest stretch is May, June, July. Overall, the market shows highly seasonal trends requiring careful strategy, which should guide pricing, minimum stays, and cash-flow planning.
Peak Season (March, January, February)
- Revenue averages $15,365 per month
- Occupancy rates average 83.9%
- Daily rates average $419
Shoulder Season
- Revenue averages $8,751 per month
- Occupancy maintains around 73.4%
- Daily rates hold near $312
Low Season (May, June, July)
- Revenue drops to average $6,515 per month
- Occupancy decreases to average 66.6%
- Daily rates adjust to average $295
Seasonality Insights for Kula
- Airbnb seasonality in Kula is pronounced. Revenue swings sharply between peak and low months, which means pricing strategy, minimum-stay settings, and cash reserves all need to account for extended slower periods.
- During the high season, the absolute peak month showcases Kula's highest earning potential, with monthly revenues climbing to $16,055, occupancy reaching 92.1%, and ADRs peaking at $421.
- Conversely, the slowest single month marks the market's lowest point — revenue may dip to $5,897, occupancy could drop to 54.2%, and ADRs may adjust to $285.
- Understanding both the seasonal averages and these monthly peaks and troughs in revenue, occupancy, and ADR is crucial for maximizing your Airbnb profit potential in Kula.
Seasonal Strategies for Maximizing Profit
- Peak Season: Maximize revenue through premium pricing. In a high-regulation market like Kula, ensure your permit covers the number of nights you plan to book — some jurisdictions cap annual rental days.
- Low Season: Even in a market with solid annual occupancy, the slower months benefit from competitive pricing and flexible check-in/check-out windows. Target remote workers and extended-stay travelers who value value over peak-season amenities.
- Shoulder Seasons: Implement dynamic pricing that bridges peak and low rates. Target weekend travelers, local events, and business visitors. Slightly more flexible terms than peak season can help maintain occupancy without deep discounting.
- In a highly seasonal market like Kula, building a cash reserve during the top months is essential for covering fixed costs during the slow period. Automated pricing tools can help capture demand shifts in real time.
Do You Need a License for Airbnb in Kula?
Yes, Kula, Hawaii, United States enforces high STR regulations and 74% of active listings show registration evidence — indicating that enforcement is active and compliance is a prerequisite for operating legally. Hosts entering this market should budget for permit fees, inspections, and potential occupancy tax obligations as part of their startup costs. Always verify the latest short-term rental regulations and Airbnb license requirements directly with local government authorities for Kula to ensure full compliance before hosting.
(Source: AirROI data, 2026, based on 74% licensed listings)
What Are the Best Neighborhoods for Airbnb in Kula?
With a compact short-term rental market, Kula gives early-mover hosts an advantage in the right neighborhoods. The areas listed below are where guest demand and local attractions converge — a useful lens for investors evaluating whether to enter this market and where to position their listing.
| Neighborhood / Area | Why Host Here? (Target Guests & Appeal) | Key Attractions & Landmarks |
|---|---|---|
| Kula Lodge | A popular destination known for its breathtaking views, Kula Lodge is perfect for visitors looking for a peaceful retreat in nature. It attracts those who enjoy the cool climate and upcountry charm of Maui. | Kula Botanical Garden, Maui Ocean Center, Haleakalā National Park, Alii Kula Lavender Farm, Surfing Goat Dairy |
| Maui Upcountry | This region offers a unique blend of agriculture, scenic landscapes, and local culture. It's ideal for guests wanting to explore the genuine Hawaiian lifestyle, including farm tours and local eateries. | Kula Country Farms, Maui Wine, Scenic viewpoints, Local farmers markets, Historic Kula Town |
| Haleakalā National Park | Famous for its stunning sunrises and diverse ecosystems, this national park attracts outdoor enthusiasts and nature lovers. Perfect for those seeking adventure and breathtaking views. | Summit of Haleakalā, Hiking trails, Stargazing, Visitor Center, Craters and volcanic landscapes |
| Makawao | A charming paniolo (cowboy) town known for its art galleries and local crafts. It attracts visitors interested in Hawaiian culture and history, as well as shopping for handmade items. | Makawao Museum, Art galleries, Purdy's Natural Macadamia Nuts, Local cafes, Makawao Forest Reserve |
| Pukalani | A residential area with local golf courses and proximity to various attractions, Pukalani is suited for families and long-term stays, offering a quieter environment. | Pukalani Country Club, Surfing Goat Dairy, Local parks, Nearby hiking trails, Shopping facilities |
| Kula Marketplace | A convenient shopping and dining spot for locals and tourists alike, featuring local produce and artisanal goods. It's a great place for casual dining and shopping. | Kula Marketplace shops, Local food stalls, Community events, Artisan products, Scenic views |
| Ulupalakua | Known for its winery and stunning landscapes, Ulupalakua attracts visitors interested in wine tasting and exploring lush hills and historical sites. | Tedeschi Winery, Old Ulupalakua Ranch, Scenic drives, Historic sites, Local food vendors |
| Kula Sky Ranch | An adventurous destination offering activities like zip-lining and animal encounters, ideal for families and adventure seekers looking for unique experiences on the island. | Zipline tours, Animal encounters, Scenic views, Educational programs, Nature trails |
Because Kula has a high regulation profile, confirming that short-term rental permits are available in your target neighborhood is a critical first step before committing to a property purchase. Regulation can vary at the neighborhood or district level even within the same city.
What Types of Properties Are on Airbnb in Kula?
Room Type Distribution
Property Type Distribution
Market Composition Insights for Kula
- The Kula Airbnb market composition is heavily skewed towards Entire Home/Apt listings, which make up 89.5% of the 19 active rentals. This indicates strong guest preference for privacy and space.
- Looking at the property type distribution in Kula, House properties are the most common (47.4%), reflecting the local real estate landscape.
- Houses represent a significant 47.4% portion, catering likely to families or larger groups.
- The presence of 5.3% Hotel/Boutique listings indicates integration with traditional hospitality.
Kula Airbnb Room Capacity Analysis (2026): Bedroom Distribution
Distribution of Listings by Number of Bedrooms
Room Capacity Insights for Kula
- The dominant room capacity in Kula is 1 bedroom listings, making up 52.6% of the market. This suggests a strong demand for properties suitable for couples or solo travelers.
- Together, 1 bedroom and 2 bedrooms properties represent 73.7% of the active Airbnb listings in Kula, indicating a high concentration in these sizes.
- With over half the market (52.6%) consisting of studios or 1-bedroom units, Kula is particularly well-suited for individuals or couples.
Kula Vacation Rental Guest Capacity Trends (2026)
Distribution of Listings by Guest Capacity
Guest Capacity Insights for Kula
- The most common guest capacity trend in Kula vacation rentals is listings accommodating 2 guests (42.1%). This suggests the primary traveler segment is likely couples or solo travelers.
- Properties designed for 2 guests and 4 guests dominate the Kula STR market, accounting for 63.2% of listings.
- A significant 52.6% of listings cater specifically to 1-2 guests, highlighting strong demand from couples and solo travelers in Kula.
- 10.5% of properties accommodate 6+ guests, serving the market segment for larger families or group travel in Kula.
- On average, properties in Kula are equipped to host 2.7 guests.
What Amenities Do Airbnb Guests Expect in Kula?
Amenity Prevalence
Amenity Insights for Kula
- Essential amenities in Kula that guests expect include: Hot water, Free parking on premises. Lacking these (any) could significantly impact bookings.
- Popular amenities like Essentials, Wifi, Smoke alarm are common but not universal. Offering these can provide a competitive edge.
- Warning: Wifi is not universally provided but is considered essential globally. Ensure reliable Wifi is offered.
Recommendations for Hosts
- Ensure your listing includes all essential amenities for Kula: Hot water, Free parking on premises.
- Consider adding popular differentiators like Essentials or Wifi to increase appeal.
- Highlight unique or less common amenities you offer (e.g., hot tub, dedicated workspace, EV charger) in your listing description and photos.
- Regularly check competitor amenities in Kula to stay competitive.
Dive Deeper: Advanced Kula STR Market Data (2026)
Ready to unlock more insights? AirROI provides access to advanced metrics and comprehensive Airbnb data for Kula. Explore detailed analytics beyond this report to refine your investment strategy, optimize pricing, and maximize your vacation rental profits.
Explore Advanced MetricsKula Airbnb Guest Demographics & Profile Analysis (2026)
Guest Profile Summary for Kula
- The typical guest profile for Airbnb in Kula consists of primarily domestic travelers (90%), often arriving from nearby Seattle, typically belonging to the Post-2000s (Gen Z/Alpha) group (50%), primarily speaking English or Spanish.
- Domestic travelers account for 90.4% of guests.
- Key international markets include United States (90.4%) and Canada (2.3%).
- Top languages spoken are English (62.5%) followed by Spanish (12.2%).
- A significant demographic segment is the Post-2000s (Gen Z/Alpha) group, representing 50% of guests.
Recommendations for Hosts
- Target domestic marketing efforts towards travelers from Seattle and Honolulu.
- Tailor amenities and listing descriptions to appeal to the dominant Post-2000s (Gen Z/Alpha) demographic (e.g., highlight fast WiFi, smart home features, local guides).
- Highlight unique local experiences or amenities relevant to the primary guest profile.
- Consider seasonal promotions aligned with peak travel times for key origin markets.
Kula Airbnb Booking Patterns (2026): Available vs. Booked Days
Available Days Distribution
Booked Days Distribution
Booking Pattern Insights for Kula
- The most common availability pattern in Kula falls within the 271-366 days range, representing 36.8% of listings. This suggests many properties have significant open periods on their calendars.
- Approximately 36.8% of listings show high availability (181+ days open annually), indicating potential for increased bookings or specific owner usage patterns.
- For booked days, the 271-366 days range is most frequent in Kula (36.8%), reflecting common guest stay durations or potential owner blocking patterns.
- A notable 63.1% of properties secure long booking periods (181+ days booked per year), highlighting successful long-term rental strategies or significant owner usage.
How Far in Advance Do Guests Book Airbnb in Kula?
Average Booking Lead Time by Month
Booking Lead Time Insights for Kula
- The overall average booking lead time for vacation rentals in Kula is 114 days.
- Guests book furthest in advance for stays during February (average 198 days), likely coinciding with peak travel demand or local events.
- The shortest booking windows occur for stays in August (average 72 days), indicating more last-minute travel plans during this time.
- Seasonally, Winter (176 days avg.) sees the longest lead times, while Summer (86 days avg.) has the shortest, reflecting typical travel planning cycles.
Recommendations for Hosts
- Use the overall average lead time (114 days) as a baseline for your pricing and availability strategy in Kula.
- For February stays, consider implementing length-of-stay discounts or slightly higher rates for bookings made less than 198 days out to capitalize on advance planning.
- Target marketing efforts for the Winter season well in advance (at least 176 days) to capture early planners.
- Monitor your own booking lead times against these Kula averages to identify opportunities for dynamic pricing adjustments.
Kula Airbnb Minimum Stay Requirements Analysis
Distribution of Listings by Minimum Night Requirement
1 Night
5 listings
31.3% of total
2 Nights
3 listings
18.8% of total
3 Nights
3 listings
18.8% of total
4-6 Nights
2 listings
12.5% of total
30+ Nights
3 listings
18.8% of total
Key Insights
- The most prevalent minimum stay requirement in Kula is 1 Night, adopted by 31.3% of listings. This highlights the market's preference for shorter, flexible bookings.
- A significant segment (18.8%) caters to monthly stays (30+ nights) in Kula, pointing to opportunities in the extended-stay market.
Recommendations
- Align with the market by considering a 1 Night minimum stay, as 31.3% of Kula hosts use this setting.
- Explore offering discounts for stays of 30+ nights to attract the 18.8% of the market seeking extended stays.
- Adjust minimum nights based on seasonality – potentially shorter during low season and longer during peak demand periods in Kula.
Kula Airbnb Cancellation Policy Trends Analysis (2026)
Super Strict 30 Days
1 listings
7.1% of total
Moderate
4 listings
28.6% of total
Firm
2 listings
14.3% of total
Strict
7 listings
50% of total
Cancellation Policy Insights for Kula
- The prevailing Airbnb cancellation policy trend in Kula is Strict, used by 50% of listings.
- A majority (64.3%) of hosts in Kula utilize Firm or Strict policies, indicating a market where hosts prioritize booking security.
Recommendations for Hosts
- Consider adopting a Strict policy to align with the 50% market standard in Kula.
- With 50% using Strict terms, this is a viable option in Kula, particularly for high-value properties or during peak demand periods.
- Regularly review your cancellation policy against competitors and market demand shifts in Kula.
What Do the Top Airbnb Listings in Kula Look Like?
Benchmark your potential! Explore examples of top-performing Airbnb properties in Kulabased on Trailing Twelve Month (TTM) revenue. Analyze their characteristics, revenue, occupancy rate, and ADR to understand what drives success in this market.

Hike on Scenic Trails at a Luxury Home on 7 Acres
Entire Place • 2 bedrooms
Malu Manu
Entire Place • N/A
HALEKALANI - Paradise in Upcountry
Entire Place • 2 bedrooms
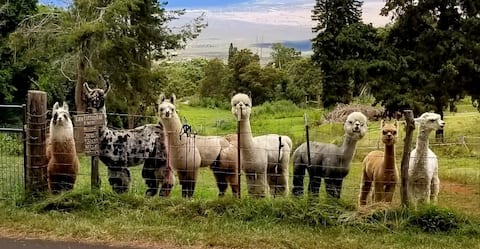
Upcountry Alpaca, Llama, and Rabbit working farm
Entire Place • 1 bedroom
Oceanview Cottage away from heat! w/ County Permit
Entire Place • 2 bedrooms
Kula Jacaranda Studio on the Slopes of Haleakala
Entire Place • 1 bedroom
Note: Performance varies based on location, size, amenities, seasonality, and management quality. Data reflects the past 12 months.
Who Are the Top Airbnb Hosts in Kula?
Learn from the best! This table showcases top-performing Airbnb hosts in Kula based on the number of properties managed and estimated total revenue over the past year. Analyze their scale and performance metrics.
| Host Name | Properties | Grossing Revenue | Stay Reviews | Avg Rating |
|---|---|---|---|---|
| Angie & Keith | 1 | $278,698 | 61 | 5.00/5.0 |
| Jill | 2 | $149,402 | 713 | 5.00/5.0 |
| Steve & Diane | 2 | $144,373 | 440 | 4.97/5.0 |
| Malu | 1 | $106,366 | 256 | 4.98/5.0 |
| Jeff | 1 | $93,223 | 347 | 4.96/5.0 |
| Christine | 1 | $91,005 | 197 | 4.98/5.0 |
| Mei & Iris | 1 | $90,677 | 342 | 4.95/5.0 |
| Marianne | 1 | $68,103 | 51 | 5.00/5.0 |
| Pamela | 2 | $50,073 | 1327 | 4.91/5.0 |
| Emma | 1 | $25,398 | 14 | 4.57/5.0 |
Analyzing the strategies of top hosts, such as their property selection, pricing, and guest communication, can offer valuable lessons for optimizing your own Airbnb operations in Kula.
How Does Kula's Airbnb Market Compare to Nearby Cities?
How does the Kula Airbnb market stack up against its neighbors? Compare key performance metrics like average monthly revenue, ADR, and occupancy rates in surrounding areas to understand the broader regional STR landscape.
Compared with Kahuku, Kula has 8 percentage points lower occupancy and about $299 lower ADR. That helps frame whether this market is winning more on demand, pricing, or both.
| Market | Active Properties | Monthly Revenue | Daily Rate | Avg. Occupancy |
|---|---|---|---|---|
| Nīnole | 10 | $12,313 | $1178.92 | 52% |
| Kahuku | 277 | $10,460 | $604.67 | 64% |
| Waimea | 371 | $8,073 | $721.21 | 44% |
| Honalo | 21 | $7,796 | $421.64 | 62% |
| Hana | 71 | $7,446 | $406.62 | 64% |
| Puakō | 65 | $7,443 | $664.53 | 47% |
| Paia | 83 | $6,996 | $502.22 | 55% |
| Waikoloa Beach Resort | 25 | $6,884 | $496.21 | 51% |
| Kapalua | 315 | $6,775 | $692.39 | 39% |
| Makawao | 22 | $6,087 | $393.87 | 51% |
Frequently Asked Questions About Airbnb in Kula
These quick answers summarize the most common investor and operator questions using AirROI's latest market data for Kula.
How much do Airbnb hosts make in Kula?
Kula hosts earn about $62,385 per year on average, with an average nightly rate of $306 and RevPAR of N/A. Those figures describe the typical revenue environment for active listings in Kula, Hawaii, not the ceiling for the best operators. Source: AirROI 2025 data, Kula market, May 2024 to April 2025.
What is the average Airbnb occupancy rate in Kula?
The average Airbnb occupancy rate in Kula is 55.8%. March is the strongest month and July is the softest, so hosts should expect demand to move meaningfully throughout the year rather than stay flat.
What is the average Airbnb daily rate in Kula?
Listings in Kula average $306 per night. The broader pricing spread also matters: lower-performing listings cluster closer to the lower quartiles, while premium homes can price materially above the city average when demand spikes or listing quality stands out.
How many Airbnb listings are active in Kula?
Kula currently has about 19 active Airbnb listings in AirROI's market dataset. That supply count helps explain how competitive the market is, how much depth there is for benchmarking, and whether the market behaves like a niche destination or a scaled urban market.
How strict are short-term rental regulations in Kula?
AirROI currently classifies the short-term rental regulation level in Kula as High. The dataset also shows about 73.7% of listings with registration evidence. That is a market signal, not legal advice, so hosts should still confirm current licensing and compliance rules locally before listing.
What is the RevPAR for Airbnb in Kula?
RevPAR in Kula is about N/A. That metric combines pricing and occupancy into one efficiency number, so it is often a better quick benchmark than ADR alone when investors want to compare how well listings convert nightly rates into realized revenue.
Is Airbnb profitable in Kula?
At 55.8% occupancy, Kula can be profitable — but margins depend heavily on operating costs, property acquisition price, and how well hosts optimize pricing across seasons. Average annual revenue is $62,385, but individual returns depend on property type, location within the city, and the host's operating efficiency.
How far in advance do guests book Airbnb in Kula?
The average booking lead time in Kula is about 114 days — a longer planning horizon typical of destination or vacation markets where travelers book well in advance. Hosts who understand their market's booking cadence can adjust minimum stays and pricing windows accordingly.
What are the best neighborhoods for Airbnb in Kula?
Based on AirROI's analysis, some of the top neighborhoods for short-term rentals in Kula include Kula Lodge, Maui Upcountry, Haleakalā National Park. Each area attracts different guest profiles — from business travelers to leisure visitors — so the best location depends on the property type and target audience a host is aiming for. See the full neighborhood breakdown above.
What type of property performs best on Airbnb in Kula?
entire_home listings make up 89.5% of the active supply in Kula. The most common configuration does not always mean the most profitable — operators who identify underserved property types or bedroom counts can sometimes outperform the market average by filling a gap in local supply.
How does Kula compare to nearby Airbnb markets?
Among neighboring markets, Nīnole posts $147,753 in average annual revenue with 52.1% occupancy, compared to Kula's $62,385 and 55.8%. Comparing nearby markets helps investors understand whether a destination's performance reflects local demand or broader regional trends.
When is the peak season for Airbnb in Kula?
March is the highest-revenue month in Kula, while July is the softest. The revenue spread between them indicates a highly seasonal market — revenue in the peak month is more than double the low month, so cash-flow planning and pricing automation are critical.
About AirROI Market Data
AirROI tracks over 20 million properties across 190+ countries and maintains 15+ years of historical performance data, making it one of the deepest Airbnb and STR intelligence platforms available. The analytics pipeline aggregates listing-level data monthly — revenue, occupancy, nightly rates, RevPAR, guest demographics, booking patterns, and competitive supply — so investors and operators can benchmark any market against its own history and against neighboring destinations.
Real estate investors, property managers, financial institutions, hedge funds, tourism boards, hospitality consultants, tech platforms, and academic researchers rely on AirROI data to underwrite acquisitions, optimize pricing, model macro trends, and conduct peer-reviewed research. Data is available through in-depth market reports like this one and the Airbnb API with 22 endpoints and an Airbnb MCP Server for AI agents.
AirROI proprietary analytics as of 2025-04-30. Metrics reflect trailing twelve-month aggregates from active listings. Revenue figures are market averages, not projections. Neighborhood descriptions are AI-generated and reviewed for accuracy. For full methodology, see the data methodology page.