Borenore, New South Wales Airbnb Market Data 2025: STR Report & Statistics
How much can you earn on Airbnb in Borenore, New South Wales? Based on AirROI's 2025 dataset (May 2024 – April 2025), the short answer is $22,177 per year — at a $201 nightly rate, 37.6% occupancy, and a N/A RevPAR.
With just 16 active listings, Borenore is a micro-market where moderate demand with room for well-positioned listings to outperform. Supply grew 14.3% and nightly rates have risen, creating an environment where the most bookable listings stand to capture outsized share. Hosts who pair competitive pricing with strong guest experience are well-positioned to convert the growing traveler base into consistent bookings.
Regulation is high and 94% of listings show active registration — compliance is the cost of entry. In a market this size, differentiated listings with strong reviews can capture outsized returns relative to the competition.

Table of Contents [hide] [show]
What Are the Key Airbnb Metrics in Borenore?
In Borenore, the headline Airbnb metrics are $22,177 in average annual revenue,37.6% occupancy, $201 ADR, and $0 in RevPAR, and guests book about 50 days in advance.
How Much Do Airbnb Hosts Earn Monthly in Borenore?
Understanding the monthly revenue variations for Airbnb listings in Borenore is key to maximizing your short term rental income potential. Seasonality significantly impacts earnings. Our analysis, based on data from the past 12 months, shows that the peak revenue month for STRs in Borenore is typically April, while February often presents the lowest earnings, highlighting opportunities for strategic pricing adjustments during shoulder and low seasons. Explore the typical Airbnb income in Borenore across different performance tiers:
- Best-in-class properties (Top 10%) achieve $4,517+ monthly, often utilizing dynamic pricing and superior guest experiences.
- Strong performing properties (Top 25%) earn $3,032 or more, indicating effective management and desirable locations/amenities.
- Typical properties (Median) generate around $1,861 per month, representing the average market performance.
- Entry-level properties (Bottom 25%) see earnings around $1,046, often with potential for optimization.
Average Monthly Airbnb Earnings Trend in Borenore
What Is the Monthly Airbnb Occupancy Rate in Borenore?
Maximize your bookings by understanding the Borenore STR occupancy trends. Seasonal demand shifts significantly influence how often properties are booked. Typically, Aprilsees the highest demand (peak season occupancy), while May experiences the lowest (low season). Effective strategies, like adjusting minimum stays or offering promotions, can boost occupancy during slower periods. Here's how different property tiers perform in Borenore:
- Best-in-class properties (Top 10%) achieve 64%+ occupancy, indicating high desirability and potentially optimized availability.
- Strong performing properties (Top 25%) maintain 50% or higher occupancy, suggesting good market fit and guest satisfaction.
- Typical properties (Median) have an occupancy rate around 32%.
- Entry-level properties (Bottom 25%) average 19% occupancy, potentially facing higher vacancy.
Average Monthly Occupancy Rate Trend in Borenore
What Is the Average Airbnb Nightly Rate in Borenore?
Effective short term rental pricing strategy in Borenore involves understanding monthly ADR fluctuations. The Average Daily Rate (ADR) for Airbnb in Borenore typically peaks in October and dips lowest during February. Leveraging Airbnb dynamic pricing tools or strategies based on this seasonality can significantly boost revenue. Here's a look at the typical nightly rates achieved:
- Best-in-class properties (Top 10%) command rates of $356+ per night, often due to premium features or locations.
- Strong performing properties (Top 25%) achieve nightly rates of $258 or more.
- Typical properties (Median) charge around $197 per night.
- Entry-level properties (Bottom 25%) earn around $148 per night.
Average Daily Rate (ADR) Trend by Month in Borenore
What Is the RevPAR for Airbnb in Borenore?
RevPAR in Borenore is currently N/A. Because RevPAR combines nightly rates with realized occupancy, it is one of the cleanest ways to compare how efficiently listings turn demand into revenue across the market.
- Entry-level properties (Bottom 25%) see N/A RevPAR.
- Typical properties (Median) generate N/A RevPAR.
- Strong performers (Top 25%) earn N/A RevPAR.
- Best-in-class (Top 10%) achieve N/A RevPAR.
Average Monthly RevPAR Trend in Borenore
RevPAR Insights for Borenore
- RevPAR peaks in Jan and bottoms out in Jan, mirroring the broader seasonal demand pattern and suggesting opportunities for dynamic pricing.
Recommendations for Hosts
- Track your own RevPAR monthly against these Borenore benchmarks. If your RevPAR falls below the median of N/A, examine whether low occupancy or low ADR is the primary drag.
- Use RevPAR rather than revenue alone when comparing properties of different sizes — it normalizes for available nights and gives a more accurate picture of performance.
Get Live Borenore Market Intelligence 👇
Explore Real-time Analytics
When Is the Peak Season for Airbnb in Borenore?
Borenore's peak Airbnb season falls in April, July, October, while the softest stretch is February, May, June. Overall, the market shows highly seasonal trends requiring careful strategy, which should guide pricing, minimum stays, and cash-flow planning.
Peak Season (April, July, October)
- Revenue averages $3,181 per month
- Occupancy rates average 45.5%
- Daily rates average $232
Shoulder Season
- Revenue averages $2,538 per month
- Occupancy maintains around 37.0%
- Daily rates hold near $225
Low Season (February, May, June)
- Revenue drops to average $1,392 per month
- Occupancy decreases to average 26.7%
- Daily rates adjust to average $225
Seasonality Insights for Borenore
- Airbnb seasonality in Borenore is pronounced. Revenue swings sharply between peak and low months, which means pricing strategy, minimum-stay settings, and cash reserves all need to account for extended slower periods.
- During the high season, the absolute peak month showcases Borenore's highest earning potential, with monthly revenues climbing to $3,328, occupancy reaching 47.9%, and ADRs peaking at $247.
- Conversely, the slowest single month marks the market's lowest point — revenue may dip to $1,173, occupancy could drop to 24.0%, and ADRs may adjust to $201.
- Lower occupancy paired with meaningful seasonality means hosts in Borenore need to maximize every peak-season booking and seriously consider whether off-season pricing adjustments or minimum-stay changes can capture incremental revenue.
Seasonal Strategies for Maximizing Profit
- Peak Season: Maximize revenue through premium pricing. In a high-regulation market like Borenore, ensure your permit covers the number of nights you plan to book — some jurisdictions cap annual rental days.
- Low Season: Offer competitive pricing, extended-stay discounts, and flexible cancellation policies. Target off-season travelers like remote workers, budget-conscious guests, and travelers with flexible schedules.
- Shoulder Seasons: Implement dynamic pricing that bridges peak and low rates. Target weekend travelers, local events, and business visitors. Slightly more flexible terms than peak season can help maintain occupancy without deep discounting.
- In a highly seasonal market like Borenore, building a cash reserve during the top months is essential for covering fixed costs during the slow period. Automated pricing tools can help capture demand shifts in real time.
Do You Need a License for Airbnb in Borenore?
Yes, Borenore, New South Wales, Australia enforces high STR regulations and 94% of active listings show registration evidence — indicating that enforcement is active and compliance is a prerequisite for operating legally. Hosts entering this market should budget for permit fees, inspections, and potential occupancy tax obligations as part of their startup costs. Always verify the latest short-term rental regulations and Airbnb license requirements directly with local government authorities for Borenore to ensure full compliance before hosting.
(Source: AirROI data, 2026, based on 94% licensed listings)
What Are the Best Neighborhoods for Airbnb in Borenore?
With a compact short-term rental market, Borenore gives early-mover hosts an advantage in the right neighborhoods. The areas listed below are where guest demand and local attractions converge — a useful lens for investors evaluating whether to enter this market and where to position their listing.
| Neighborhood / Area | Why Host Here? (Target Guests & Appeal) | Key Attractions & Landmarks |
|---|---|---|
| Orange | A charming town known for its wine production and proximity to the stunning Orange Wine Region. Ideal for those who want to experience local vineyards and fine dining. | Rieboldt Wines, Borenore Wines, Lake Canobolas, Orange Botanic Gardens, Orange Farmers Market, Mount Canobolas |
| Cowra | Known for its beautiful gardens and rich history, Cowra attracts tourists interested in history and nature. | Cowra Japanese Garden, Cowra Prisoner of War Camps, Cowra Golf Club, Cowra Art Gallery, Lachlan Valley Railway, Mansfield Park |
| Bathurst | A historic city famous for its motor racing and heritage sites. Offers a mix of adventure and culture for visitors. | Mount Panorama, Australian Fossil and Mineral Museum, Bathurst Gaol, Bathurst Regional Art Gallery, Abercrombie Caves, Chifley Home |
| Mudgee | A popular regional town known for its wine and culinary scene. Attracts food and wine enthusiasts looking for a getaway. | Mudgee Wines, Mudgee Markets, Mudgee Honey Haven, Baker Williams Distillery, Mudgee Golf Club, The Artisanal Kitchen |
| Dubbo | Home to the famous Taronga Western Plains Zoo, Dubbo is a great location for families and wildlife enthusiasts. | Taronga Western Plains Zoo, Dubbo Observatory, Old Dubbo Gaol, Dubbo Regional Botanical Gardens, Western Plains Cultural Centre, Dubbo Markets |
| Parkes | Known for the iconic Dish and its rich agricultural area, Parkes combines technology with rural charm. | Parkes Observatory, Parkes Elvis Festival, Bushman's Hill Reserve, Parkes Railway Station, Parkes Cultural Centre, Parkes Historical Society Museum |
| Wellington | A peaceful town famous for its beautiful landscapes and the nearby Wellington Caves, perfect for nature lovers. | Wellington Caves, The Old Dubbo Gaol, Wellington Soldiers' Memorial, Wellington Golf Club, Wellington Wetlands, Borenore Caves |
| Clare Valley | Renowned for its wine and scenic river landscapes, a prime destination for wine tourism with numerous attractions. | Clare Valley Wine Regions, Clare Valley Heritage Centre, Paulett Wines, Sevenhill Cellars, Krondorf Road, Clare National Park |
Because Borenore has a high regulation profile, confirming that short-term rental permits are available in your target neighborhood is a critical first step before committing to a property purchase. Regulation can vary at the neighborhood or district level even within the same city.
What Types of Properties Are on Airbnb in Borenore?
Room Type Distribution
Property Type Distribution
Market Composition Insights for Borenore
- The Borenore Airbnb market composition is heavily skewed towards Entire Home/Apt listings, which make up 93.8% of the 16 active rentals. This indicates strong guest preference for privacy and space.
- Looking at the property type distribution in Borenore, House properties are the most common (75%), reflecting the local real estate landscape.
- Houses represent a significant 75% portion, catering likely to families or larger groups.
Borenore Airbnb Room Capacity Analysis (2026): Bedroom Distribution
Distribution of Listings by Number of Bedrooms
Room Capacity Insights for Borenore
- The dominant room capacity in Borenore is 2 bedrooms listings, making up 31.3% of the market. This suggests a strong demand for properties suitable for couples or solo travelers.
- Together, 2 bedrooms and 3 bedrooms properties represent 56.3% of the active Airbnb listings in Borenore, indicating a high concentration in these sizes.
- A significant 50.0% of listings offer 3+ bedrooms, catering to larger groups and families seeking more space in Borenore.
Borenore Vacation Rental Guest Capacity Trends (2026)
Distribution of Listings by Guest Capacity
Guest Capacity Insights for Borenore
- The most common guest capacity trend in Borenore vacation rentals is listings accommodating 8+ guests (37.5%). This suggests the primary traveler segment is likely larger groups.
- Properties designed for 8+ guests and 4 guests dominate the Borenore STR market, accounting for 68.8% of listings.
- 50.0% of properties accommodate 6+ guests, serving the market segment for larger families or group travel in Borenore.
- On average, properties in Borenore are equipped to host 5.3 guests.
What Amenities Do Airbnb Guests Expect in Borenore?
Amenity Prevalence
Amenity Insights for Borenore
- Essential amenities in Borenore that guests expect include: Smoke alarm, Free parking on premises, TV. Lacking these (any) could significantly impact bookings.
- Popular amenities like Air conditioning, Kitchen, Heating are common but not universal. Offering these can provide a competitive edge.
Recommendations for Hosts
- Ensure your listing includes all essential amenities for Borenore: Smoke alarm, Free parking on premises, TV.
- Consider adding popular differentiators like Air conditioning or Kitchen to increase appeal.
- Highlight unique or less common amenities you offer (e.g., hot tub, dedicated workspace, EV charger) in your listing description and photos.
- Regularly check competitor amenities in Borenore to stay competitive.
Dive Deeper: Advanced Borenore STR Market Data (2026)
Ready to unlock more insights? AirROI provides access to advanced metrics and comprehensive Airbnb data for Borenore. Explore detailed analytics beyond this report to refine your investment strategy, optimize pricing, and maximize your vacation rental profits.
Explore Advanced MetricsBorenore Airbnb Guest Demographics & Profile Analysis (2026)
Guest Profile Summary for Borenore
- The typical guest profile for Airbnb in Borenore consists of primarily domestic travelers (97%), often arriving from nearby Sydney, typically belonging to the Post-2000s (Gen Z/Alpha) group (50%), primarily speaking English or Italian.
- Domestic travelers account for 97.0% of guests.
- Key international markets include Australia (97%) and United Kingdom (1.8%).
- Top languages spoken are English (63.4%) followed by Italian (7.3%).
- A significant demographic segment is the Post-2000s (Gen Z/Alpha) group, representing 50% of guests.
Recommendations for Hosts
- Target domestic marketing efforts towards travelers from Sydney and New South Wales.
- Tailor amenities and listing descriptions to appeal to the dominant Post-2000s (Gen Z/Alpha) demographic (e.g., highlight fast WiFi, smart home features, local guides).
- Highlight unique local experiences or amenities relevant to the primary guest profile.
- Consider seasonal promotions aligned with peak travel times for key origin markets.
Borenore Airbnb Booking Patterns (2026): Available vs. Booked Days
Available Days Distribution
Booked Days Distribution
Booking Pattern Insights for Borenore
- The most common availability pattern in Borenore falls within the 271-366 days range, representing 56.3% of listings. This suggests many properties have significant open periods on their calendars.
- Approximately 87.6% of listings show high availability (181+ days open annually), indicating potential for increased bookings or specific owner usage patterns.
- For booked days, the 31-90 days range is most frequent in Borenore (50%), reflecting common guest stay durations or potential owner blocking patterns.
- A notable 12.5% of properties secure long booking periods (181+ days booked per year), highlighting successful long-term rental strategies or significant owner usage.
How Far in Advance Do Guests Book Airbnb in Borenore?
Average Booking Lead Time by Month
Booking Lead Time Insights for Borenore
- The overall average booking lead time for vacation rentals in Borenore is 50 days.
- Guests book furthest in advance for stays during December (average 90 days), likely coinciding with peak travel demand or local events.
- The shortest booking windows occur for stays in August (average 28 days), indicating more last-minute travel plans during this time.
- Seasonally, Spring (59 days avg.) sees the longest lead times, while Summer (51 days avg.) has the shortest, reflecting typical travel planning cycles.
Recommendations for Hosts
- Use the overall average lead time (50 days) as a baseline for your pricing and availability strategy in Borenore.
- For December stays, consider implementing length-of-stay discounts or slightly higher rates for bookings made less than 90 days out to capitalize on advance planning.
- Target marketing efforts for the Spring season well in advance (at least 59 days) to capture early planners.
- Monitor your own booking lead times against these Borenore averages to identify opportunities for dynamic pricing adjustments.
Borenore Airbnb Minimum Stay Requirements Analysis
Distribution of Listings by Minimum Night Requirement
1 Night
3 listings
18.8% of total
2 Nights
8 listings
50% of total
7-29 Nights
1 listings
6.3% of total
30+ Nights
4 listings
25% of total
Key Insights
- The most prevalent minimum stay requirement in Borenore is 2 Nights, adopted by 50% of listings. This highlights the market's preference for shorter, flexible bookings.
- A strong majority (68.8%) of the Borenore Airbnb data shows acceptance of very short stays (1-2 nights), indicating a dynamic, high-turnover market.
- A significant segment (25%) caters to monthly stays (30+ nights) in Borenore, pointing to opportunities in the extended-stay market.
Recommendations
- Align with the market by considering a 2 Nights minimum stay, as 50% of Borenore hosts use this setting.
- If feasible, allowing 1-night stays, especially midweek or during low season, could capture last-minute bookings, as only 18.8% currently do.
- A 2-night minimum appears standard (50%). Consider this for weekends or peak periods.
- Explore offering discounts for stays of 30+ nights to attract the 25% of the market seeking extended stays.
- Adjust minimum nights based on seasonality – potentially shorter during low season and longer during peak demand periods in Borenore.
Borenore Airbnb Cancellation Policy Trends Analysis (2026)
Flexible
4 listings
26.7% of total
Moderate
6 listings
40% of total
Firm
2 listings
13.3% of total
Strict
3 listings
20% of total
Cancellation Policy Insights for Borenore
- The prevailing Airbnb cancellation policy trend in Borenore is Moderate, used by 40% of listings.
- There's a relatively balanced mix between guest-friendly (66.7%) and stricter (33.3%) policies, offering choices for different guest needs.
Recommendations for Hosts
- Consider adopting a Moderate policy to align with the 40% market standard in Borenore.
- Regularly review your cancellation policy against competitors and market demand shifts in Borenore.
What Do the Top Airbnb Listings in Borenore Look Like?
Benchmark your potential! Explore examples of top-performing Airbnb properties in Borenorebased on Trailing Twelve Month (TTM) revenue. Analyze their characteristics, revenue, occupancy rate, and ADR to understand what drives success in this market.
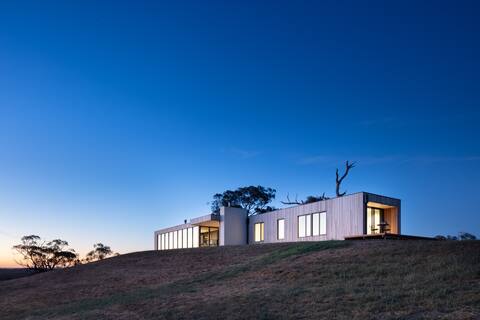
Spectacular Kangaroobie Cabin
Entire Place • 3 bedrooms
Loft House - On Heifer Station Vineyard, Firepit
Entire Place • 2 bedrooms
Perfect farm stay near Orange.
Entire Place • 3 bedrooms

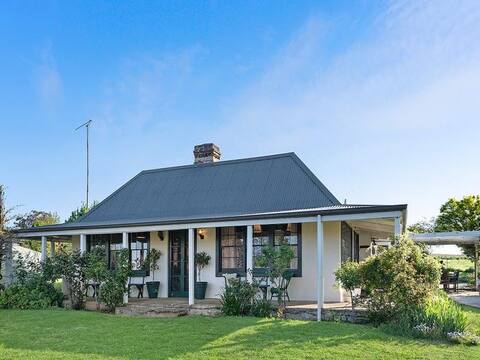
Cooinda Cottage - Beautiful Borenore Farm Stay
Entire Place • 3 bedrooms

The Borenore Inn | Historic Charm, Entertainer
Entire Place • 5 bedrooms

Dragonfly Cottages (Cottage 1)
Entire Place • 1 bedroom
Note: Performance varies based on location, size, amenities, seasonality, and management quality. Data reflects the past 12 months.
Who Are the Top Airbnb Hosts in Borenore?
Learn from the best! This table showcases top-performing Airbnb hosts in Borenore based on the number of properties managed and estimated total revenue over the past year. Analyze their scale and performance metrics.
| Host Name | Properties | Grossing Revenue | Stay Reviews | Avg Rating |
|---|---|---|---|---|
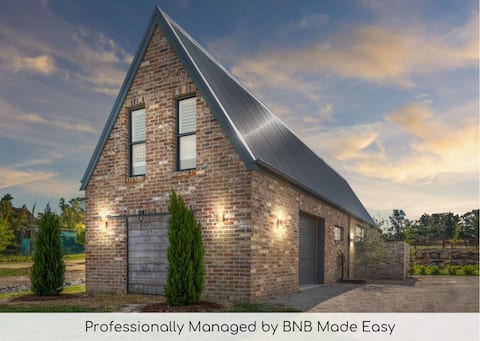
| BNB Made Easy: Timmy | 3 | $89,828 | 140 | 4.76/5.0 |
| Suzie | 1 | $80,751 | 21 | 5.00/5.0 |
| Nikki | 1 | $31,491 | 11 | 4.91/5.0 |
| Book Regional | 1 | $28,089 | 51 | 4.80/5.0 |
| Josie | 2 | $24,539 | 241 | 4.99/5.0 |
| Andrew | 1 | $21,003 | 97 | 4.97/5.0 |
| Jannene | 1 | $18,967 | 139 | 4.87/5.0 |
| Maggie | 1 | $16,047 | 344 | 4.94/5.0 |
| Lindall | 1 | $12,863 | 81 | 4.98/5.0 |
| Host #386170646 | 1 | $11,571 | 0 | 0.00/5.0 |
Analyzing the strategies of top hosts, such as their property selection, pricing, and guest communication, can offer valuable lessons for optimizing your own Airbnb operations in Borenore.
How Does Borenore's Airbnb Market Compare to Nearby Cities?
How does the Borenore Airbnb market stack up against its neighbors? Compare key performance metrics like average monthly revenue, ADR, and occupancy rates in surrounding areas to understand the broader regional STR landscape.
Compared with Cowra, Borenore has 11 percentage points lower occupancy and about $31 higher ADR. That helps frame whether this market is winning more on demand, pricing, or both.
| Market | Active Properties | Monthly Revenue | Daily Rate | Avg. Occupancy |
|---|---|---|---|---|
| Mudgee | 207 | $2,819 | $277.64 | 41% |
| Mid-Western Regional Council | 198 | $2,733 | $307.48 | 35% |
| Orange City Council | 21 | $2,400 | $224.17 | 40% |
| Orange | 334 | $2,266 | $204.64 | 44% |
| Dubbo | 154 | $2,263 | $208.04 | 45% |
| Cowra | 11 | $2,217 | $170.09 | 49% |
| Cabonne Council | 40 | $2,180 | $235.12 | 34% |
| Bathurst | 230 | $2,173 | $268.68 | 38% |
| Bathurst Regional Council | 31 | $2,162 | $235.10 | 36% |
| Oberon Council | 29 | $2,133 | $274.55 | 37% |
Frequently Asked Questions About Airbnb in Borenore
These quick answers summarize the most common investor and operator questions using AirROI's latest market data for Borenore.
How much do Airbnb hosts make in Borenore?
Borenore hosts earn about $22,177 per year on average, with an average nightly rate of $201 and RevPAR of N/A. Those figures describe the typical revenue environment for active listings in Borenore, New South Wales, not the ceiling for the best operators. Source: AirROI 2025 data, Borenore market, May 2024 to April 2025.
What is the average Airbnb occupancy rate in Borenore?
The average Airbnb occupancy rate in Borenore is 37.6%. April is the strongest month and February is the softest, so hosts should expect demand to move meaningfully throughout the year rather than stay flat.
What is the average Airbnb daily rate in Borenore?
Listings in Borenore average $201 per night. The broader pricing spread also matters: lower-performing listings cluster closer to the lower quartiles, while premium homes can price materially above the city average when demand spikes or listing quality stands out.
How many Airbnb listings are active in Borenore?
Borenore currently has about 16 active Airbnb listings in AirROI's market dataset. That supply count helps explain how competitive the market is, how much depth there is for benchmarking, and whether the market behaves like a niche destination or a scaled urban market.
How strict are short-term rental regulations in Borenore?
AirROI currently classifies the short-term rental regulation level in Borenore as High. The dataset also shows about 93.8% of listings with registration evidence. That is a market signal, not legal advice, so hosts should still confirm current licensing and compliance rules locally before listing.
What is the RevPAR for Airbnb in Borenore?
RevPAR in Borenore is about N/A. That metric combines pricing and occupancy into one efficiency number, so it is often a better quick benchmark than ADR alone when investors want to compare how well listings convert nightly rates into realized revenue.
Is Airbnb profitable in Borenore?
Occupancy of 37.6% means Borenore is a more selective market. Profitability is achievable but requires careful cost management, premium positioning, or targeting longer stays to reduce turnover. Average annual revenue is $22,177, but individual returns depend on property type, location within the city, and the host's operating efficiency.
How far in advance do guests book Airbnb in Borenore?
The average booking lead time in Borenore is about 50 days — a longer planning horizon typical of destination or vacation markets where travelers book well in advance. Hosts who understand their market's booking cadence can adjust minimum stays and pricing windows accordingly.
What are the best neighborhoods for Airbnb in Borenore?
Based on AirROI's analysis, some of the top neighborhoods for short-term rentals in Borenore include Orange, Cowra, Bathurst. Each area attracts different guest profiles — from business travelers to leisure visitors — so the best location depends on the property type and target audience a host is aiming for. See the full neighborhood breakdown above.
What type of property performs best on Airbnb in Borenore?
entire_home listings make up 93.8% of the active supply in Borenore. The most common configuration does not always mean the most profitable — operators who identify underserved property types or bedroom counts can sometimes outperform the market average by filling a gap in local supply.
How does Borenore compare to nearby Airbnb markets?
Among neighboring markets, Mudgee posts $33,831 in average annual revenue with 40.7% occupancy, compared to Borenore's $22,177 and 37.6%. Comparing nearby markets helps investors understand whether a destination's performance reflects local demand or broader regional trends.
When is the peak season for Airbnb in Borenore?
April is the highest-revenue month in Borenore, while February is the softest. The revenue spread between them indicates a highly seasonal market — revenue in the peak month is more than double the low month, so cash-flow planning and pricing automation are critical.
About AirROI Market Data
AirROI tracks over 20 million properties across 190+ countries and maintains 15+ years of historical performance data, making it one of the deepest Airbnb and STR intelligence platforms available. The analytics pipeline aggregates listing-level data monthly — revenue, occupancy, nightly rates, RevPAR, guest demographics, booking patterns, and competitive supply — so investors and operators can benchmark any market against its own history and against neighboring destinations.
Real estate investors, property managers, financial institutions, hedge funds, tourism boards, hospitality consultants, tech platforms, and academic researchers rely on AirROI data to underwrite acquisitions, optimize pricing, model macro trends, and conduct peer-reviewed research. Data is available through in-depth market reports like this one and the Airbnb API with 22 endpoints and an Airbnb MCP Server for AI agents.
AirROI proprietary analytics as of 2025-04-30. Metrics reflect trailing twelve-month aggregates from active listings. Revenue figures are market averages, not projections. Neighborhood descriptions are AI-generated and reviewed for accuracy. For full methodology, see the data methodology page.