
Revenue Per Available Listing (RevPAL)
Key Takeaways
- RevPAL = Total Portfolio Revenue ÷ Number of Active Listings (monthly or annual)
- The metric complements RevPAR by measuring listing-level output rather than room-night efficiency
- AirROI data shows annual RevPAL ranging from $21,970 (New York) to $53,472 (San Diego) across 43,030 active listings in 6 markets
- RevPAL isolates underperformers: any listing well below the portfolio average demands immediate diagnosis
- Track RevPAL monthly to separate seasonal softness from a structural performance problem
How to Calculate RevPAL
Formula:
RevPAL = Total Portfolio Revenue ÷ Number of Active Listings
Monthly example:
A property manager runs 12 short-term rental listings that collectively earn $72,000 in June. RevPAL for that month = $72,000 ÷ 12 = $6,000 per listing. If listing #7 posted $2,900 while listing #3 earned $9,800, the $6,000 portfolio RevPAL is the benchmark that surfaces listing #7 as a problem immediately.
Annualized:
Multiply monthly RevPAL by 12, or sum the full 12-month revenue and divide once. Annualized RevPAL is the standard for acquisition modeling and owner reporting.
RevPAL vs. RevPAR: When to Use Each
Both metrics live in the Revenue & Performance toolkit, but they answer different questions.
| Metric | Formula | What it measures | Best use |
|---|---|---|---|
| RevPAL | Total revenue ÷ active listings | Revenue output per unit | Portfolio benchmarking, owner reporting, acquisition screening |
| RevPAR | ADR × occupancy rate | Nightly rate efficiency | Pricing optimization, channel comparison, daily performance |
| ADR | Revenue ÷ booked nights | Average nightly rate | Pricing strategy, comp analysis |
RevPAR tells you whether you priced each night well. RevPAL tells you whether the listing produced enough revenue in total. A listing can post a strong RevPAR on its 120 booked nights but still show a weak RevPAL if 245 nights sat vacant.
Real RevPAL Benchmarks by Market
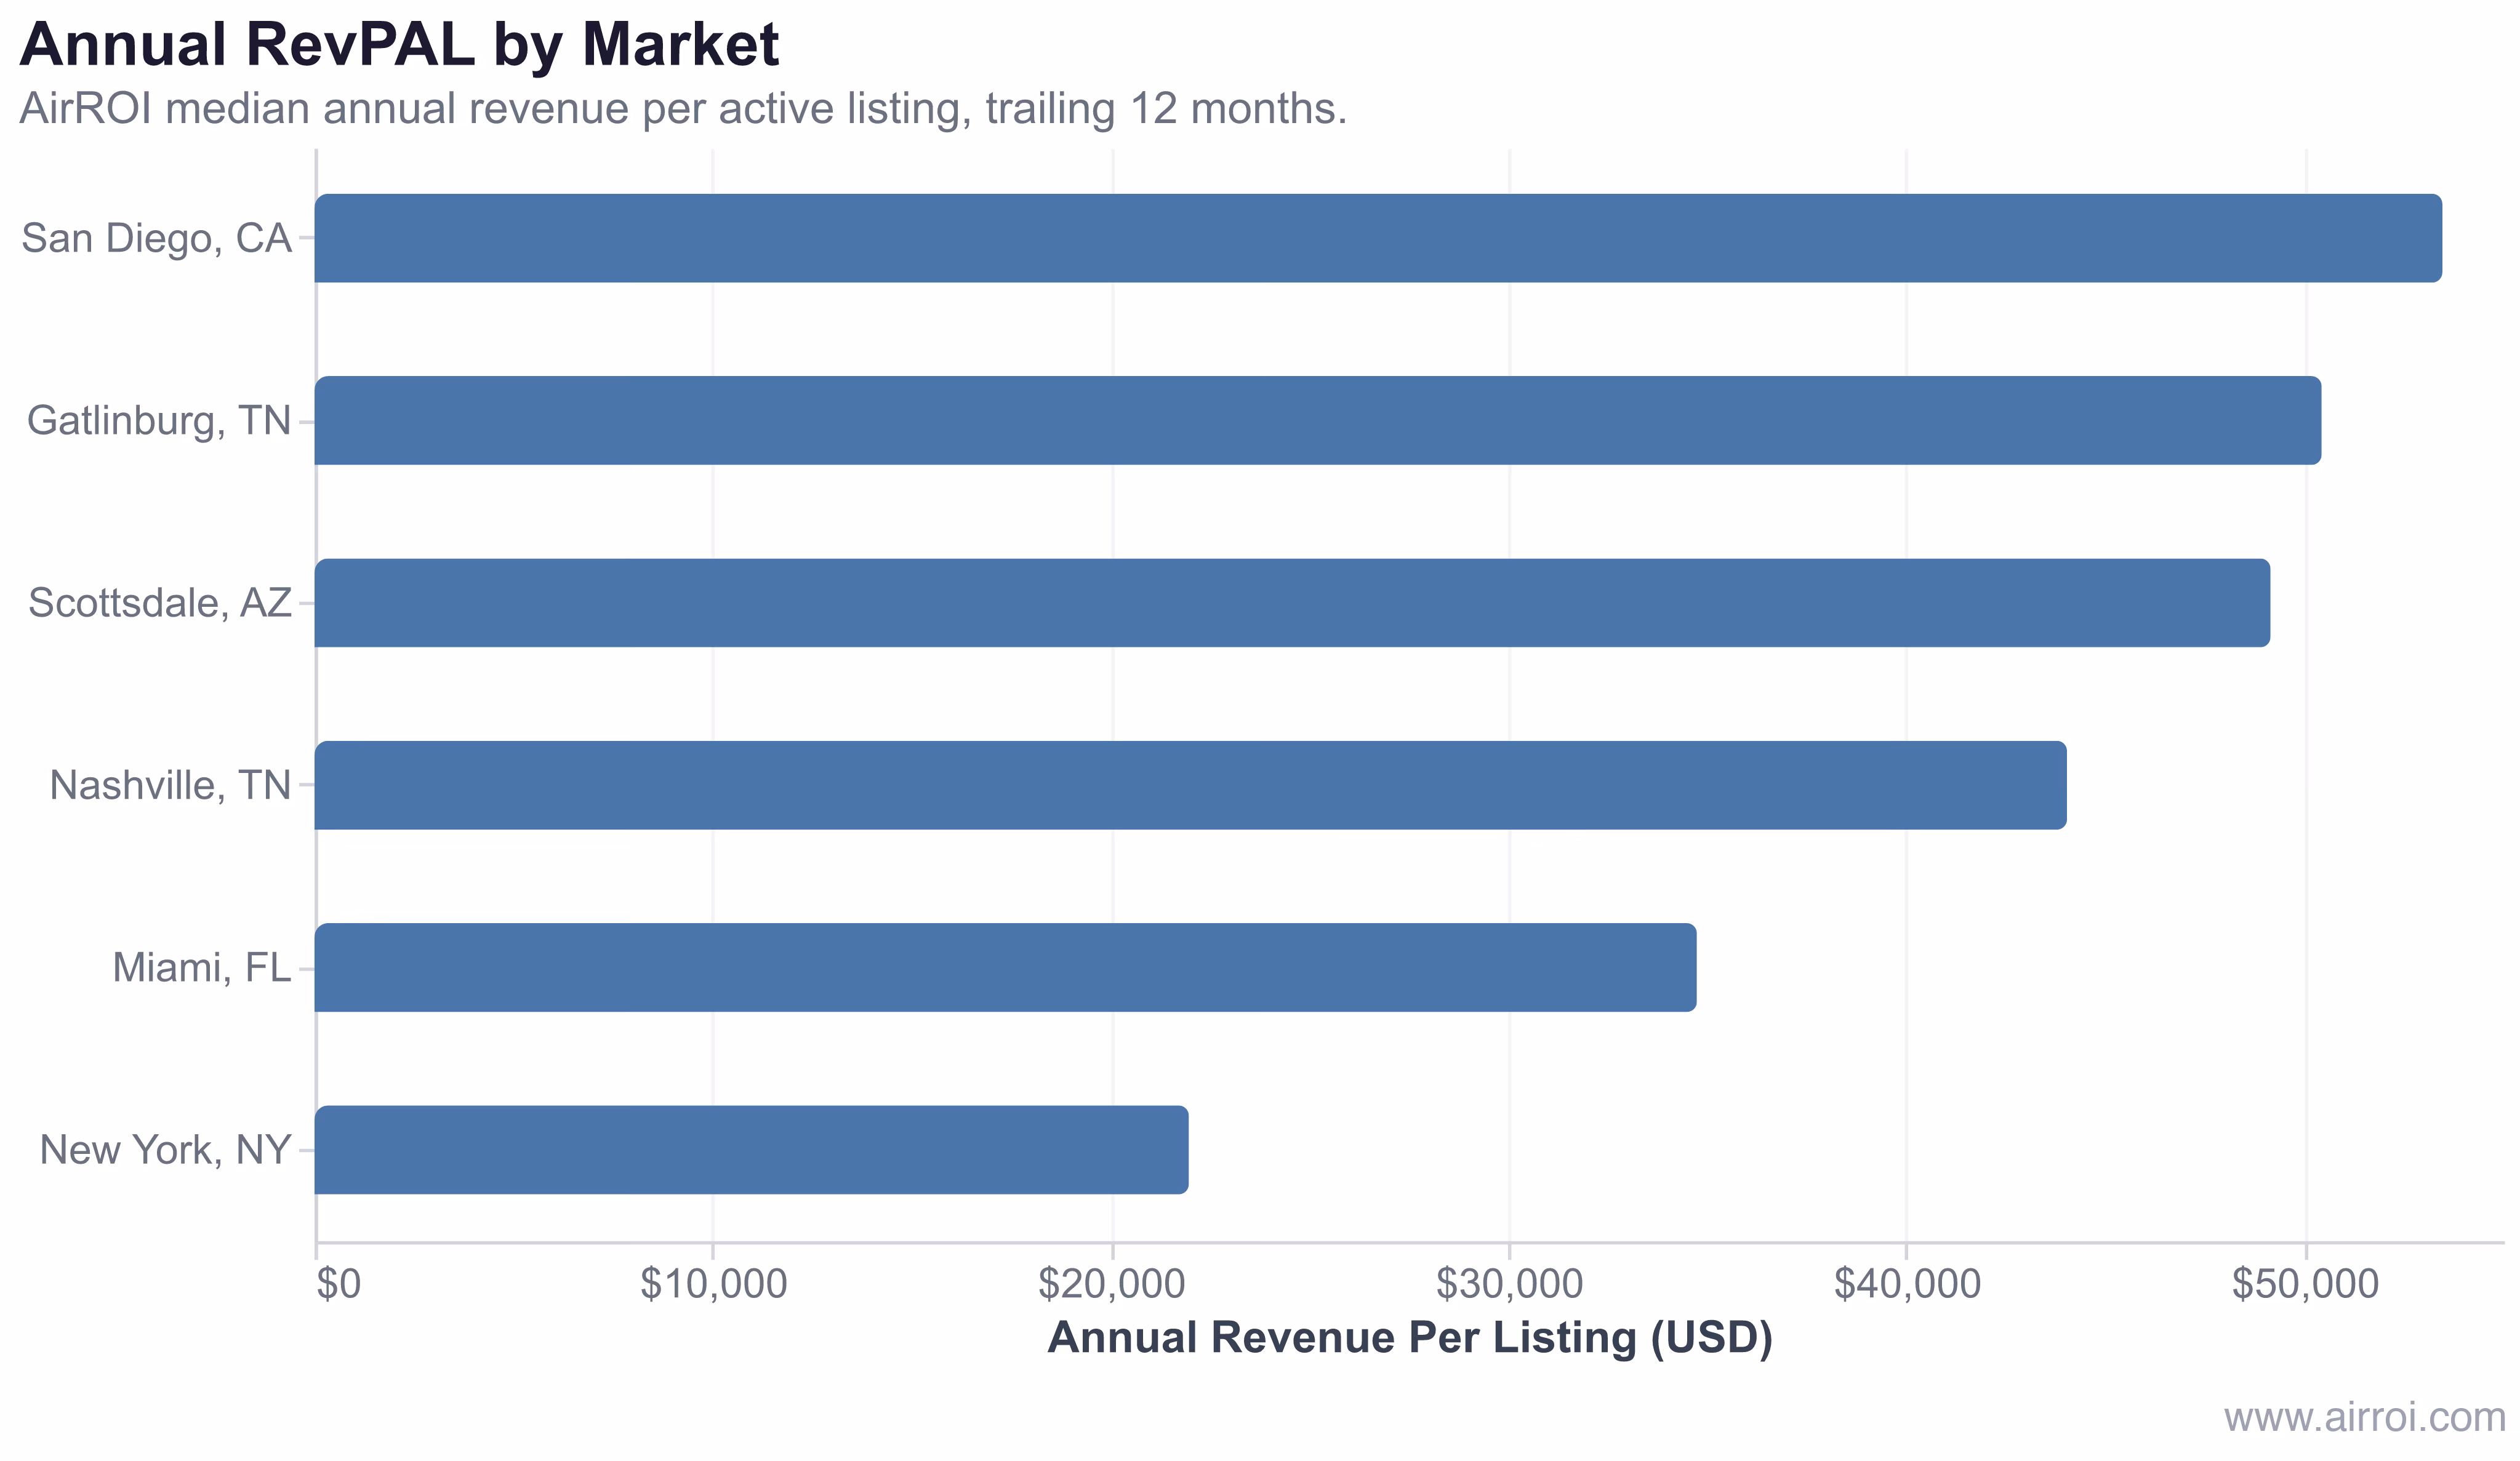
| Market | Annual RevPAL | Active Listings | Key Driver |
|---|---|---|---|
| San Diego, CA | $53,472 | 9,560 | High ADR ($394.9) + solid occupancy |
| Gatlinburg, TN | $50,438 | 3,622 | Resort demand, low minimum nights (2.1) |
| Scottsdale, AZ | $49,153 | 4,310 | Luxury ADR ($421.1), desert seasonality |
| Nashville, TN | $44,039 | 6,165 | Event-driven demand, long lead times |
| Miami, FL | $34,738 | 7,905 | Year-round demand, competitive supply |
| New York, NY | $21,970 | 11,468 | Local Law 18 minimum-night floor suppresses bookings |
In AirROI's data, the gap between the highest and lowest RevPAL markets is driven more by regulatory policy and minimum-night requirements than by demand. San Diego and New York attract similar traveler volumes — but only one market allows the booking frequency that maximizes per-listing revenue.
Why RevPAL Matters for Property Managers and Investors
Portfolio optimization. RevPAL converts an unwieldy portfolio of individual listing metrics into a single ranking. Every listing either beats the portfolio average, matches it, or underperforms — and underperformers get a defined revenue gap, not a vague sense that something is wrong.
Owner reporting. RevPAL converts revenue performance into language property owners understand: "Your listing generated $44,000 last year, 14% above the Nashville market median of $38,500." That framing justifies management fees and demonstrates measurable value.
How to Improve RevPAL Across a Portfolio
3. Remove chronic underperformers. A listing that consistently posts RevPAL 40%+ below the portfolio median is a drag on aggregate performance and owner trust. Before exiting, run a 90-day optimization sprint — new photography, amenity upgrades, revised pricing. If RevPAL doesn't move, the listing may be structurally constrained by location or property type.
5. Segment RevPAL by property type. A studio condo and a 4-bedroom cabin in the same portfolio will never share a RevPAL benchmark. Segment by bedroom count or property type before ranking listings — otherwise high-capacity properties always top the list and studios always look like underperformers.
Frequently Asked Questions
RevPAR measures revenue per available room-night, making it a nightly rate-efficiency metric. RevPAL measures total revenue per active listing over a period — typically monthly or annually — capturing the full output of each unit regardless of size, nightly rate, or occupancy. RevPAL is the more useful number for portfolio managers comparing the revenue contribution of each listing.
Divide total portfolio revenue by the number of active listings in the same period. For example, if 10 listings generated $50,000 in a month, RevPAL is $5,000 per listing per month. Annualized, that same portfolio running at the same rate would show a RevPAL of $60,000 per listing per year.
AirROI data shows median annual RevPAL ranging from $21,970 in New York (constrained by Local Law 18 minimum-night rules) to $53,472 in San Diego across more than 43,000 active listings. A well-run portfolio in a mid-tier market typically targets $35,000–$50,000 per listing per year. Benchmarking against the market median matters more than any universal threshold.
RevPAL lets property managers rank every listing against the portfolio average in a single number, isolating underperformers quickly. A listing generating $28,000 when the portfolio RevPAL is $44,000 is an immediate signal to investigate — whether the problem is pricing, occupancy, amenities, or listing quality.
RevPAL = RevPAR × 365 (for annual figures) at the listing level, assuming RevPAR is calculated on a per-listing basis. In practice the two diverge because RevPAR is typically measured per room-night available, while RevPAL accounts for actual calendar days and seasonal blocking. Use RevPAR to optimize nightly pricing; use RevPAL to evaluate each listing's total contribution to the portfolio.