
Year-over-Year (YoY) Growth
Key Takeaways
- YoY Growth (%) = ((Current Period Value − Prior Year Period Value) ÷ Prior Year Period Value) × 100
- Eliminates seasonal distortion by comparing the same calendar period across two years
- Calculate YoY for every core metric: gross revenue, ADR, occupancy, and RevPAR
- Mature listings typically deliver 5–15% annual revenue growth; new listings often see 20–40%+ while ramping reviews
- Benchmarking your YoY against the market average reveals whether you are gaining or losing competitive share
How to Calculate YoY Growth
The formula is the same regardless of which metric you are measuring:
YoY Growth (%) = ((Current Period Value − Prior Year Period Value) ÷ Prior Year Period Value) × 100
Apply it to a full month, quarter, or year — consistency matters more than the window length.
Example — January 2025 vs January 2026:
| Metric | Jan 2025 | Jan 2026 | YoY Growth |
|---|---|---|---|
| Gross Revenue | $4,800 | $5,500 | +14.6% |
| ADR | $168 | $182 | +8.3% |
| Occupancy Rate | 58% | 62% | +6.9% |
| RevPAR | $97.44 | $112.84 | +15.8% |
Revenue grew 14.6% YoY, driven by both a higher ADR (+8.3%) and improved occupancy (+6.9%). RevPAR's 15.8% growth captures the compounding effect of both levers working together — which is exactly why RevPAR is the preferred headline metric for YoY comparisons.
Annual STR Revenue Across Key Markets
Understanding YoY growth requires an anchor: where does the revenue base actually sit across different US markets? In AirROI's analysis of more than 69,000 active listings across six markets, median annual STR revenue spans from $27,540 in Denver to $53,472 in San Diego — a gap that sets the baseline from which YoY trends are measured.
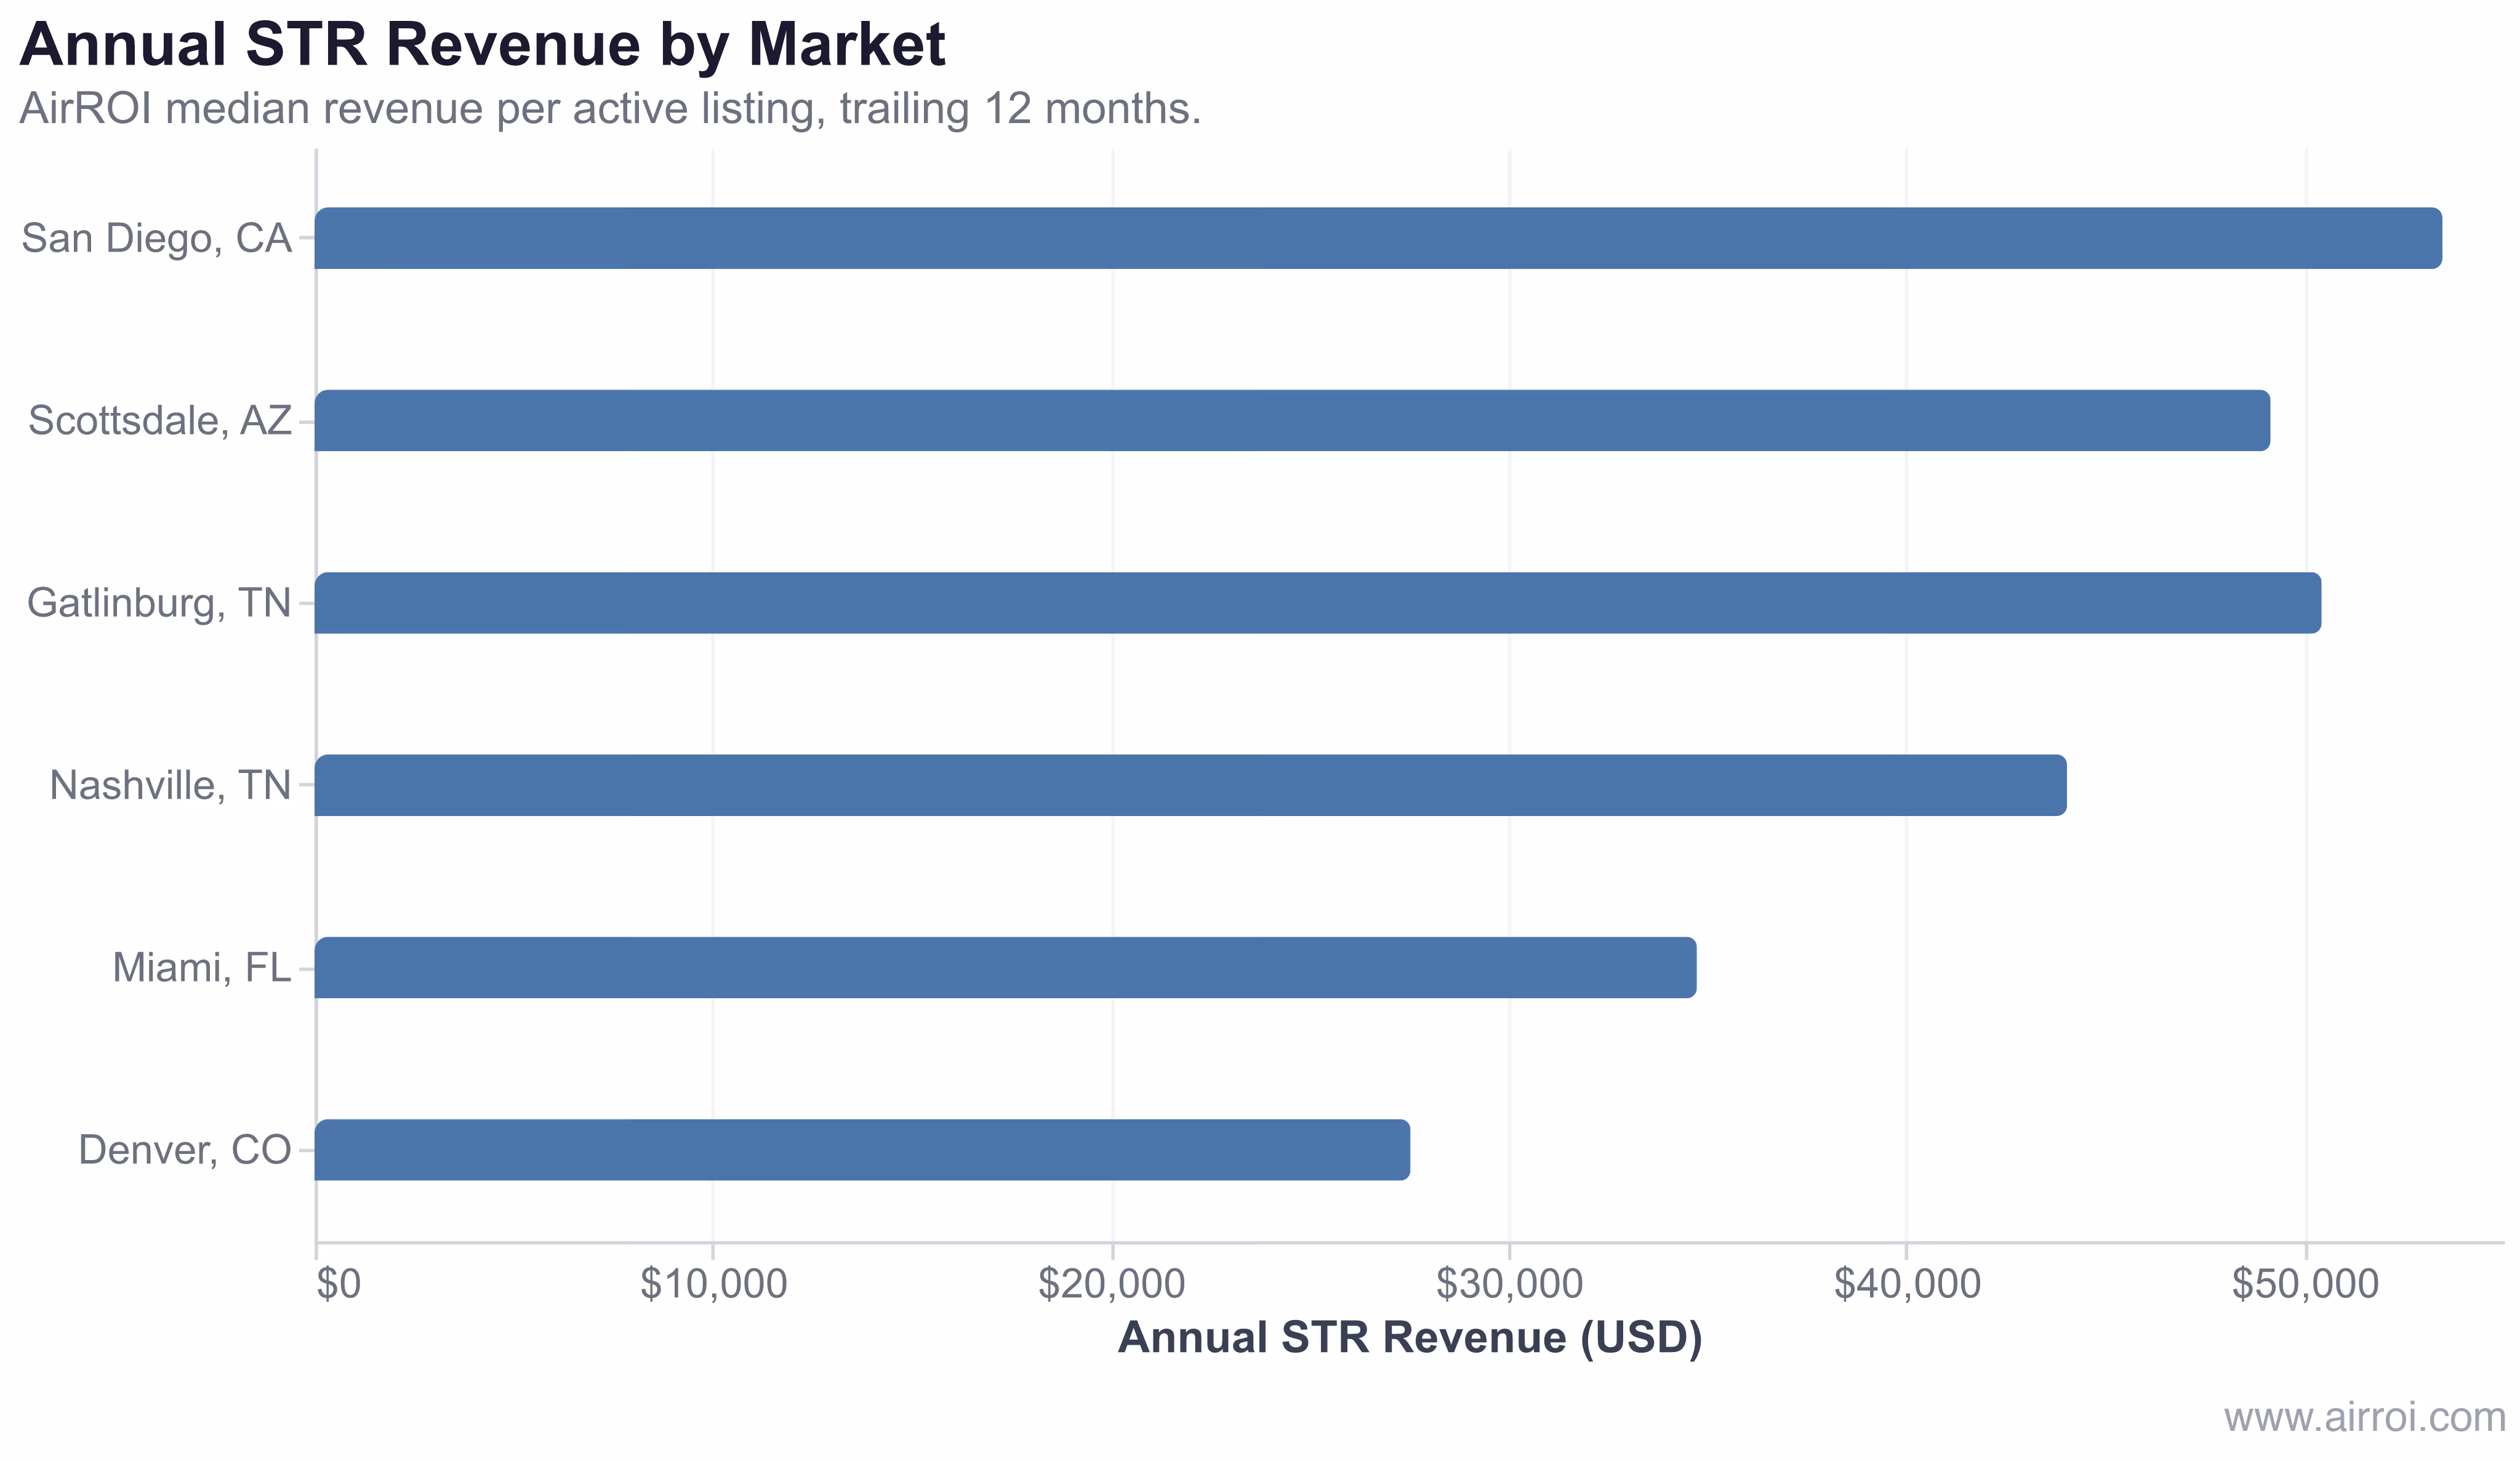
In AirROI's analysis of 69,356 active listings across San Diego, Gatlinburg, Scottsdale, Nashville, Miami, and Denver, median annual revenue ranges from $27,540 (Denver) to $53,472 (San Diego). A 10% YoY revenue gain means very different dollar amounts — and very different investment outcomes — depending on which baseline you start from.
A 10% YoY revenue gain in San Diego ($5,347) outpaces a 15% gain in Denver ($4,131) in absolute dollars. Percentage growth without the revenue baseline is an incomplete story.
YoY Growth Benchmarks by Listing Stage
| Listing Stage | Typical YoY Revenue Growth | What It Signals |
|---|---|---|
| New listing (Year 1–2) | +20% to +40% | Ramping reviews, search ranking, pricing calibration |
| Maturing listing (Year 2–4) | +10% to +20% | Operational optimization, repeat guest base building |
| Mature listing (Year 4+) | +5% to +15% | Incremental gains, tracking market growth |
| Stagnant listing | 0% to +5% | Pricing drift, aging photos, amenity gap vs. new supply |
| Declining listing | −5% or worse | Active intervention needed: renovation, repositioning, repricing |
| Market downturn | −10% to −20% | External demand shock; focus shifts to outperforming the market |
Why YoY Growth Matters for STR Operators
Seasonal normalization. A $3,000 January looks weak against December's $7,000, but if last January was $2,500, you grew 20%. YoY strips away the noise that makes month-over-month comparisons nearly useless in seasonal vacation markets.
Strategy validation. When you raise rates, update photos, or add a hot tub, YoY revenue growth in the months after the change provides the cleanest signal that the investment paid off — controlling for seasonality automatically.
How to Build a YoY Tracking System
- Extract monthly data — pull revenue, ADR, occupancy, and RevPAR for every completed month going back at least 24 months from your channel manager or Airbnb dashboard export
- Build a side-by-side table — for each month, place the current-year figure next to the prior-year figure and calculate the percentage change
- Add a market benchmark column — use AirROI's market-level data for the same months; a single column showing market YoY growth turns your self-comparison into a competitive analysis
- Segment by driver — when revenue YoY diverges from ADR and occupancy trends, decompose the cause: ADR improvement is pricing power, occupancy improvement is demand capture, and both moving together compounds into strong RevPAR growth
- Flag external distortions — major events, new regulations, or a surge in local supply can inflate or deflate a single year's comparison; note these in your tracking sheet so you don't misread a one-time spike as a trend
Frequently Asked Questions
YoY Growth = ((Current Period Value - Same Period Last Year Value) / Same Period Last Year Value) x 100. For example, if your January 2026 revenue was $5,500 and January 2025 revenue was $4,800, your YoY growth is (($5,500 - $4,800) / $4,800) x 100 = 14.6%.
A healthy YoY growth rate for a mature short-term rental is 5-15% in revenue and RevPAR. New listings may see 20-40%+ growth in their first two years as they build reviews and optimize. Growth above market averages indicates you are gaining competitive share.
Short-term rentals are heavily seasonal, so month-over-month comparisons are misleading. Comparing July to June always shows a spike in vacation markets, but that reflects seasonality, not real growth. YoY compares July to July, isolating actual performance improvement from seasonal patterns.
Track YoY changes in gross revenue, ADR, occupancy rate, and RevPAR. Together they decompose whether growth came from pricing power (ADR up), demand gains (occupancy up), or both. RevPAR captures the compounding effect and is the single best headline number to benchmark against your market.
Benchmark your YoY figures against AirROI's market-level data for the same period. If your revenue grew 12% YoY but the market grew 15%, your listing underperformed despite a positive number. If the market declined 5% and you held flat, you gained share. Market context turns a raw percentage into an actionable signal.