
Benchmarking
Key Takeaways
- Benchmarking measures your ADR, occupancy, and RevPAR against a curated comp set of 5–15 genuinely comparable properties
- A below-benchmark RevPAR always traces to one of two root causes: overpricing (high ADR, low occupancy) or underpricing (low ADR, average occupancy)
- AirROI data shows RevPAR ranging from $115 in Las Vegas to $212 in San Diego — context that makes a market-level benchmark essential before drawing any conclusions
- Regular benchmarking separates listing-specific performance issues from market-wide trends, so you act on real problems rather than noise
- Booking lead time and average length of stay are underused benchmarking metrics that reveal demand timing patterns invisible in ADR alone
How Benchmarking Works
Step 1: Define Your Comp Set
A comp set is the group of properties you measure yourself against. The tighter the match, the more actionable the data. Select properties based on:
- Location (same neighborhood or immediate area)
- Property type (apartment, house, cabin)
- Size (bedroom count, guest capacity)
- Amenity tier (pool, hot tub, parking)
- Quality level (budget, standard, premium)
A 10-property set of genuine peers outperforms a 50-property set diluted with mismatches.
Step 2: Collect Performance Data
| Metric | Your Property | Comp Set Average | Variance |
|---|---|---|---|
| ADR | $185 | $172 | +7.6% |
| Occupancy Rate | 62% | 71% | −12.7% |
| RevPAR | $114.70 | $122.12 | −6.1% |
| Avg Rating | 4.82 | 4.76 | +1.3% |
Step 3: Diagnose and Act
In this example the property is priced above market (+7.6% ADR) but capturing significantly less demand (−12.7% occupancy). RevPAR ends up 6.1% below benchmark. The diagnosis: pricing is too aggressive for this comp set. A modest ADR reduction would likely close most of that RevPAR gap by recovering occupancy.
Why Market-Level Benchmarks Matter
Even a perfect comp set is limited if you don't understand the market ceiling. AirROI's trailing-12-month data across more than 58,000 active listings reveals a wide RevPAR spread that makes market selection as important as listing optimization.
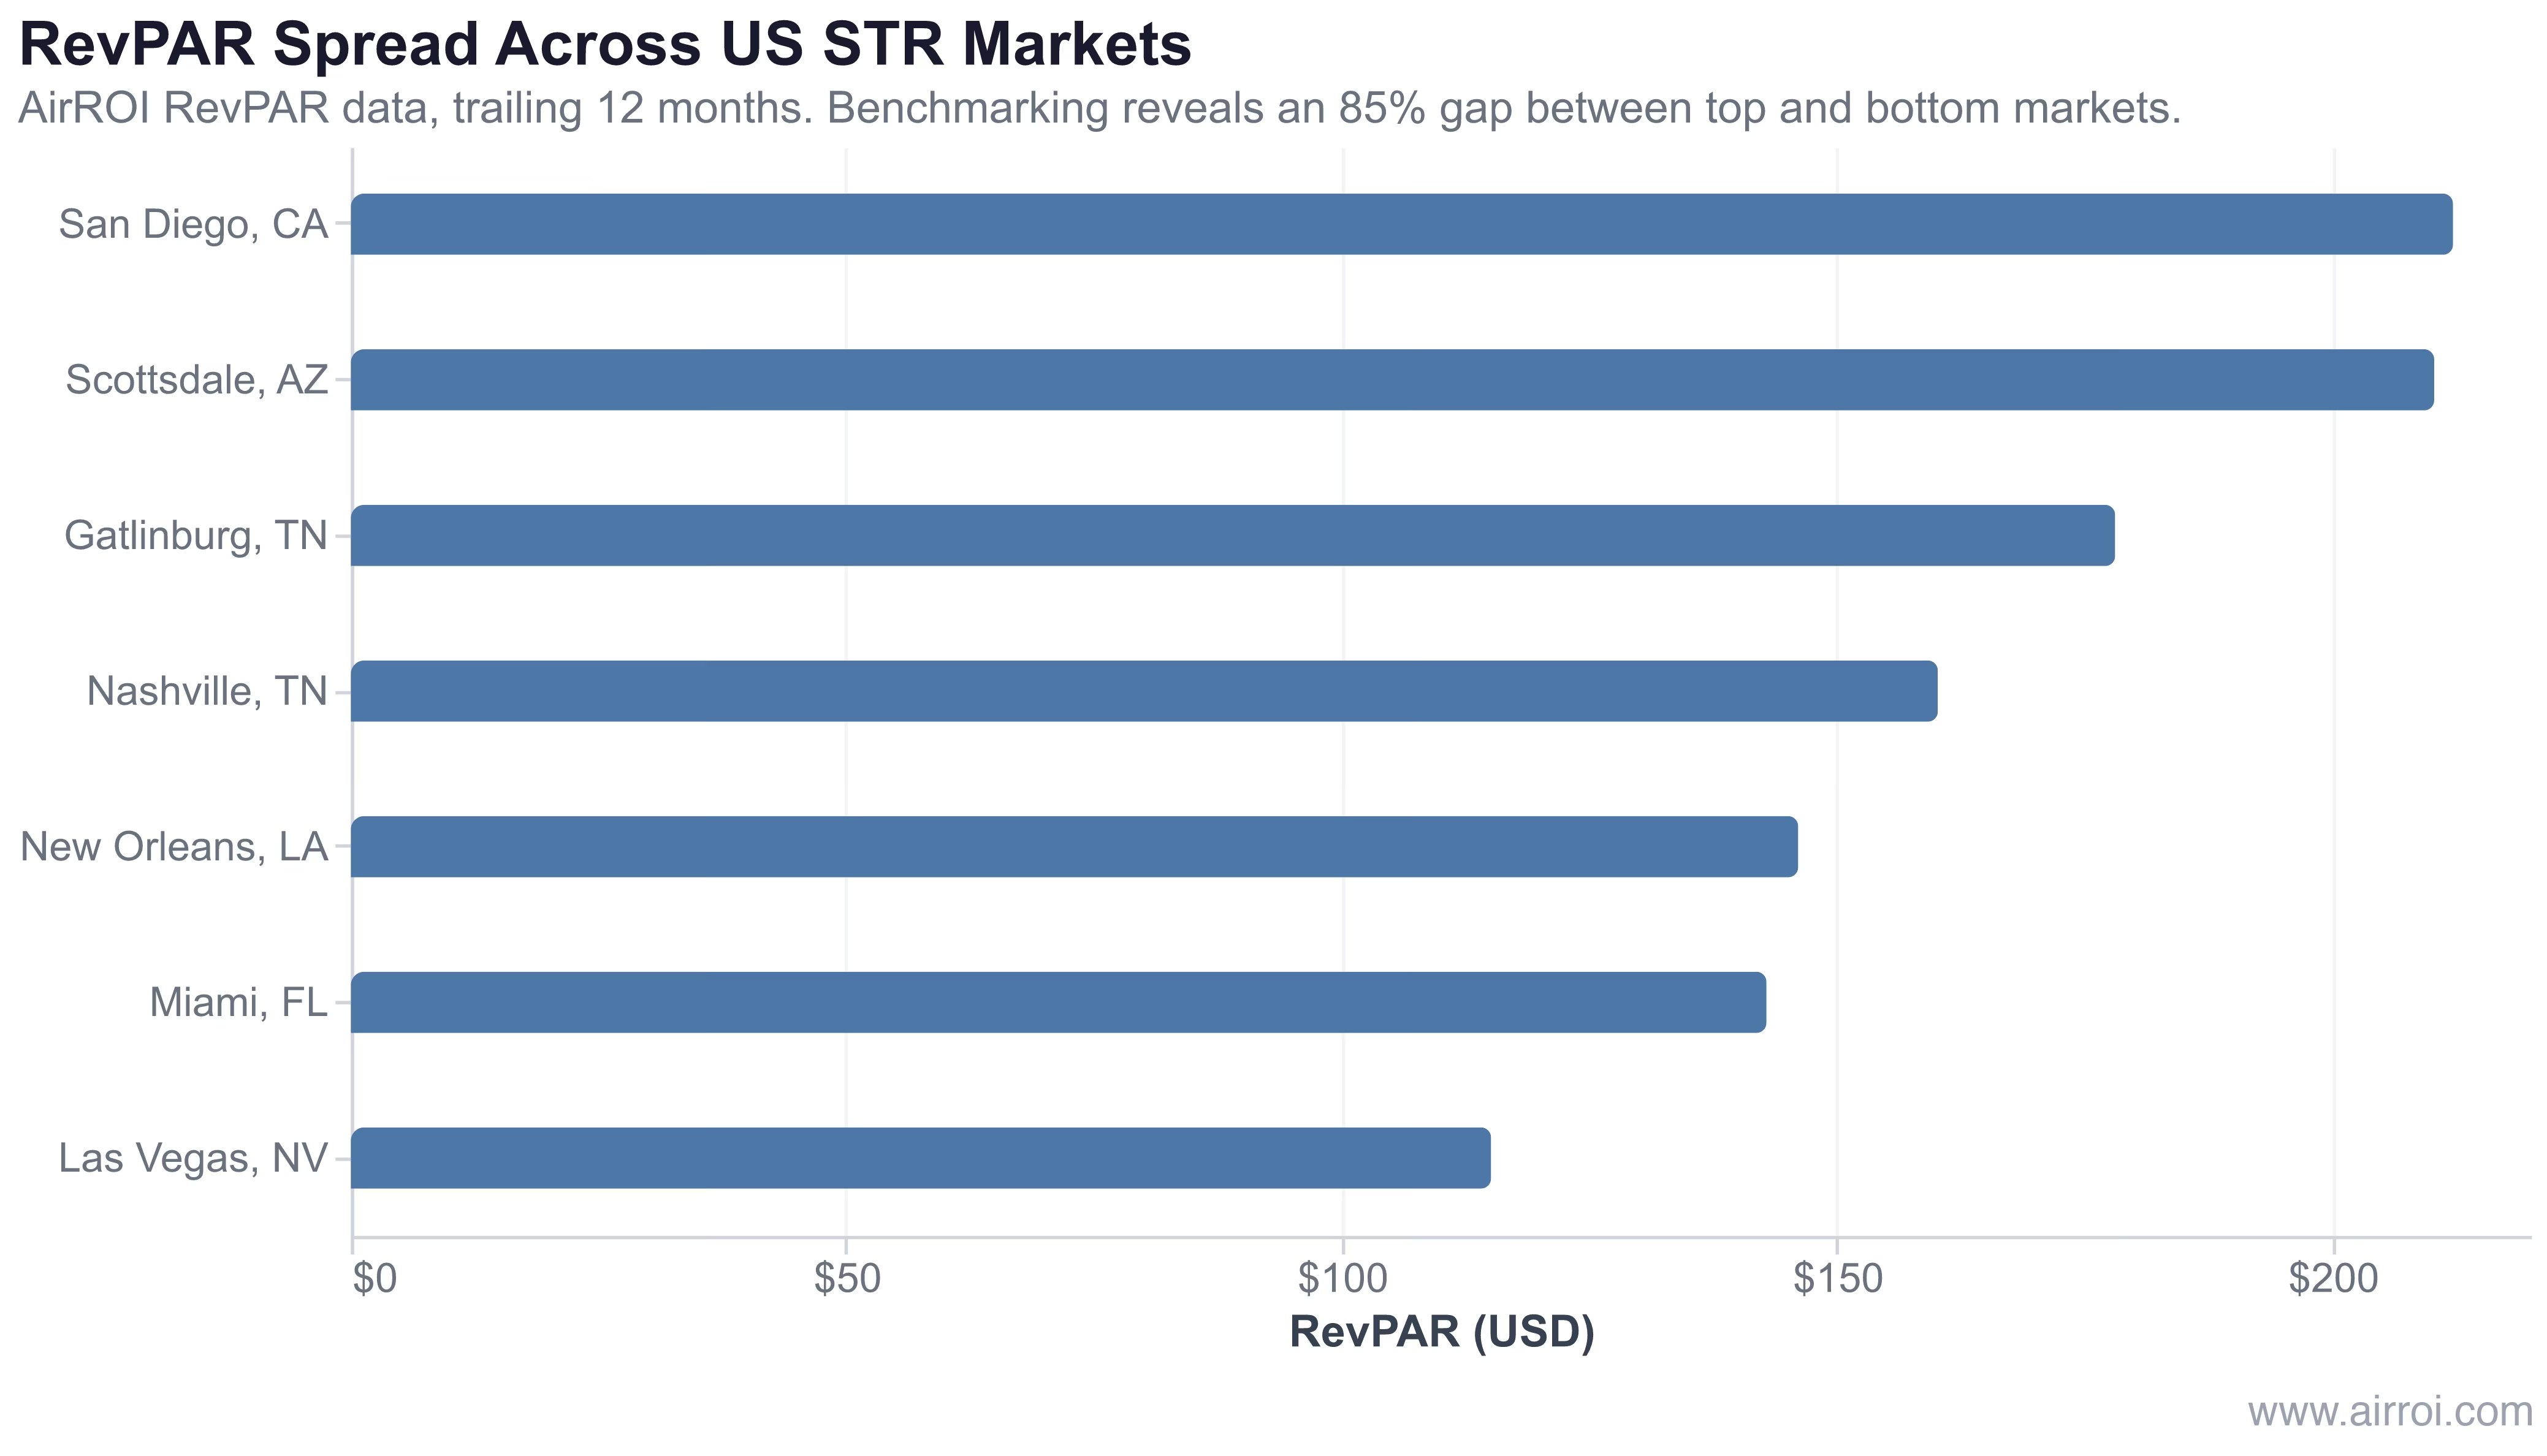
In AirROI's analysis of 58,505 active listings across these seven markets, the RevPAR spread is 85% from bottom to top — San Diego at $212.20 versus Las Vegas at $115.10. A 65% occupancy rate reads as underperformance in San Diego but outperformance in Las Vegas, where the market average sits at 42%. This is precisely why benchmarking against your specific market, not a national average, is the only valid reference.
A host who benchmarks against the wrong market will systematically either chase a number they cannot reach or leave revenue on the table they could have captured.
Key Metrics to Benchmark
| Metric | What It Reveals | Action if Below Benchmark |
|---|---|---|
| ADR | Pricing competitiveness | Raise rates if quality justifies it; improve listing quality if not |
| Occupancy Rate | Demand capture | Lower rates, reduce minimums, improve visibility |
| RevPAR | Overall revenue efficiency | Diagnose whether the gap is pricing, occupancy, or both |
| ALOS | Stay length patterns | Adjust minimum stays and length-of-stay discounts |
| Booking Lead Time | Demand timing | Adjust when you begin discounting unsold nights |
| Guest Rating | Quality perception | Address review feedback; upgrade amenities |
How to Benchmark Effectively
Build a tight comp set. Five to fifteen properties that genuinely match your listing. Loose comparisons produce misleading conclusions — a two-bedroom condo benchmarked against five-bedroom vacation homes will always show inflated ADR underperformance.
Separate market shifts from listing issues. If the entire market dropped 10% in RevPAR and your property dropped 8%, that is above-market performance, not underperformance. Benchmarking provides this context — raw metrics alone never do.
Frequently Asked Questions
Benchmarking is the practice of comparing your property's ADR, occupancy rate, and RevPAR against comparable properties in your market. It tells you whether you are outperforming, matching, or underperforming your competition, and isolates whether a performance change is listing-specific or a market-wide shift.
Select 5 to 15 comparable properties that match your listing in location (same neighborhood), property type, bedroom count, guest capacity, and amenity tier (pool, hot tub, etc.). Tighter comp sets produce more actionable data — a 10-property set of genuine peers is more useful than a 50-property set that includes mismatched listings.
Prioritize ADR (pricing competitiveness), occupancy rate (demand capture), and RevPAR (overall revenue efficiency). Also track average length of stay and booking lead time — both reveal demand timing patterns that affect how and when to adjust your pricing strategy.
Run a full benchmark monthly and always after a major pricing change. At minimum, benchmark quarterly to capture seasonal shifts. AirROI's market analytics refresh automatically, so you can check your competitive position at any time without manual data collection.
Below-benchmark RevPAR signals one of two problems: your ADR is too high and suppressing occupancy, or your ADR is too low and you are leaving money on the table. Separate the two by checking occupancy first. High ADR with low occupancy points to overpricing; low ADR with average occupancy points to underpricing relative to the quality you deliver.