
Revenue Per Available Night (RevPAN)
Key Takeaways
- RevPAN = Total Revenue ÷ Total Available Nights, or equivalently ADR × Occupancy Rate
- RevPAN is always equal to or lower than ADR — the gap quantifies the dollar cost of vacancy
- In AirROI data across seven major STR markets, RevPAN ranges from $130 (Austin) to $212 (San Diego), a 63% spread driven by both ADR and occupancy differences
- A rising RevPAN signals that your combined pricing and availability strategy is producing better returns per calendar night
- RevPAN is the correct metric for comparing properties with different availability calendars, unlike ADR which ignores vacant nights entirely
How to Calculate RevPAN
Formula (Method 1 — direct):
RevPAN = Total Revenue ÷ Total Available Nights
Formula (Method 2 — from components):
RevPAN = ADR × Occupancy Rate
Example: A listing earns $6,300 in a month with 30 available nights, 21 of which were booked.
- ADR = $6,300 ÷ 21 = $300.00
- Occupancy Rate = 21 ÷ 30 = 70.0%
- RevPAN = $300.00 × 0.70 = $210.00 (or $6,300 ÷ 30 = $210.00)
The $90 gap between ADR ($300) and RevPAN ($210) is the revenue impact of those 9 vacant nights. Filling just 3 more of them at $300 each would raise RevPAN to $240 — a 14% gain with no change in pricing whatsoever.
RevPAN vs ADR vs Occupancy: The Full Picture
RevPAN is the product of its two components. Tracking all three together shows which lever is working and which is failing:
| Metric | What it measures | Blind spot |
|---|---|---|
| ADR | Revenue per booked night | Ignores vacant nights entirely |
| Occupancy Rate | Share of available nights that are sold | Ignores price — filling cheap is easy |
| RevPAN | Revenue per available night | None — integrates both price and volume |
Two listings with identical ADR can post RevPAN values that differ by 30% or more if their occupancy rates diverge. This makes RevPAN the decisive metric for comparing a high-priced, low-occupancy listing against a moderate-priced, high-occupancy one — a common strategic tradeoff hosts face when setting minimum-night policies and seasonal pricing.
Real RevPAN Data Across Major STR Markets
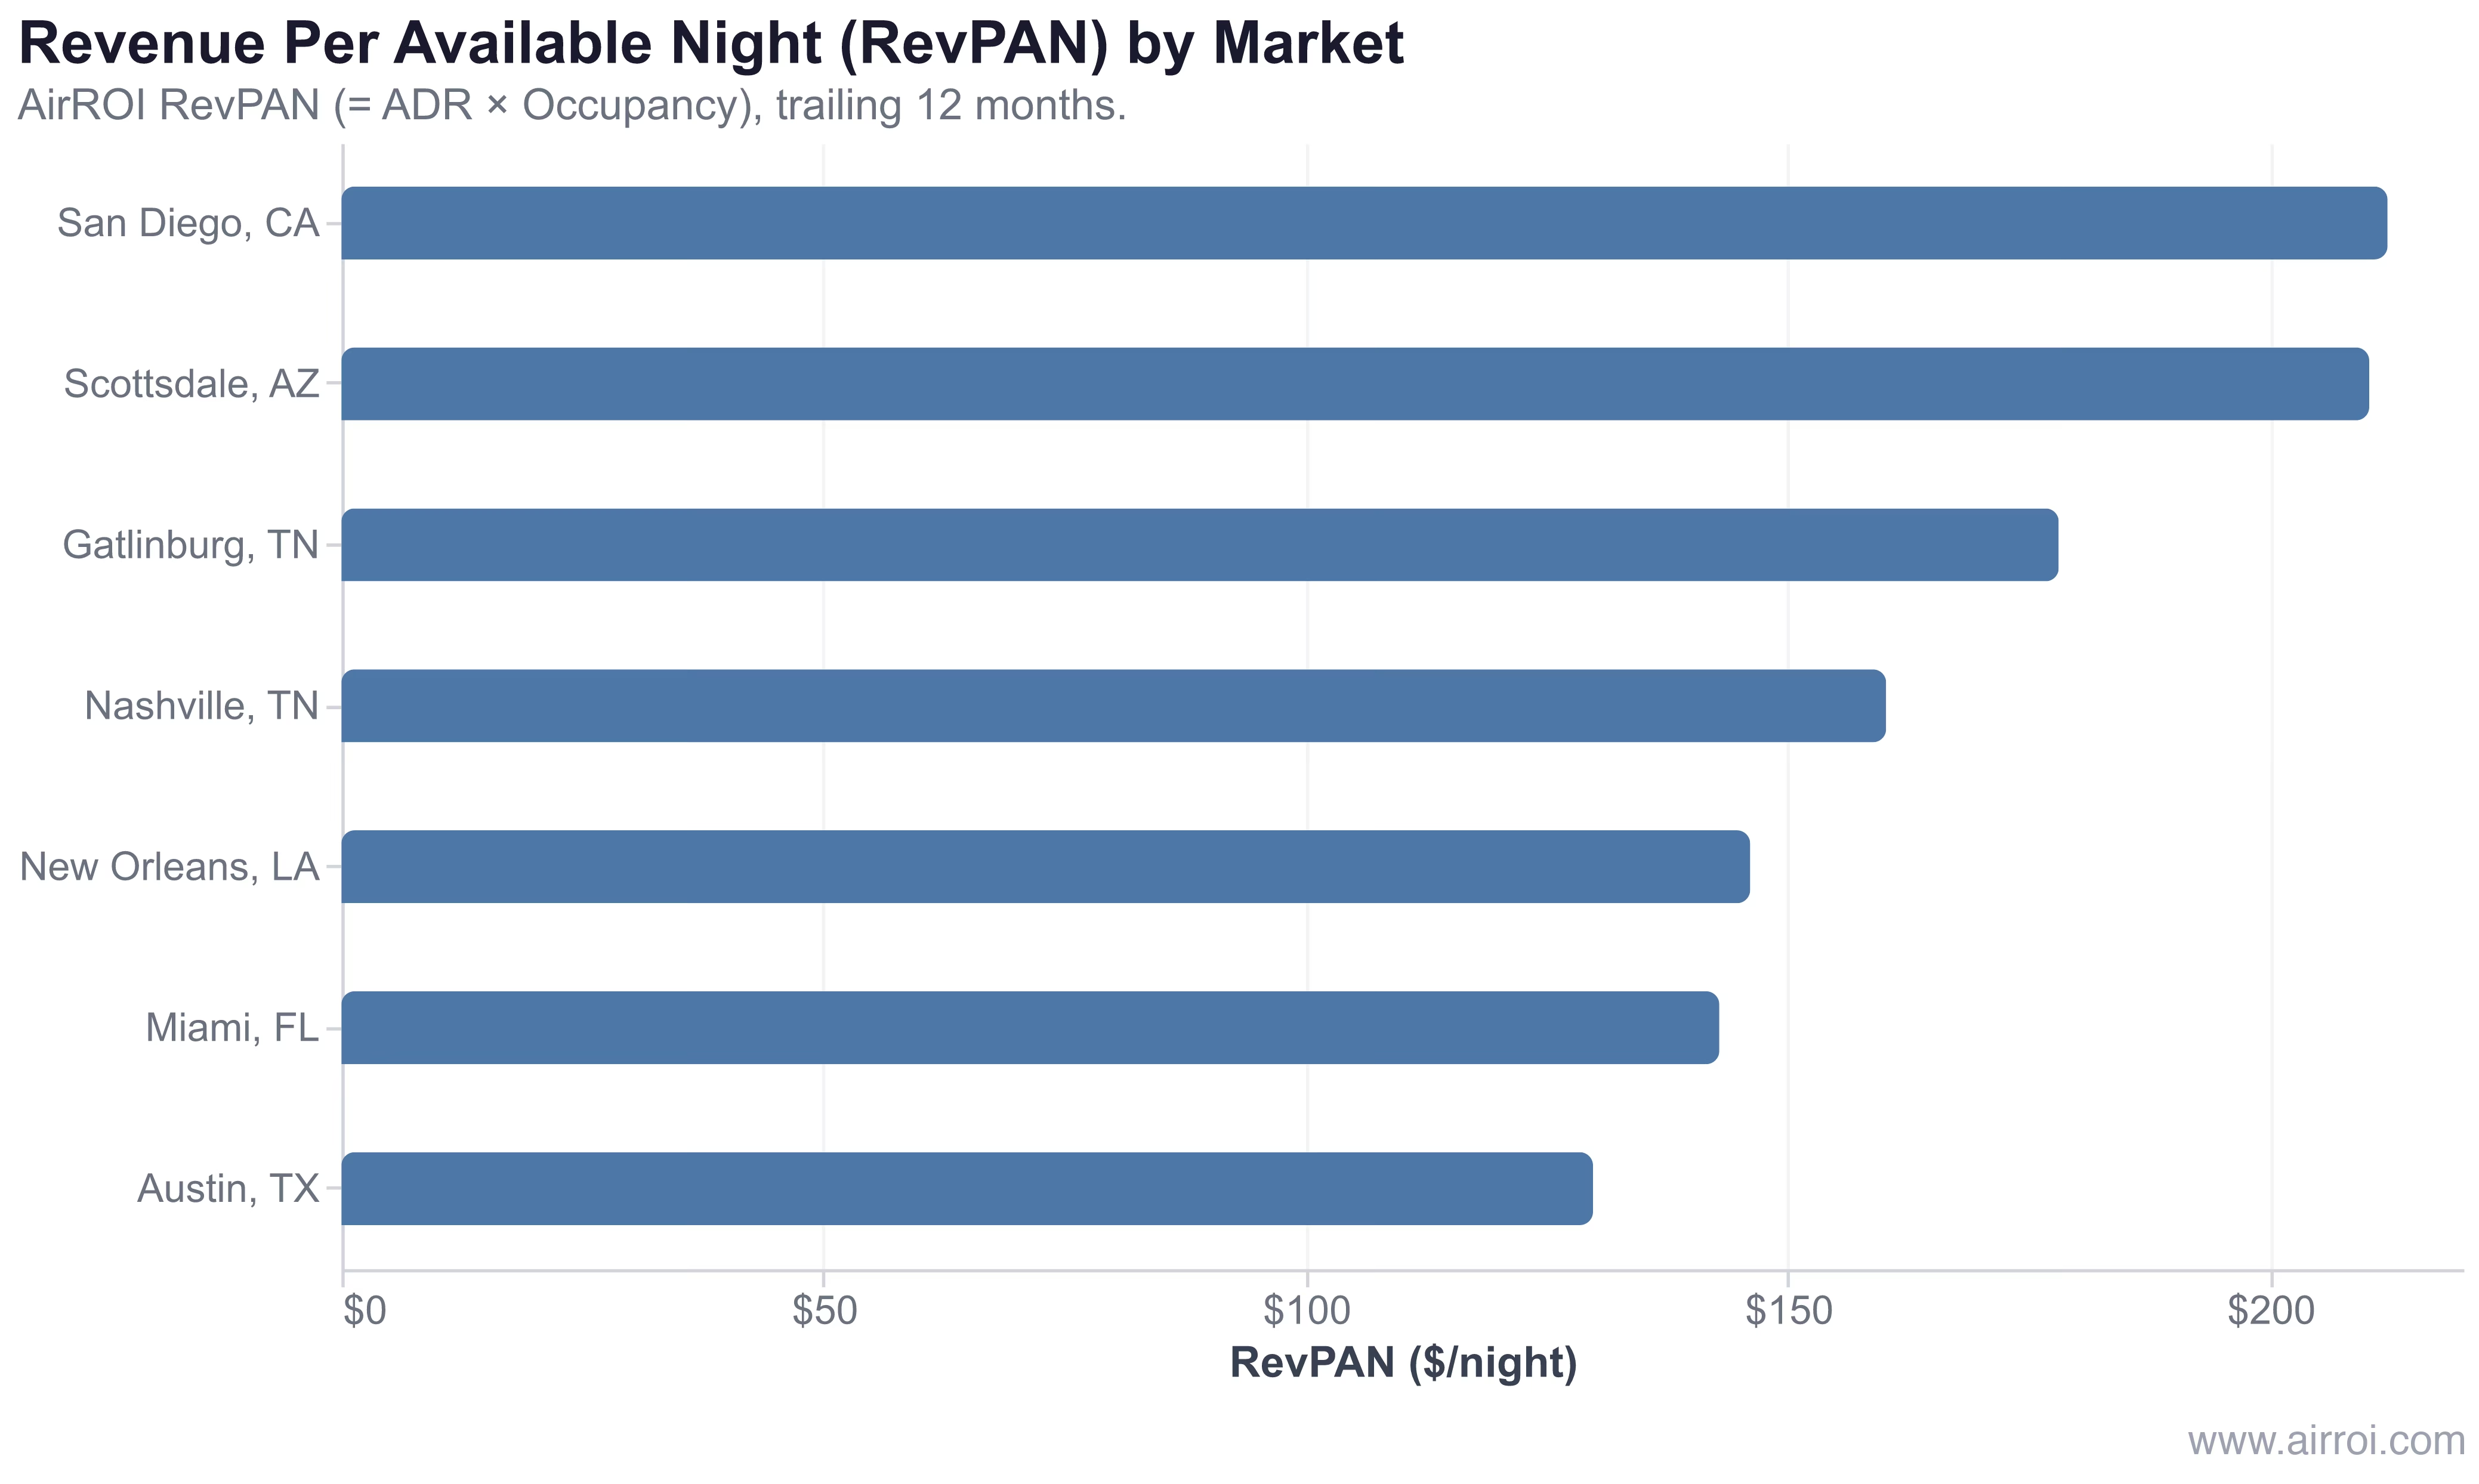
In AirROI's analysis of more than 45,000 active listings across seven US markets, RevPAN ranges from $130 in Austin to $212 in San Diego — a 63% spread that reflects both differences in nightly rates and in how effectively hosts convert available nights into paid nights.
| Market | ADR | Occupancy | RevPAN | Active Listings |
|---|---|---|---|---|
| San Diego, CA | $394.90 | 53% | $212.20 | 9,560 |
| Scottsdale, AZ | $421.10 | 49% | $210.30 | 4,310 |
| Gatlinburg, TN | $376.50 | 47% | $178.10 | 3,622 |
| Nashville, TN | $353.60 | 47% | $160.20 | 6,165 |
| New Orleans, LA | $335.20 | 44% | $146.10 | 5,007 |
| Miami, FL | $291.00 | 49% | $142.90 | 7,905 |
| Austin, TX | $297.70 | 44% | $129.80 | 8,774 |
Note that Scottsdale's ADR ($421) exceeds San Diego's ($395), yet the markets post nearly identical RevPAN values — Scottsdale's 4-point occupancy deficit ($421 × 49% = $206 vs $395 × 53% = $209) nearly erases the rate advantage. RevPAN surfaces this tradeoff in a single number.
A market's RevPAN is ultimately a vote on how efficiently its inventory converts available calendar nights into earned revenue — and a listing that beats the local RevPAN median by 15% is outperforming on both price and demand capture simultaneously.
Why RevPAN Matters for Airbnb Hosts
True revenue picture: RevPAN measures what each calendar night is actually worth — not what you earned on the nights someone stayed, but what you earned per night including the ones you didn't fill. It is the honest answer to "how is my listing actually performing?"
Portfolio benchmarking: For multi-property operators, RevPAN creates a common currency to rank listings regardless of their pricing tier. A budget cabin at $90 RevPAN and a luxury villa at $320 RevPAN can both be evaluated as shares of their respective market medians — which is the right frame for deciding where to invest improvement effort.
How to Improve Your RevPAN
Optimize minimum-night requirements. A 3-night minimum eliminates single-night orphan gaps between bookings but can create multi-night gaps if demand is soft. Test a 2-night minimum during shoulder season and measure whether RevPAN rises even if ADR dips slightly — the occupancy gain often more than offsets the rate concession.
Improve average length of stay. Longer stays reduce turnover gaps and cleaning costs. A listing that averages 4-night stays has roughly half the potential gap-night exposure of one averaging 2-night stays — and cleaning fees amortized across more nights lower the effective cost per available night as well.
Frequently Asked Questions
ADR only counts nights that were actually booked, while RevPAN divides total revenue by all available nights — booked or vacant. RevPAN is always equal to or lower than ADR, and the gap between the two reveals precisely how many dollars of revenue you are leaving on the table through vacancy. A listing with a $300 ADR but 50% occupancy has a RevPAN of just $150.
Divide total revenue by total available nights: RevPAN = Total Revenue ÷ Available Nights. Equivalently, multiply ADR by occupancy rate: RevPAN = ADR × Occupancy Rate. For example, a listing that earns $6,300 across 30 available nights has a RevPAN of $210 — the same result as a $300 ADR multiplied by 70% occupancy.
Conceptually, yes — both divide total revenue by available inventory. RevPAR (Revenue Per Available Room) is the hospitality-industry term applied across a hotel's room inventory, while RevPAN (Revenue Per Available Night) applies the same logic to a single STR listing's calendar nights. The math is identical; the terminology reflects the difference between hotel rooms and rental nights.
RevPAN varies widely by market. In AirROI's trailing-12-month data, San Diego leads at $212 and Austin sits at $130. A strong RevPAN is one that exceeds your all-in cost per available night — mortgage, taxes, insurance, cleaning amortized across all nights. Compare your RevPAN against market medians, not national averages, since local occupancy and ADR patterns drive the figure.
RevPAN improves when ADR rises, occupancy rises, or both. Practical levers include dynamic pricing to capture demand spikes, last-minute discounts to fill gaps, and minimum-night policies tuned to reduce turnover gaps. Reducing vacant nights has a direct, dollar-for-dollar impact: each night filled at your ADR adds that full amount to RevPAN.