AirROI ranking · 202628 markets ranked
Best Places to Buy an Airbnb in Pennsylvania (2026)
Penn Forest Township is the best place to buy an Airbnb in Pennsylvania in 2026, according to AirROI's ranking of 28 markets. Its listings averaged $52,200 in revenue over the 12 months to September 2026 and were booked on 39% of nights. It leads on the blend rather than on any one measure, placing 6th of 28 for market size and 7th of 28 for revenue per listing. Albrightsville and East Stroudsburg come next.
- Markets tracked
- 252
- Active Airbnb listings
- 20,500
- Avg. revenue per listing
- $32,700
- Occupancy rate
- 39%
- Avg. nightly rate
- $295
- Revenue change, typical market
- +8%
The short answer
Pennsylvania Airbnb Market at a Glance
Across Pennsylvania, the 20,500 active Airbnb listings tracked by AirROI, a short-term-rental data firm, averaged $32,700 over the same period. They were booked on 39% of nights at about $295 a night; the ranking covers the 28 markets with at least 100 active listings. Revenue per listing rose in 16 of the 25 ranked markets with a comparable year of data, by 8% in the typical one.
The ranking weighs revenue per listing most, then occupancy and market size, then how evenly income spreads across the year and how it changed on the year. It reflects rental performance, not purchase prices or local short-term rental rules. How the ranking works.
Where the top 10 Airbnb markets in Pennsylvania are
Each dot is one of the 252 markets AirROI tracks in Pennsylvania (4 outlying ones fall outside the map), sized by active listings and coloured by average revenue per listing. Select a number to jump to its profile.
Top 10
The Top 10 Airbnb Markets in Pennsylvania
Each profile draws on the market's full AirROI report: how it earns, when in the year, who books and what sells. Monthly figures are averages per listing active in that month, so twelve of them add up to more than the annual average, which also counts listings that operated for only part of the year.
| # | Market | Avg. revenue | Occupancy |
|---|---|---|---|
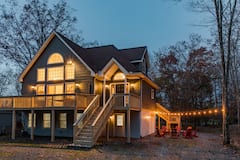 Penn Forest Township Large market · High earnings | $52,200 | 39% | |
 Albrightsville High earnings · High occupancy | $55,600 | 43% | |
 East Stroudsburg High earnings · High occupancy | $63,600 | 42% | |
| 4 |  Stroud Township High earnings · Growing revenue | $72,300 | 39% |
| 5 |  Middle Smithfield Township Growing revenue · High earnings | $51,400 | 41% |
| 6 | 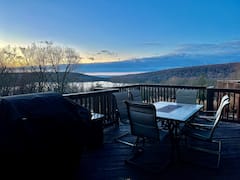 Kidder Township High earnings · Large market | $54,500 | 32% |
| 7 | 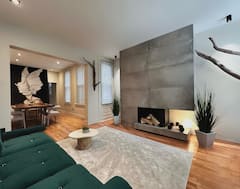 Pittsburgh Large market · High occupancy | $28,300 | 42% |
| 8 |  Jim Thorpe High occupancy · Growing revenue | $38,400 | 44% |
| 9 |  Lancaster High occupancy · Year-round demand | $30,500 | 46% |
| 10 |  Coolbaugh Township Large market · Growing revenue | $43,800 | 35% |
1. Penn Forest Township
Known for: Large market · High earnings
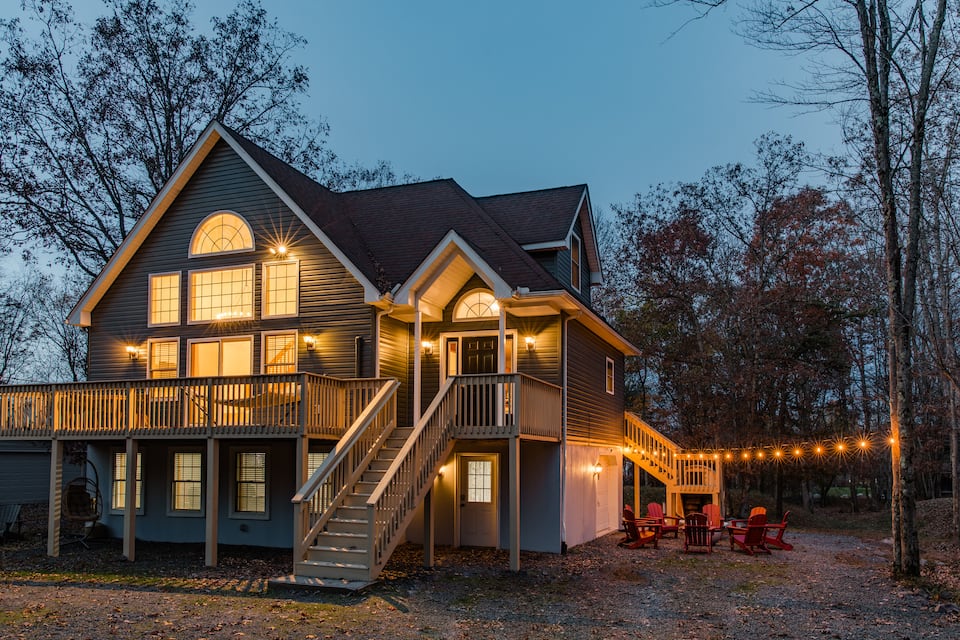

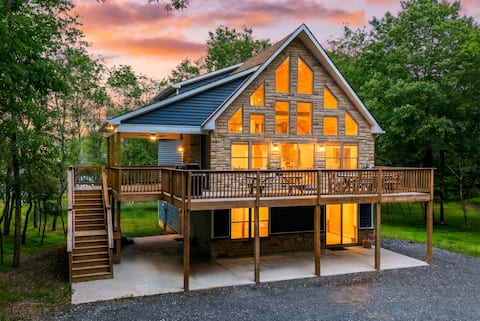
Top-earning Airbnb listings in Penn Forest Township - Avg. revenue
- $52,200 +11% vs. last year
- Occupancy
- 39%
- Nightly rate
- $380
- Active listings
- 368
Where it places among the 28 ranked markets in Pennsylvania
- Revenue 7th of 28
- Occupancy 11th of 28
- Market size 6th of 28
- Year-round 9th of 28
- Growth 10th of 25
- How it earns
- Penn Forest Township listings charge about $380 a night, 29% above the Pennsylvania average, and are booked on 39% of nights. That adds up to $52,200 per listing over the year, the seventh-highest of the 28 ranked markets. A typical listing takes in about $4,090 a month; the top quarter clear $6,830 or more. Revenue per listing rose 11% over the year, helped by nightly rates 13% higher.
- When it earns
- Penn Forest Township's season runs from June to August, peaking in July at about $8,300 per listing; April, the quietest month, brings in about $3,340.
- What sells
- Big homes set the market: 94% of entire homes have three or more bedrooms, against about 70% in the typical market in Pennsylvania, and houses make up 76% of supply.
- Who it suits
- It suits buyers who want a large home for groups and families and can carry costs through a quiet April.
Revenue per listing by month
$8,300 $3,340- Median listing
- $4,090/mo
- Top 25% of listings
- $6,830+/mo
- Booked ahead
- 44 days
- Average stay
- 3 nights
- Most common home size
- 3 bedrooms
- Superhosts
- 68%
Areas in the full report: Lake Harmony · Jim Thorpe · Poconos
Full Penn Forest Township Airbnb report2. Albrightsville
Known for: High earnings · High occupancy
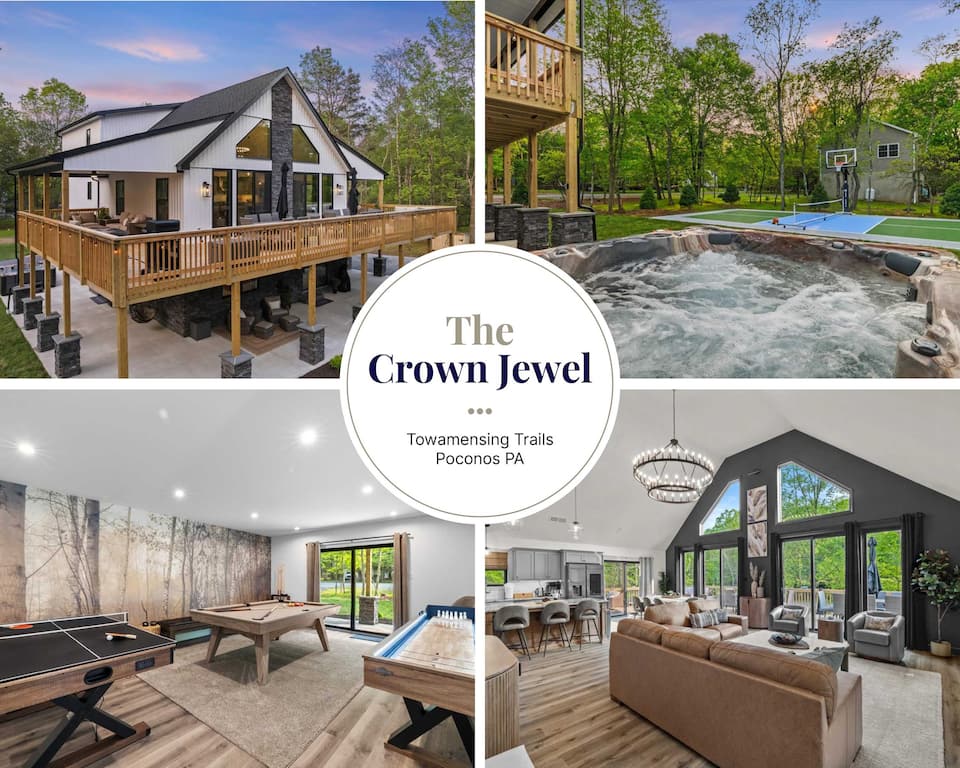

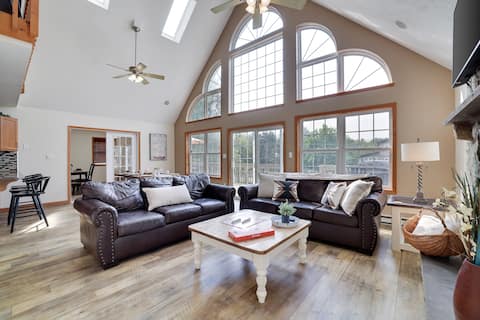
Top-earning Airbnb listings in Albrightsville - Avg. revenue
- $55,600
- Occupancy
- 43%
- Nightly rate
- $435
- Active listings
- 130
Where it places among the 28 ranked markets in Pennsylvania
- Revenue 3rd of 28
- Occupancy 5th of 28
- Market size 19th of 28
- Year-round 13th of 28
- Growth No prior year
- How it earns
- Albrightsville commands premium rates, about $435 a night, and still books 43% of nights, 4 points above the Pennsylvania average. Listings averaged $55,600 in revenue over the year, the third-highest of the 28 ranked markets. In a typical month the median listing brings in about $5,610, and the best quarter clear $9,280. With 130 listings it is a small market, so its averages can move more from year to year.
- When it earns
- Albrightsville has two seasons, June–August and November–December. August is the strongest month at about $10,800 per listing, and April the quietest at about $3,980. Guests book later than in most of Pennsylvania, about 33 days ahead against roughly 45 for the typical market in Pennsylvania; stays average 3 nights.
- What sells
- Big homes set the market: 92% of entire homes have three or more bedrooms, against about 70% in the typical market in Pennsylvania, and houses make up 85% of supply.
- Who it suits
- Best for buyers who can furnish and price for a premium stay and can ride out a slow April.
Revenue per listing by month
$10,800 $3,980- Median listing
- $5,610/mo
- Top 25% of listings
- $9,280+/mo
- Booked ahead
- 33 days
- Average stay
- 3 nights
- Most common home size
- 3 bedrooms
- Superhosts
- 70%
3. East Stroudsburg
Known for: High earnings · High occupancy
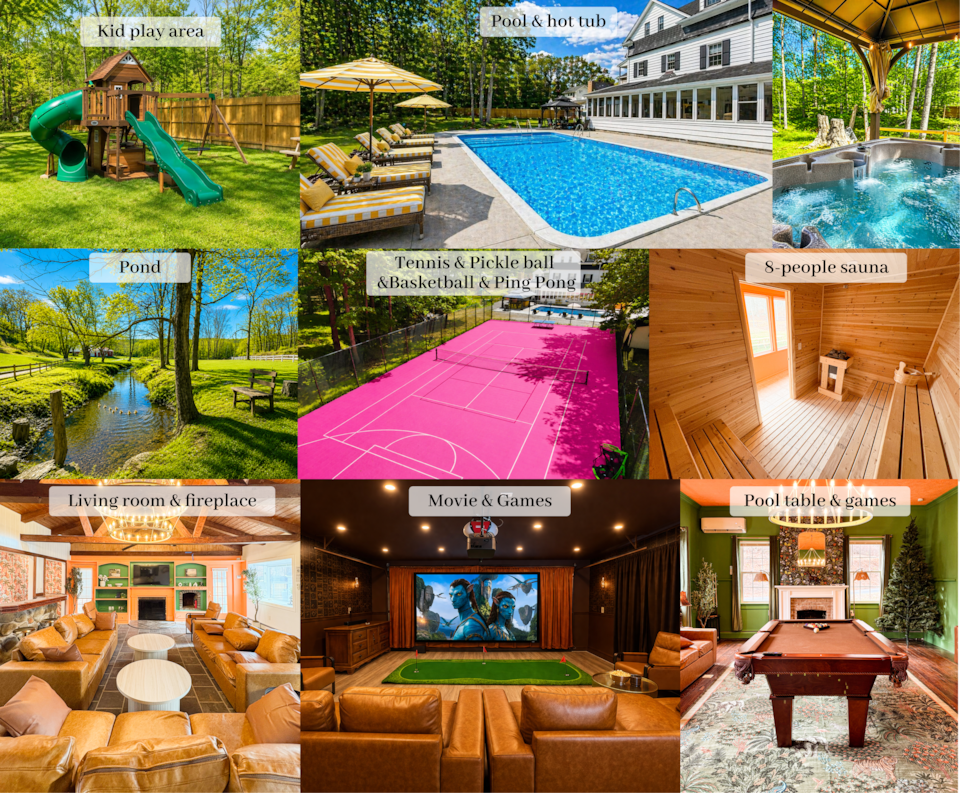
Top-earning Airbnb listings in East Stroudsburg - Avg. revenue
- $63,600
- Occupancy
- 42%
- Nightly rate
- $465
- Active listings
- 163
Where it places among the 28 ranked markets in Pennsylvania
- Revenue 2nd of 28
- Occupancy 8th of 28
- Market size 14th of 28
- Year-round 20th of 28
- Growth No prior year
- How it earns
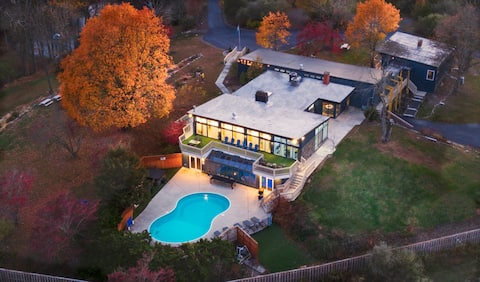
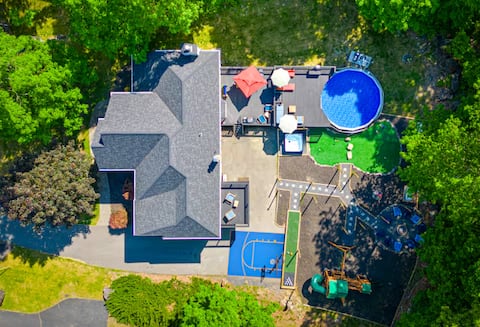
- East Stroudsburg earns on price and volume at once: guests pay about $465 a night, and listings are booked on 42% of nights, 3 points above the Pennsylvania average. Average revenue per listing came to $63,600, the second-highest of the 28 ranked markets. Month to month, the median listing earns about $5,970 and a top-quarter listing $10,600 or more. Its 163 listings make it one of the smaller ranked markets, so its figures are less settled than those of larger ones.
- When it earns
- Revenue in East Stroudsburg concentrates from June to August: August earns about $11,400 per listing, about three times as much as October. Bookings arrive closer to the date than in most of Pennsylvania, about 31 days before check-in, and guests stay about 3 nights.
- Guest expectations
- Average ratings (4.76 stars) trail the typical market in Pennsylvania (4.84), which leaves room for a well-run listing to stand out.
- What sells
- Big homes set the market: 85% of entire homes have three or more bedrooms, against about 70% in the typical market in Pennsylvania, and houses make up 76% of supply.
- Who it suits
- A good fit for buyers who can furnish and price for a premium stay and are prepared for thin bookings around October.
Revenue per listing by month
$11,400 $3,720- Median listing
- $5,970/mo
- Top 25% of listings
- $10,600+/mo
- Booked ahead
- 31 days
- Average stay
- 3 nights
- Most common home size
- 5+ bedrooms
- Superhosts
- 66%
4. Stroud Township
Known for: High earnings · Growing revenue


Top-earning Airbnb listings in Stroud Township - Avg. revenue
- $72,300 +28% vs. last year
- Occupancy
- 39%
- Nightly rate
- $520
- Active listings
- 110
Where it places among the 28 ranked markets in Pennsylvania
- Revenue 1st of 28
- Occupancy 12th of 28
- Market size 25th of 28
- Year-round 15th of 28
- Growth 1st of 25
- How it earns
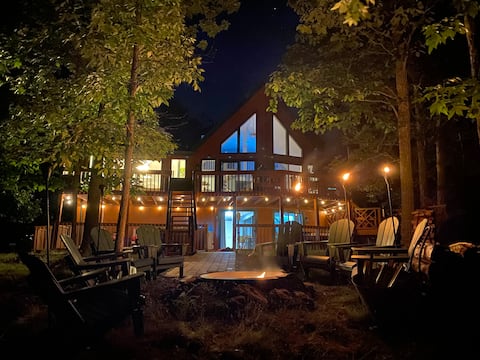
- Stroud Township earns on price: guests pay about $520 a night, 76% above the Pennsylvania average. That adds up to $72,300 per listing over the year, the highest of the 28 ranked markets. A typical listing takes in about $5,940 a month; the top quarter clear $10,600 or more. Revenue per listing rose 28% over the year, the biggest gain in Pennsylvania, helped by nightly rates 18% higher. With 110 listings it is a small market, so its averages can move more from year to year.
- When it earns
- In Stroud Township, the months from June to August earn above the yearly average, led by July at about $12,800 per listing; September is the low point at about $4,470.
- What sells
- Big homes set the market: 97% of entire homes have three or more bedrooms, against about 70% in the typical market in Pennsylvania, and houses make up 94% of supply.
- Who it suits
- It suits buyers who can furnish and price for a premium stay and can carry costs through a quiet September.
Revenue per listing by month
$12,800 $4,470- Median listing
- $5,940/mo
- Top 25% of listings
- $10,600+/mo
- Booked ahead
- 41 days
- Average stay
- 3 nights
- Most common home size
- 5+ bedrooms
- Superhosts
- 73%
5. Middle Smithfield Township
Known for: Growing revenue · High earnings


Top-earning Airbnb listings in Middle Smithfield Township - Avg. revenue
- $51,400 +19% vs. last year
- Occupancy
- 41%
- Nightly rate
- $390
- Active listings
- 147
Where it places among the 28 ranked markets in Pennsylvania
- Revenue 8th of 28
- Occupancy 9th of 28
- Market size 15th of 28
- Year-round 15th of 28
- Growth 2nd of 25
- How it earns
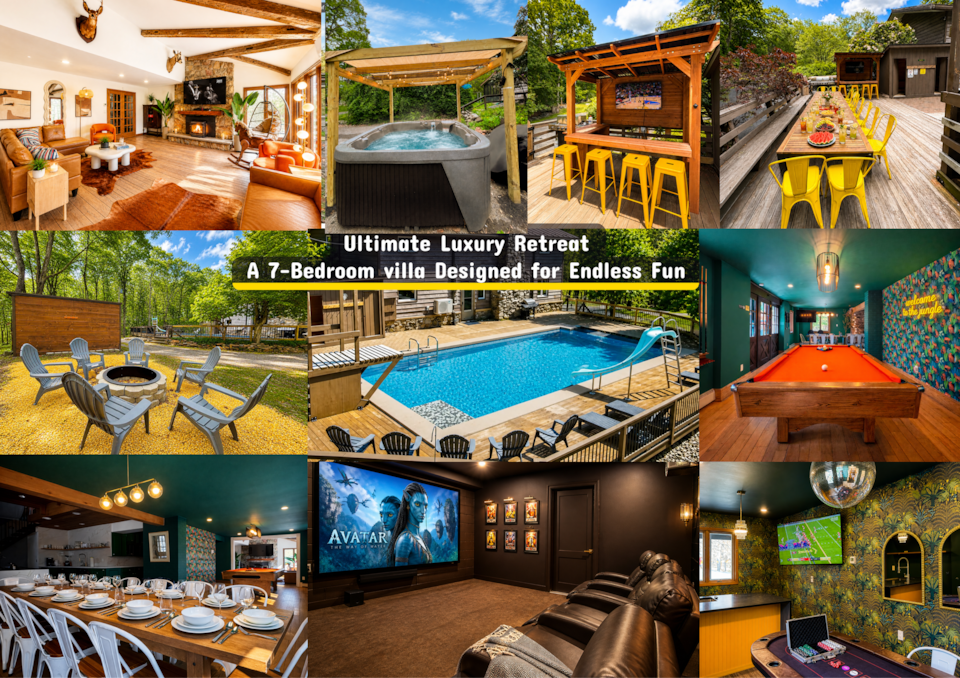
- Middle Smithfield Township listings charge about $390 a night, 31% above the Pennsylvania average, and are booked on 41% of nights. Listings averaged $51,400 in revenue over the year, the eighth-highest of the 28 ranked markets. In a typical month the median listing brings in about $3,720, and the best quarter clear $6,130. Revenue per listing rose 19% over the year, the second-biggest gain in Pennsylvania, helped by nightly rates 16% higher. Its 147 listings make it one of the smaller ranked markets, so its figures are less settled than those of larger ones.
- When it earns
- Middle Smithfield Township's season runs from June to August, peaking in July at about $9,070 per listing; March, the quietest month, brings in about $3,220.
- What sells
- The most common entire home has 3 bedrooms (43% of entire homes), and houses make up 71% of supply.
- Who it suits
- Best for buyers who can ride out a slow March.
Revenue per listing by month
$9,070 $3,220- Median listing
- $3,720/mo
- Top 25% of listings
- $6,130+/mo
- Booked ahead
- 43 days
- Average stay
- 3 nights
- Most common home size
- 3 bedrooms
- Superhosts
- 63%
6. Kidder Township
Known for: High earnings · Large market
Top-earning Airbnb listings in Kidder Township - Avg. revenue
- $54,500 +11% vs. last year
- Occupancy
- 32%
- Nightly rate
- $520
- Active listings
- 471
Where it places among the 28 ranked markets in Pennsylvania
- Revenue 4th of 28
- Occupancy 24th of 28
- Market size 5th of 28
- Year-round 15th of 28
- Growth 12th of 25
- How it earns
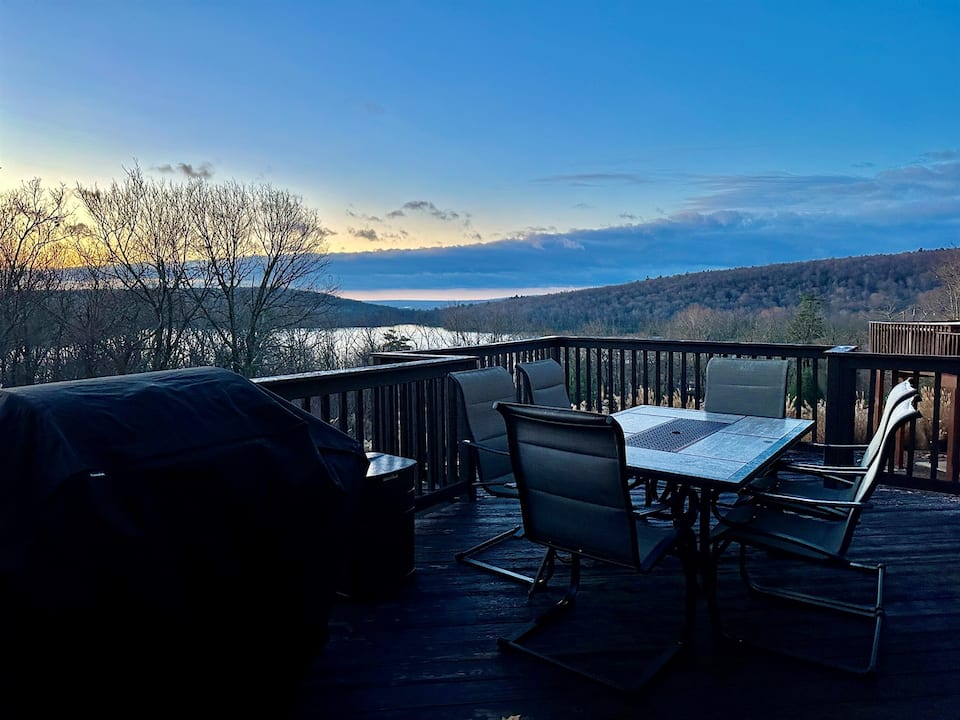
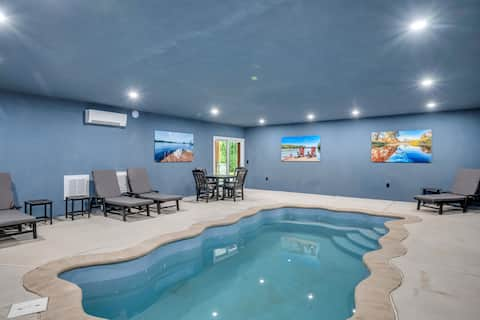
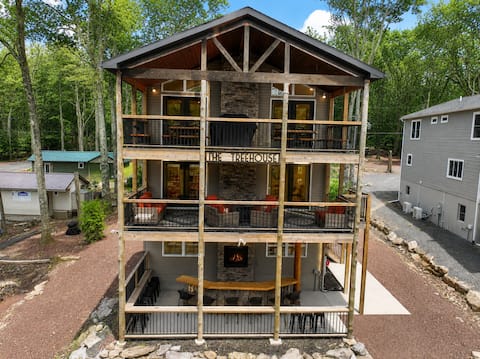
- Nightly rates set Kidder Township apart: about $520, 76% above the Pennsylvania average. Average revenue per listing came to $54,500, the fourth-highest of the 28 ranked markets. Month to month, the median listing earns about $4,030 and a top-quarter listing $7,290 or more. Revenue per listing rose 11% over the year, helped by nightly rates 18% higher.
- When it earns
- Revenue in Kidder Township concentrates from June to August: July earns about $9,320 per listing, about 2.9 times as much as March. Guests book early, about 60 days ahead against roughly 45 for the typical market in Pennsylvania, and stay about 3 nights.
- What sells
- Five-bedroom-plus homes lead the market (34% of entire homes), and houses make up 81% of supply.
- Who it suits
- A good fit for buyers who can furnish and price for a premium stay and are prepared for thin bookings around March.
Revenue per listing by month
$9,320 $3,260- Median listing
- $4,030/mo
- Top 25% of listings
- $7,290+/mo
- Booked ahead
- 60 days
- Average stay
- 3 nights
- Most common home size
- 5+ bedrooms
- Superhosts
- 60%
Areas in the full report: Lake Harmony · Poconos · Blakeslee
Full Kidder Township Airbnb report7. Pittsburgh
Known for: Large market · High occupancy

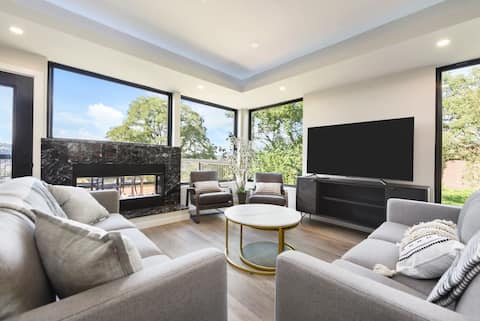
Top-earning Airbnb listings in Pittsburgh - Avg. revenue
- $28,300 +14% vs. last year
- Occupancy
- 42%
- Nightly rate
- $225
- Active listings
- 2,390
Where it places among the 28 ranked markets in Pennsylvania
- Revenue 22nd of 28
- Occupancy 6th of 28
- Market size 2nd of 28
- Year-round 8th of 28
- Growth 7th of 25
- How it earns
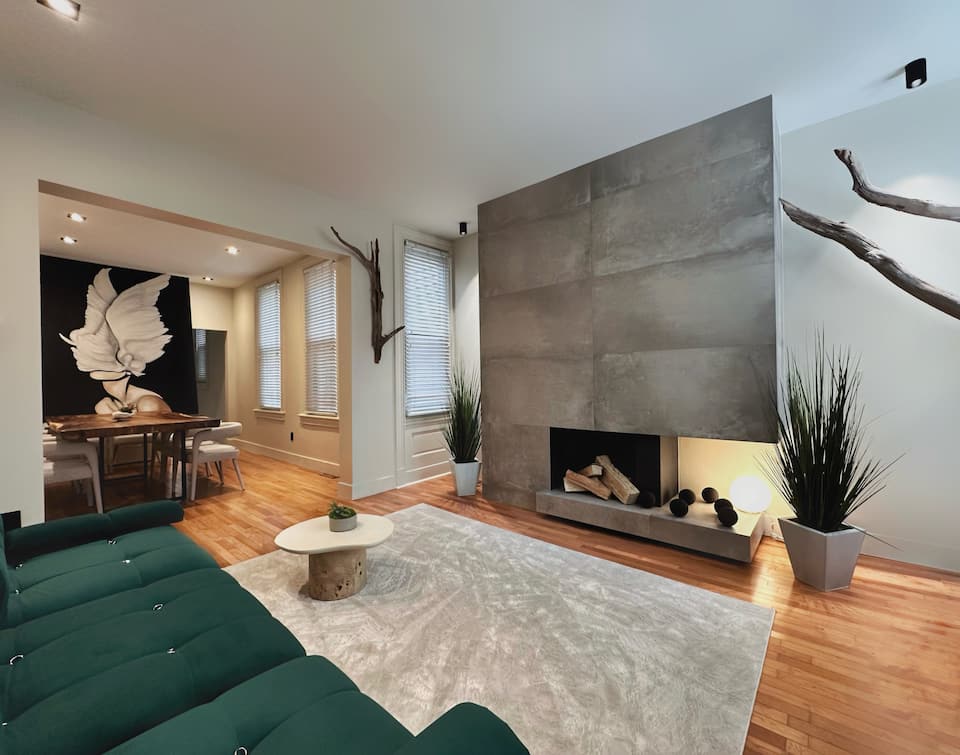
- Pittsburgh earns on volume. Rates run below the Pennsylvania average at about $225 a night, but listings book 42% of nights. Moderate rates keep revenue per listing at $28,300, 14% below the Pennsylvania average. Its place at #7 rests on market size (2nd of 28) and occupancy (6th of 28) rather than on revenue per listing. A typical listing takes in about $2,480 a month; the top quarter clear $4,260 or more. Revenue per listing rose 14% over the year, helped by nightly rates 32% higher, even as the number of listings grew 34%.
- When it earns
- Revenue in Pittsburgh peaks twice, over April–August and again over October–November; June leads at about $3,910 per listing, while February brings in about $1,740. Trips run long, about 5 nights on average against 4 nights for the typical market in Pennsylvania, booked about 45 days ahead.
- What sells
- Smaller places set the market: only 39% of entire homes have three or more bedrooms, against about 70% in the typical market in Pennsylvania.
- Guest expectations
- Average ratings (4.78 stars) trail the typical market in Pennsylvania (4.84), which leaves room for a well-run listing to stand out.
- Who it suits
- It suits buyers who prefer a smaller one- or two-bedroom place and would rather price for occupancy than for rate.
Revenue per listing by month
$3,910 $1,740- Median listing
- $2,480/mo
- Top 25% of listings
- $4,260+/mo
- Booked ahead
- 45 days
- Average stay
- 5 nights
- Most common home size
- 1 bedroom
- Superhosts
- 57%
Areas in the full report: Strip District · Lawrenceville · North Shore
Full Pittsburgh Airbnb report8. Jim Thorpe
Known for: High occupancy · Growing revenue
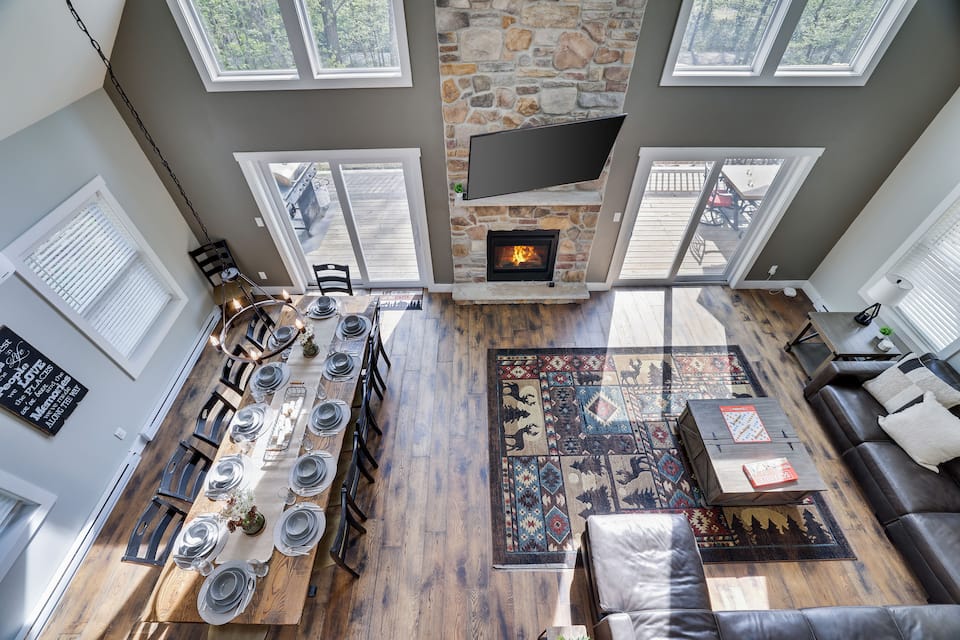
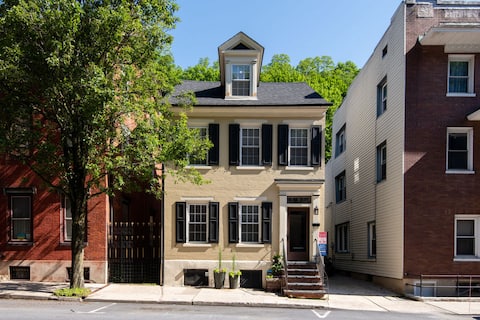
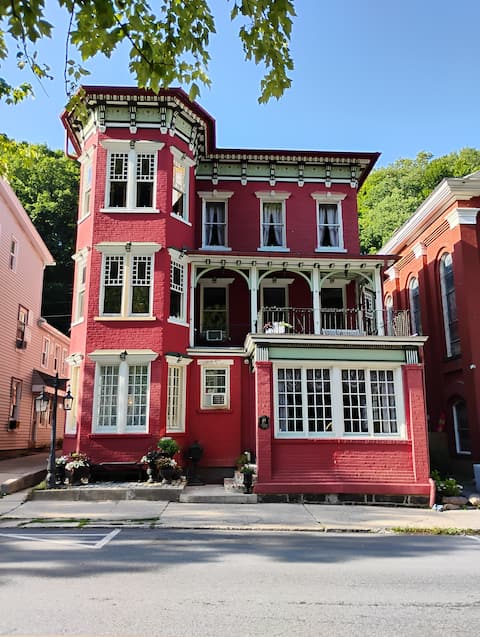
Top-earning Airbnb listings in Jim Thorpe - Avg. revenue
- $38,400 +15% vs. last year
- Occupancy
- 44%
- Nightly rate
- $280
- Active listings
- 120
Where it places among the 28 ranked markets in Pennsylvania
- Revenue 15th of 28
- Occupancy 3rd of 28
- Market size 21st of 28
- Year-round 6th of 28
- Growth 5th of 25
- How it earns
- Jim Thorpe fills more nights than most of Pennsylvania: 44% of them, the third-highest occupancy of the 28 ranked markets, at about $280 a night. Listings averaged $38,400 in revenue over the year, 17% above the Pennsylvania average. Its place at #8 rests on occupancy (3rd of 28) and revenue growth (5th of 25) rather than on revenue per listing. In a typical month the median listing brings in about $3,250, and the best quarter clear $4,770. Revenue per listing rose 15% over the year, helped by nightly rates 17% higher, even as the number of listings grew 41%. With 120 listings it is a small market, so its averages can move more from year to year.
- When it earns
- In Jim Thorpe, the months from June to August earn above the yearly average, led by August at about $4,940 per listing; March is the low point at about $2,360. Stays are shorter than in most of Pennsylvania, about 2.8 nights, so listings turn over often; guests book about 53 days ahead.
- What sells
- Few listings are large: just 48% have three or more bedrooms, against about 70% in the typical market in Pennsylvania.
- Guest expectations
- Guests rate listings highly, 4.91 stars on average against 4.84 for the typical market in Pennsylvania, so reviews set a high bar.
- Who it suits
- Best for buyers who prefer a smaller one- or two-bedroom place.
Revenue per listing by month
$4,940 $2,360- Median listing
- $3,250/mo
- Top 25% of listings
- $4,770+/mo
- Booked ahead
- 53 days
- Average stay
- 2.8 nights
- Most common home size
- 3 bedrooms
- Superhosts
- 82%
9. Lancaster
Known for: High occupancy · Year-round demand
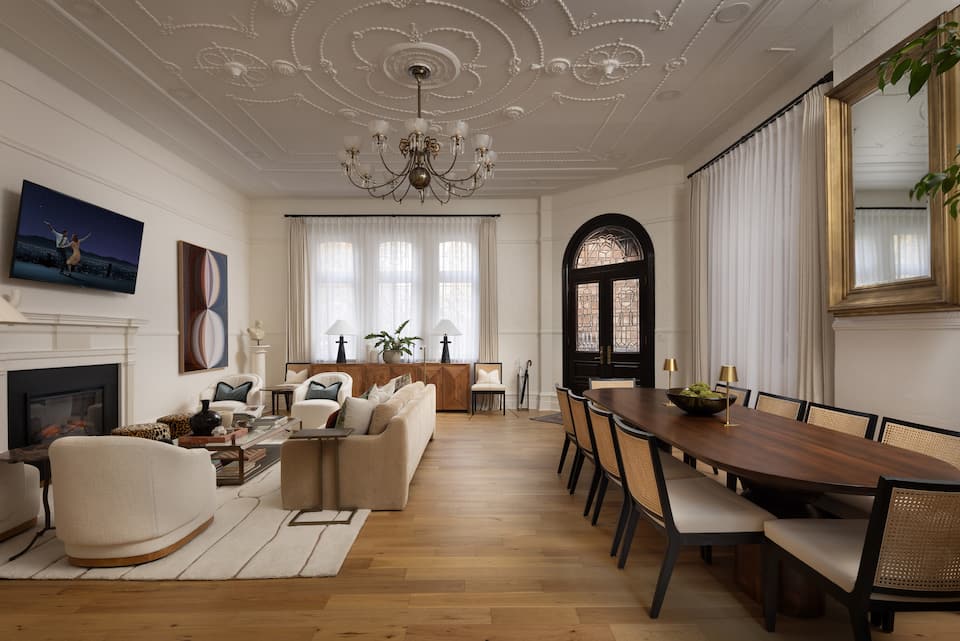
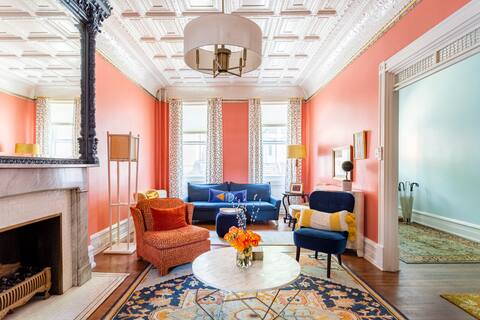

Top-earning Airbnb listings in Lancaster - Avg. revenue
- $30,500 +15% vs. last year
- Occupancy
- 46%
- Nightly rate
- $205
- Active listings
- 223
Where it places among the 28 ranked markets in Pennsylvania
- Revenue 21st of 28
- Occupancy 2nd of 28
- Market size 12th of 28
- Year-round 5th of 28
- Growth 6th of 25
- How it earns
- Rates in Lancaster sit below the Pennsylvania average, at about $205 a night, but listings are booked on 46% of nights. Moderate rates keep revenue per listing at $30,500, 7% below the Pennsylvania average. Its place at #9 rests on occupancy (2nd of 28) and year-round demand (5th of 28) rather than on revenue per listing. Month to month, the median listing earns about $2,850 and a top-quarter listing $4,300 or more. Revenue per listing rose 15% over the year, helped by nightly rates 17% higher. Its 223 listings make it one of the smaller ranked markets, so its figures are less settled than those of larger ones.
- When it earns
- Lancaster's season runs from May to August, peaking in July at about $4,020 per listing; February, the quietest month, brings in about $2,010. Guests stay about 5 nights, longer than in most of Pennsylvania, and book about 48 days ahead.
- What sells
- Smaller places set the market: only 43% of entire homes have three or more bedrooms, against about 70% in the typical market in Pennsylvania.
- Who it suits
- A good fit for buyers who prefer a smaller one- or two-bedroom place and would rather price for occupancy than for rate.
Revenue per listing by month
$4,020 $2,010- Median listing
- $2,850/mo
- Top 25% of listings
- $4,300+/mo
- Booked ahead
- 48 days
- Average stay
- 5 nights
- Most common home size
- 3 bedrooms
- Superhosts
- 74%
10. Coolbaugh Township
Known for: Large market · Growing revenue
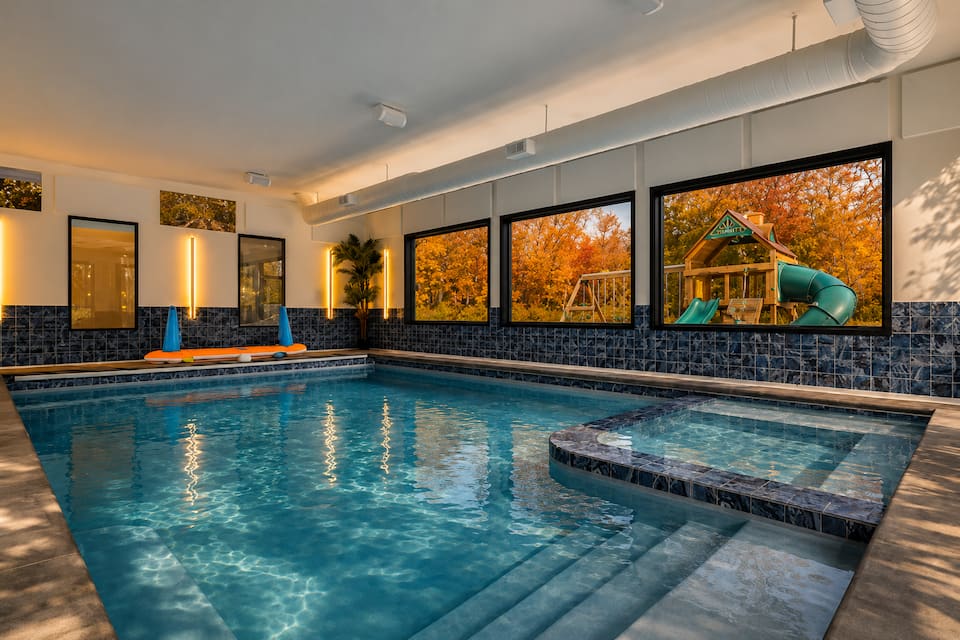

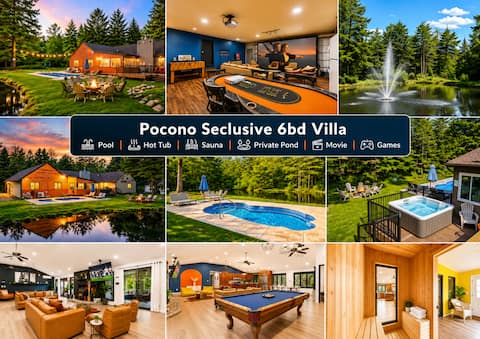
Top-earning Airbnb listings in Coolbaugh Township - Avg. revenue
- $43,800 +16% vs. last year
- Occupancy
- 35%
- Nightly rate
- $385
- Active listings
- 846
Where it places among the 28 ranked markets in Pennsylvania
- Revenue 13th of 28
- Occupancy 20th of 28
- Market size 3rd of 28
- Year-round 14th of 28
- Growth 4th of 25
- How it earns
- Coolbaugh Township is Pennsylvania's third-largest Airbnb market, with 846 active listings to price against. Average revenue per listing came to $43,800, 34% above the Pennsylvania average. Its place at #10 rests on market size (3rd of 28) and revenue growth (4th of 25) rather than on revenue per listing. A typical listing takes in about $3,610 a month; the top quarter clear $6,240 or more. Revenue per listing rose 16% over the year, helped by nightly rates 19% higher.
- When it earns
- Revenue in Coolbaugh Township concentrates from June to August: July earns about $8,130 per listing, about 2.8 times as much as March.
- What sells
- Big homes set the market: 91% of entire homes have three or more bedrooms, against about 70% in the typical market in Pennsylvania, and houses make up 89% of supply.
- Who it suits
- It suits buyers who can carry costs through a quiet March and want a large home for groups and families.
Revenue per listing by month
$8,130 $2,930- Median listing
- $3,610/mo
- Top 25% of listings
- $6,240+/mo
- Booked ahead
- 37 days
- Average stay
- 3 nights
- Most common home size
- 3 bedrooms
- Superhosts
- 58%
Areas in the full report: Poconos · Big Boulder Lake · Mount Pocono
Full Coolbaugh Township Airbnb report
Full ranking
How All 28 Ranked Markets in Pennsylvania Compare
The overall ranking with the five measures behind it. "Slow month" is a market's weakest month of revenue as a share of its best, so a higher figure means steadier income. Select a column heading to re-sort.
| Penn Forest Township Large market, high earnings | $52,182 | 39% | $381 | 40% | +11% | 368 | |
| Albrightsville High earnings, high occupancy | $55,645 | 43% | $434 | 37% | – | 130 | |
| East Stroudsburg High earnings, high occupancy | $63,646 | 42% | $464 | 33% | – | 163 | |
| 4 | Stroud Township High earnings, growing revenue | $72,255 | 39% | $519 | 35% | +28% | 110 |
| 5 | Middle Smithfield Township Growing revenue, high earnings | $51,425 | 41% | $388 | 35% | +19% | 147 |
| 6 | Kidder Township High earnings, large market | $54,476 | 32% | $519 | 35% | +11% | 471 |
| 7 | Pittsburgh Large market, high occupancy | $28,308 | 42% | $223 | 45% | +14% | 2,385 |
| 8 | Jim Thorpe High occupancy, growing revenue | $38,382 | 44% | $279 | 48% | +15% | 120 |
| 9 | Lancaster High occupancy, year-round demand | $30,469 | 46% | $203 | 50% | +15% | 223 |
| 10 | Coolbaugh Township Large market, growing revenue | $43,763 | 35% | $385 | 36% | +16% | 846 |
| 11 | Philadelphia Large market, year-round demand | $23,428 | 40% | $197 | 52% | +11% | 4,555 |
| 12 | Tobyhanna Township Large market, growing revenue | $47,518 | 35% | $414 | 32% | +11% | 577 |
| 13 | State College High earnings | $50,754 | 38% | $626 | 31% | −33% | 291 |
| 14 | Harrisburg Year-round demand, high occupancy | $18,835 | 42% | $152 | 51% | +13% | 231 |
| 15 | East Lampeter Township High occupancy | $38,148 | 46% | $238 | 39% | +7% | 106 |
| 16 | Tunkhannock Township High earnings | $49,302 | 35% | $445 | 34% | +7% | 231 |
| 17 | Patton Township High earnings | $49,975 | 38% | $635 | 26% | −2% | 175 |
| 18 | Lake Harmony High earnings | $52,303 | 35% | $530 | 30% | – | 118 |
| 19 | Clifton Township | $42,008 | 36% | $373 | 38% | −2% | 131 |
| 20 | Jackson Township | $34,843 | 30% | $378 | 48% | +8% | 290 |
| 21 | Ferguson Township High earnings | $52,542 | 37% | $845 | 25% | −14% | 118 |
| 22 | Erie High occupancy | $20,532 | 43% | $171 | 28% | −4% | 237 |
| 23 | Jefferson Township Growing revenue | $34,024 | 34% | $328 | 39% | +18% | 115 |
| 24 | Allentown Year-round demand | $13,920 | 37% | $160 | 57% | −14% | 133 |
| 25 | Middlecreek Township | $33,620 | 30% | $389 | 26% | −4% | 147 |
| 26 | Lackawaxen Township | $36,106 | 28% | $409 | 32% | −1% | 103 |
| 27 | Upper Darby Year-round demand | $11,324 | 33% | $125 | 55% | +3% | 102 |
| 28 | Palmyra Township | $27,634 | 31% | $358 | 34% | −8% | 121 |
By measure
Pennsylvania Airbnb Markets Ranked by Revenue, Nightly Rate and Occupancy
The overall ranking balances five measures. These lists take one at a time, for buyers who care most about income, pricing power, bookings, a steady calendar, momentum or market size.
Highest-earning Airbnb markets in Pennsylvania
Average annual revenue per active listing over the past 12 months. Markets with at least 200 listings.
| # | Market | Revenue |
|---|---|---|
| Kidder Township #6 overall | $54,500 | |
| Penn Forest Township #1 overall | $52,200 | |
| State College #13 overall | $50,800 | |
| 4 | Tunkhannock Township #16 overall | $49,300 |
| 5 | Tobyhanna Township #12 overall | $47,500 |
| 6 | Coolbaugh Township #10 overall | $43,800 |
| 7 | Jackson Township #20 overall | $34,800 |
| 8 | Lancaster #9 overall | $30,500 |
| 9 | Pittsburgh #7 overall | $28,300 |
| 10 | Philadelphia #11 overall | $23,400 |
| 11 | Erie #22 overall | $20,500 |
| 12 | Harrisburg #14 overall | $18,800 |
Most expensive Airbnb markets in Pennsylvania by nightly rate
Average rate per booked night. A high rate earns most where occupancy holds up too. Markets with at least 200 listings.
| # | Market | Nightly |
|---|---|---|
| State College #13 overall | $625 | |
| Kidder Township #6 overall | $520 | |
| Tunkhannock Township #16 overall | $445 | |
| 4 | Tobyhanna Township #12 overall | $415 |
| 5 | Coolbaugh Township #10 overall | $385 |
| 6 | Penn Forest Township #1 overall | $380 |
| 7 | Jackson Township #20 overall | $380 |
| 8 | Pittsburgh #7 overall | $225 |
| 9 | Lancaster #9 overall | $205 |
| 10 | Philadelphia #11 overall | $195 |
| 11 | Erie #22 overall | $170 |
| 12 | Harrisburg #14 overall | $150 |
Highest-occupancy Airbnb markets in Pennsylvania
Share of available nights booked over the past 12 months. Markets with at least 200 listings.
| # | Market | Occupancy |
|---|---|---|
| Lancaster #9 overall | 46% | |
| Erie #22 overall | 43% | |
| Pittsburgh #7 overall | 42% | |
| 4 | Harrisburg #14 overall | 42% |
| 5 | Philadelphia #11 overall | 40% |
| 6 | Penn Forest Township #1 overall | 39% |
| 7 | State College #13 overall | 38% |
| 8 | Tobyhanna Township #12 overall | 35% |
| 9 | Coolbaugh Township #10 overall | 35% |
| 10 | Tunkhannock Township #16 overall | 35% |
| 11 | Kidder Township #6 overall | 32% |
| 12 | Jackson Township #20 overall | 30% |
Most year-round Airbnb markets in Pennsylvania
Revenue in the slowest month as a share of the best month, so a higher figure means steadier income. Markets with at least 200 listings.
| # | Market | Slow month |
|---|---|---|
| Philadelphia #11 overall | 52% | |
| Harrisburg #14 overall | 51% | |
| Lancaster #9 overall | 50% | |
| 4 | Jackson Township #20 overall | 48% |
| 5 | Pittsburgh #7 overall | 45% |
| 6 | Penn Forest Township #1 overall | 40% |
| 7 | Coolbaugh Township #10 overall | 36% |
| 8 | Kidder Township #6 overall | 35% |
| 9 | Tunkhannock Township #16 overall | 34% |
| 10 | Tobyhanna Township #12 overall | 32% |
| 11 | State College #13 overall | 31% |
| 12 | Erie #22 overall | 28% |
Fastest-growing Airbnb markets in Pennsylvania
Change in revenue per listing from the year before, among markets where it rose. Markets with at least 200 listings.
| # | Market | Change |
|---|---|---|
| Coolbaugh Township #10 overall | +16% | |
| Lancaster #9 overall | +15% | |
| Pittsburgh #7 overall | +14% | |
| 4 | Harrisburg #14 overall | +13% |
| 5 | Philadelphia #11 overall | +11% |
| 6 | Tobyhanna Township #12 overall | +11% |
| 7 | Penn Forest Township #1 overall | +11% |
| 8 | Kidder Township #6 overall | +11% |
| 9 | Jackson Township #20 overall | +8% |
| 10 | Tunkhannock Township #16 overall | +7% |
Largest Airbnb markets in Pennsylvania
Active listings. Bigger markets have more comparable rentals to price against and more buyers at resale.
| # | Market | Listings |
|---|---|---|
| Philadelphia #11 overall | 4,560 | |
| Pittsburgh #7 overall | 2,390 | |
| Coolbaugh Township #10 overall | 846 | |
| 4 | Tobyhanna Township #12 overall | 577 |
| 5 | Kidder Township #6 overall | 471 |
| 6 | Penn Forest Township #1 overall | 368 |
| 7 | State College #13 overall | 291 |
| 8 | Jackson Township #20 overall | 290 |
| 9 | Erie #22 overall | 237 |
| 10 | Harrisburg #14 overall | 231 |
| 11 | Tunkhannock Township #16 overall | 231 |
| 12 | Lancaster #9 overall | 223 |
| 13 | Patton Township #17 overall | 175 |
| 14 | East Stroudsburg #3 overall | 163 |
| 15 | Middle Smithfield Township #5 overall | 147 |
| 16 | Middlecreek Township #25 overall | 147 |
| 17 | Allentown #24 overall | 133 |
| 18 | Clifton Township #19 overall | 131 |
| 19 | Albrightsville #2 overall | 130 |
| 20 | Palmyra Township #28 overall | 121 |
| 21 | Jim Thorpe #8 overall | 120 |
| 22 | Lake Harmony #18 overall | 118 |
| 23 | Ferguson Township #21 overall | 118 |
| 24 | Jefferson Township #23 overall | 115 |
| 25 | Stroud Township #4 overall | 110 |
Seasonality
When Airbnbs in Pennsylvania Earn the Most
July is the best month for about half of ranked markets in Pennsylvania. March is the most common slowest month, in 9 markets.
July earns about 1.9 times what March does
Average revenue per listing across the 28 ranked markets in Pennsylvania, by month
| Month | Avg. revenue per listing | Best month for | Highest-ranked examples |
|---|---|---|---|
| January | $2,860 | 2 markets | Jefferson Township, Middlecreek Township |
| February | $2,650 | – | – |
| March | $2,610 | – | – |
| April | $2,940 | – | – |
| May | $3,600 | 1 market | Philadelphia |
| June | $4,180 | 4 markets | Pittsburgh, Harrisburg, East Lampeter Township |
| July | $4,950 | 14 markets | Penn Forest Township, Stroud Township, Middle Smithfield Township |
| August | $4,870 | 4 markets | Albrightsville, East Stroudsburg, Jim Thorpe |
| September | $3,120 | – | – |
| October | $3,650 | 3 markets | State College, Patton Township, Ferguson Township |
| November | $3,440 | – | – |
| December | $3,740 | – | – |
Average revenue is per listing across the ranked markets, the line in the chart above. "Best month for" counts the ranked markets whose own revenue peaks in that month.
Management
Who Manages Airbnbs in Pennsylvania?
42 companies run 10 or more Airbnb listings in Pennsylvania, and companies run 12% of its listings. AirROI ranks the 44 largest by listings, guest rating and growth.
Method
How the Ranking Works
The ranking covers the 28 markets in Pennsylvania with at least 100 active Airbnb listings and data through September 2026. Each market is compared with the others on five measures, and markets are ordered by a weighted blend of where they place on each:
- Revenue per listing (35%): average revenue an active listing earned over the past 12 months.
- Occupancy (20%): share of available nights that were booked.
- Market size (20%): active listings. Bigger markets offer more comparable rentals to price against and more buyers when you sell.
- Year-round demand (15%): revenue in the slowest month as a share of the best month. The latest month is left out when its bookings look incomplete.
- Growth (10%): change in revenue per listing from the year before. Markets whose boundaries changed between years are scored in the middle.
Left out: 79 markets whose data predate the latest refresh and 4 towns listed a second time under another spelling. The score measures how rentals perform. It does not include purchase prices, financing, operating costs or local short-term rental rules, which vary by address and should be checked before buying. Figures are in US dollars and match each market's own report; see the data methodology for how listings are tracked.
To check one property before buying, run its address and size through the Airbnb profit calculator for a revenue, occupancy and nightly-rate range from comparable listings.
FAQ
Frequently Asked Questions About Airbnb Investing in Pennsylvania
What is the best place to buy an Airbnb in Pennsylvania?
Penn Forest Township ranks first of the 28 markets in Pennsylvania in AirROI's ranking, with $52,200 in average revenue per listing and 39% occupancy. Albrightsville and East Stroudsburg follow. The ranking weighs revenue, occupancy, market size, seasonality and growth; it leaves out purchase prices.
What are the most profitable Airbnb locations in Pennsylvania?
By revenue per listing, among markets with at least 200 listings, Kidder Township leads at $54,500 a year, ahead of Penn Forest Township at $52,200. Profit also depends on what a property costs to buy and run, which varies far more between markets than revenue does.
How much does an Airbnb make in Pennsylvania?
The average active listing in Pennsylvania earned $32,700 over the 12 months to September 2026, at 39% occupancy. Across the ranked markets, the middle half averaged between $28,300 and $51,400 per listing. Averages include listings that operated for only part of the year, so a listing rented all year typically earns more.
What is a good Airbnb occupancy rate in Pennsylvania?
The average listing in Pennsylvania was booked on 39% of available nights over the past 12 months. Half of the ranked markets fall between 34% and 42%, so a market above about 42% sits in the top quarter. Occupancy is only half the picture: a market with lower occupancy can still earn more if its nightly rates are higher.
Where is Airbnb demand highest in Pennsylvania?
Among ranked markets with at least 200 listings, Lancaster has the highest occupancy, with 46% of available nights booked, followed by Erie at 43%. Its listings average about $205 a night and $30,500 a year.
Where are Airbnb nightly rates highest in Pennsylvania?
Among ranked markets with at least 200 listings, State College has the highest average nightly rate, about $625, followed by Kidder Township at $520. Harrisburg is the least expensive, at about $150. The average booked night in Pennsylvania costs about $295.
What is the best month for Airbnb in Pennsylvania?
July is the highest-earning month for 14 of the 28 ranked markets, followed by August (4). March is the most common slowest month, in 9 of the 28 markets. Each market's report shows its own month-by-month revenue, occupancy and rates.
Which Airbnb markets in Pennsylvania earn the most evenly through the year?
Among ranked markets with at least 200 listings, Philadelphia has the steadiest income: its slowest month, February, still earns about half of its best. Harrisburg follows, at 51%. Steadier markets are easier to budget for, though they do not always earn the most per listing.
Which Airbnb markets are growing fastest in Pennsylvania?
Among ranked markets with at least 200 listings, revenue per listing grew most in Coolbaugh Township, up 16% on the year before, and in Lancaster, up 15%. A single strong year can reflect events or new supply, so it is worth checking a market's monthly trend before relying on it.
Is Airbnb still profitable in Pennsylvania in 2026?
Revenue per listing grew in 16 of the 25 ranked markets with a comparable year of data; in the typical market it rose 8%. Whether a given property profits depends on its purchase price, financing and running costs.
What are the best smaller Airbnb markets in Pennsylvania?
Among ranked markets with fewer than 150 active listings, Albrightsville (#2 overall, $55,600 per listing), Stroud Township (#4, $72,300) and Middle Smithfield Township (#5, $51,400) place highest. Smaller markets have fewer comparable rentals to price against, so their averages can move more from year to year.
How many Airbnb listings are there in Pennsylvania?
AirROI tracked 20,500 active Airbnb listings in Pennsylvania over the 12 months to September 2026, across 252 markets. The largest ranked market is Philadelphia, with 4,560 listings, followed by Pittsburgh with 2,390.
Do Airbnb hosts need a permit in Pennsylvania?
Rules can come from the state as well as the city or county, and they change often, so check both for any address you consider. In the listing data, most listings display a registration number in 1 of the 28 ranked markets, including Philadelphia, though that shows what hosts display, not what the rules allow.
Directory
All 252 Airbnb Markets in Pennsylvania
Every Pennsylvania city with an AirROI Airbnb market report, A–Z, with its active listing count.
A
- Abington Township 31 listings
- Akron 19 listings
- Albrightsville 130 listings
- Allentown 133 listings
- Altoona 28 listings
- Annville 23 listings
- Ararat Township 19 listings
- Armagh Township 35 listings
B
- Barnett Township 37 listings
- Barrett Township 93 listings
- Bedford 32 listings
- Bedford Township 22 listings
- Bellefonte 57 listings
- Bellevue 20 listings
- Benezette Township 27 listings
- Benner Township 72 listings
- Bethel Township 27 listings
- Bethlehem 90 listings
- Big Bass Lake 32 listings
- Blakeslee 75 listings
- Bloomfield Township 35 listings
- Blooming Grove Township 20 listings
- Bloomsburg 18 listings
- Boalsburg 52 listings
- Brecknock Township 18 listings
- Bridgeton Township 18 listings
- Brown Township 20 listings
- Buckingham Township 31 listings
- Butler Township 18 listings
C
- Caernarvon Township 18 listings
- Carlisle 56 listings
- Carnegie 27 listings
- Carroll Valley 18 listings
- Chambersburg 43 listings
- Champion 60 listings
- Charleston Township 19 listings
- Cheltenham Township 28 listings
- Clifford Township 27 listings
- Clifton Township 131 listings
- College Township 81 listings
- Conewago Township 19 listings
- Confluence 32 listings
- Connellsville 24 listings
- Coolbaugh Township 846 listings
- Coudersport 42 listings
- Covington Township 24 listings
- Cranberry Township 27 listings
- Cumberland Township 27 listings
D
- Damascus Township 37 listings
- Danville 31 listings
- Delaware Township 18 listings
- Delmar Township 21 listings
- Derry Township 85 listings
- Donegal Township 41 listings
- Doylestown 28 listings
- Dreher Township 19 listings
- DuBois 24 listings
E
- East Buffalo Township 21 listings
- East Cameron Township 19 listings
- East Donegal Township 35 listings
- East Earl Township 18 listings
- East Hanover Township 18 listings
- East Hempfield Township 28 listings
- East Lampeter Township 106 listings
- East Stroudsburg 163 listings
- Easton 27 listings
- Edinboro 43 listings
- Elizabethtown 22 listings
- Elk Township 17 listings
- Emerald Lakes 24 listings
- Ephrata 40 listings
- Ephrata Township 20 listings
- Erie 237 listings
- Exeter Township 19 listings
F
- Fairmount Township 22 listings
- Fairview Township 21 listings
- Farmington Township 48 listings
- Ferguson Township 118 listings
- Forest Hills 18 listings
- Foster Township 20 listings
- Franklin Township 52 listings
G
- Gaines Township 53 listings
- Gettysburg 87 listings
- Greene Township 70 listings
- Greenfield Township 22 listings
- Gregg Township 20 listings
- Grove City 25 listings
H
- Halfmoon Township 21 listings
- Halifax Township 18 listings
- Hamilton Township 21 listings
- Harris Township 39 listings
- Harrisburg 231 listings
- Harveys Lake 32 listings
- Haverford Township 22 listings
- Hawley 31 listings
- Hebron Township 18 listings
- Hellam Township 24 listings
- Henry Clay Township 22 listings
- Herrick Township 26 listings
- Hershey 47 listings
- Hillsgrove Township 21 listings
- Honesdale 23 listings
- Hummelstown 24 listings
- Huntingdon 29 listings
I
- Indian Mountain Lake 71 listings
- Indiana 29 listings
J
- Jackson Township 290 listings
- Jay Township 21 listings
- Jefferson Township 115 listings
- Jim Thorpe 120 listings
- Johnstown 28 listings
K
- Kane 26 listings
- Kennett Square 36 listings
- Kennett Township 18 listings
- Kidder Township 471 listings
- Kimmel Township 23 listings
L
- Lackawaxen Township 103 listings
- Lake Ariel 41 listings
- Lake Harmony 118 listings
- Lake Township 91 listings
- Lancaster 223 listings
- Lancaster Township 21 listings
- Lansdowne 17 listings
- Lawrence Township 20 listings
- Leacock Township 67 listings
- Lebanon 22 listings
- Lehigh Township 32 listings
- Lehman Township 90 listings
- Lemont 25 listings
- Lewisburg 50 listings
- Liberty Township 40 listings
- Ligonier 31 listings
- Ligonier Township 33 listings
- Limestone Township 20 listings
- Lock Haven 28 listings
- Long Pond 83 listings
- Lower Macungie Township 23 listings
- Lower Merion Township 53 listings
- Lower Paxton Township 18 listings
M
- Manchester Township 22 listings
- Manheim Township 31 listings
- Manor Township 28 listings
- Marion Township 24 listings
- Meadville 22 listings
- Mechanicsburg 30 listings
- Menallen Township 18 listings
- Meyersdale 19 listings
- Middle Smithfield Township 147 listings
- Middlecreek Township 147 listings
- Milford Township 26 listings
- Millcreek Township 77 listings
- Millvale 20 listings
- Monaca 19 listings
- Monroe Township 28 listings
- Montgomery Township 41 listings
- Mount Joy 22 listings
- Mount Joy Township 23 listings
- Mount Oliver 19 listings
- Mount Pleasant Township 31 listings
- Mount Pocono 21 listings
- Mt. Lebanon 20 listings
N
- New Holland 40 listings
- New Hope 39 listings
- New Kensington 22 listings
- Newberry Township 18 listings
- North East Township 37 listings
- North Londonderry Township 18 listings
- North Union Township 17 listings
O
- Ohiopyle 32 listings
P
- Palmyra Township 121 listings
- Paradise Township 84 listings
- Patton Township 175 listings
- Paupack Township 61 listings
- Penn Estates 33 listings
- Penn Forest Township 368 listings
- Penn Hills 23 listings
- Penn Township 78 listings
- Perry Township 18 listings
- Philadelphia 4,555 listings
- Phoenixville 46 listings
- Pine Township 30 listings
- Pittsburgh 2,385 listings
- Pocono Pines 36 listings
- Pocono Summit 54 listings
- Pocono Township 94 listings
- Potter Township 66 listings
- Pottstown 25 listings
- Pottsville 21 listings
- Price Township 19 listings
- Providence Township 18 listings
- Pymatuning Central 23 listings
R
- Radnor Township 19 listings
- Reading 78 listings
- Ridgway 27 listings
- Ross Township 44 listings
- Rush Township 18 listings
S
- Sadsbury Township 61 listings
- Salem Township 60 listings
- Salisbury Township 49 listings
- Saltlick Township 39 listings
- Sandy Township 18 listings
- Scranton 84 listings
- Shaler Township 18 listings
- Shippen Township 18 listings
- Shohola Township 17 listings
- Smithfield Township 80 listings
- Solebury Township 26 listings
- Somerset 46 listings
- South Hanover Township 18 listings
- South Londonderry Township 25 listings
- Southampton Township 21 listings
- Spring Township 63 listings
- Springfield Township 49 listings
- State College 291 listings
- Stewart Township 29 listings
- Strasburg 24 listings
- Strasburg Township 39 listings
- Stroud Township 110 listings
- Stroudsburg 31 listings
- Sugarloaf Township 20 listings
- Summit Township 33 listings
- Susquehanna Township 46 listings
- Swatara Township 25 listings
- Sweden Township 22 listings
- Swissvale 37 listings
T
- Tannersville 53 listings
- Tinicum Township 19 listings
- Tobyhanna 182 listings
- Tobyhanna Township 577 listings
- Tredyffrin Township 19 listings
- Tunkhannock Township 231 listings
U
- Union Township 57 listings
- Upper Darby 102 listings
- Upper Leacock Township 32 listings
- Upper Merion Township 22 listings
W
- Walker Township 28 listings
- Warren 27 listings
- Warwick Township 24 listings
- Washington Township 39 listings
- Wayne Township 22 listings
- Wellsboro 33 listings
- West Buffalo Township 20 listings
- West Caln Township 21 listings
- West Chester 24 listings
- West Cornwall Township 18 listings
- West Lampeter Township 20 listings
- Wharton Township 74 listings
- White Township 19 listings
- Wilkes-Barre 47 listings
- Wilkinsburg 33 listings
- Williamsport 70 listings
Y
- York 61 listings