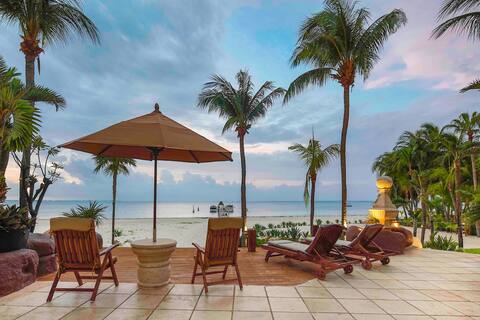
Cancún Airbnb Market Analysis 2026: Short Term Rental Data & Vacation Rental Statistics in Quintana Roo, Mexico
Is Airbnb profitable in Cancún in 2026? Explore comprehensive Airbnb analytics for Cancún, Quintana Roo, Mexico to uncover income potential. This 2026 STR market report for Cancún, based on AirROI data from February 2025 to January 2026, reveals key trends in the bustling market of 5,959 active listings.
Whether you're considering an Airbnb investment in Cancún, optimizing your existing vacation rental, or exploring rental arbitrage opportunities, understanding the Cancún Airbnb data is crucial. Leveraging the low regulation environment is key to maximizing your short term rental income potential. Let's dive into the specifics.
Key Cancún Airbnb Performance Metrics Overview
Monthly Airbnb Revenue Variations & Income Potential in Cancún (2026)
Understanding the monthly revenue variations for Airbnb listings in Cancún is key to maximizing your short term rental income potential. Seasonality significantly impacts earnings. Our analysis, based on data from the past 12 months, shows that the peak revenue month for STRs in Cancún is typically March, while September often presents the lowest earnings, highlighting opportunities for strategic pricing adjustments during shoulder and low seasons. Explore the typical Airbnb income in Cancún across different performance tiers:
- Best-in-class properties (Top 10%) achieve $3,429+ monthly, often utilizing dynamic pricing and superior guest experiences.
- Strong performing properties (Top 25%) earn $1,817 or more, indicating effective management and desirable locations/amenities.
- Typical properties (Median) generate around $827 per month, representing the average market performance.
- Entry-level properties (Bottom 25%) see earnings around $348, often with potential for optimization.
Average Monthly Airbnb Earnings Trend in Cancún
Cancún Airbnb Occupancy Rate Trends (2026)
Maximize your bookings by understanding the Cancún STR occupancy trends. Seasonal demand shifts significantly influence how often properties are booked. Typically, Marchsees the highest demand (peak season occupancy), while September experiences the lowest (low season). Effective strategies, like adjusting minimum stays or offering promotions, can boost occupancy during slower periods. Here's how different property tiers perform in Cancún:
- Best-in-class properties (Top 10%) achieve 81%+ occupancy, indicating high desirability and potentially optimized availability.
- Strong performing properties (Top 25%) maintain 64% or higher occupancy, suggesting good market fit and guest satisfaction.
- Typical properties (Median) have an occupancy rate around 40%.
- Entry-level properties (Bottom 25%) average 19% occupancy, potentially facing higher vacancy.
Average Monthly Occupancy Rate Trend in Cancún
Average Daily Rate (ADR) Airbnb Trends in Cancún (2026)
Effective short term rental pricing strategy in Cancún involves understanding monthly ADR fluctuations. The Average Daily Rate (ADR) for Airbnb in Cancún typically peaks in December and dips lowest during September. Leveraging Airbnb dynamic pricing tools or strategies based on this seasonality can significantly boost revenue. Here's a look at the typical nightly rates achieved:
- Best-in-class properties (Top 10%) command rates of $225+ per night, often due to premium features or locations.
- Strong performing properties (Top 25%) achieve nightly rates of $128 or more.
- Typical properties (Median) charge around $71 per night.
- Entry-level properties (Bottom 25%) earn around $41 per night.
Average Daily Rate (ADR) Trend by Month in Cancún
Get Live Cancún Market Intelligence 👇

Explore Real-time Analytics
Airbnb Seasonality Analysis & Trends in Cancún (2026)
Peak Season (March, December, February)
- Revenue averages $1,832 per month
- Occupancy rates average 49.5%
- Daily rates average $124
Shoulder Season
- Revenue averages $1,517 per month
- Occupancy maintains around 41.5%
- Daily rates hold near $120
Low Season (May, September, October)
- Revenue drops to average $1,236 per month
- Occupancy decreases to average 37.3%
- Daily rates adjust to average $115
Seasonality Insights for Cancún
- The Airbnb seasonality in Cancún shows moderate seasonality with distinct peak and low periods. While the sections above show seasonal averages, it's also insightful to look at the extremes:
- During the high season, the absolute peak month showcases Cancún's highest earning potential, with monthly revenues capable of climbing to $1,921, occupancy reaching a high of 54.0%, and ADRs peaking at $139.
- Conversely, the slowest single month of the year, typically falling within the low season, marks the market's lowest point. In this month, revenue might dip to $1,158, occupancy could drop to 36.2%, and ADRs may adjust down to $114.
- Understanding both the seasonal averages and these monthly peaks and troughs in revenue, occupancy, and ADR is crucial for maximizing your Airbnb profit potential in Cancún.
Seasonal Strategies for Maximizing Profit
- Peak Season: Maximize revenue through premium pricing and potentially longer minimum stays. Ensure high availability.
- Low Season: Offer competitive pricing, special promotions (e.g., extended stay discounts), and flexible cancellation policies. Target off-season travelers like remote workers or budget-conscious guests.
- Shoulder Seasons: Implement dynamic pricing that balances peak and low rates. Target weekend travelers or specific events. Offer slightly more flexible terms than peak season.
- Regularly analyze your own performance against these Cancún seasonality benchmarks and adjust your pricing and availability strategy accordingly.
Best Areas for Airbnb Investment in Cancún (2026)
Exploring the top neighborhoods for short-term rentals in Cancún? This section highlights key areas, outlining why they are attractive for hosts and guests, along with notable local attractions. Consider these locations based on your target guest profile and investment strategy.
| Neighborhood / Area | Why Host Here? (Target Guests & Appeal) | Key Attractions & Landmarks |
|---|---|---|
| Hotel Zone | A prime beachfront area known for its luxury resorts, shopping, and vibrant nightlife. It attracts a large number of tourists seeking a vacation experience with easy access to beaches and entertainment. | Playa Delfines, Interactive Aquarium, La Isla Shopping Village, Nightclubs, Luxury resorts |
| Downtown Cancún | The heart of Cancún, offering a more local experience compared to the tourist areas. It features many restaurants, markets, and cultural sites, appealing to longer-term visitors and those wanting to explore the local lifestyle. | Mercado 28, Cancún Cultural Center, Local restaurants and shops, Tequila Museum, Parque Las Palapas |
| Puerto Juárez | A quieter area ideal for those looking for a more peaceful stay with access to ferry services to Isla Mujeres. It attracts visitors seeking less crowded beaches and a more laid-back vibe. | Puerto Juárez Beach, Ferry to Isla Mujeres, Sunset views, Local seafood restaurants |
| Isla Mujeres | A nearby island known for its beautiful beaches and relaxed atmosphere. It’s popular with tourists looking for a tropical getaway and has a range of activities from snorkeling to exploring Mayan ruins. | Playa Norte, Garrafon Natural Reef Park, Mayan ruins at Punta Sur, Snorkeling and diving spots, Local shops and eateries |
| Playa del Carmen | Not in Cancún but a short drive away, this location is well-known for its beautiful beaches and outdoor activities, attracting both tourists and expats who enjoy a vibrant community vibe. | Quinta Avenida (5th Avenue), Beaches, Cenotes, Ferry to Cozumel, Eco-parks |
| Tulum | Also a short drive from Cancún, famous for its beachside Mayan ruins and eco-friendly retreats. This area attracts tourists interested in wellness, spirituality, and nature activities. | Tulum Ruins, Beaches, Cenotes, Eco-hotels, Biosphere reserves |
| Cozumel | A popular island for divers and cruise ships, known for its stunning coral reefs. It has a vibrant underwater scene and is ideal for water sports enthusiasts. | Diving and snorkeling spots, Beaches, Downtown San Miguel, Chankanaab Beach Adventure Park, Ferry to Playa del Carmen |
| Akumal | A beautiful beach destination known for its sea turtles. It provides a more tranquil setting, attracting families and nature lovers looking to escape the busier tourist spots. | Akumal Beach, Sea turtle snorkeling, Yal-Ku Lagoon, Beachfront restaurants, Local shops |
Understanding Airbnb License Requirements & STR Laws in Cancún (2026)
While Cancún, Quintana Roo, Mexico currently shows low STR regulations, specific Airbnb license requirements might still exist or change. Always verify the latest short term rental regulations and Airbnb license requirements directly with local government authorities for Cancún to ensure full compliance before hosting.
(Source: AirROI data, 2026, based on 1% licensed listings)
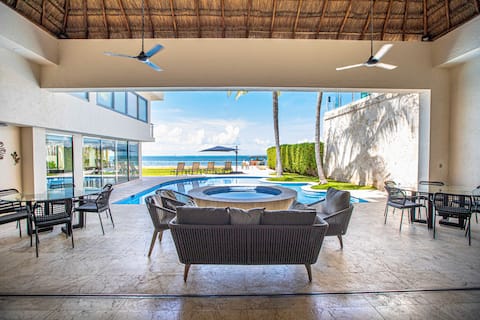
Top Performing Airbnb Properties in Cancún (2026)
Benchmark your potential! Explore examples of top-performing Airbnb properties in Cancúnbased on Trailing Twelve Month (TTM) revenue. Analyze their characteristics, revenue, occupancy rate, and ADR to understand what drives success in this market.
CASA ROSA, Luxury Beachfront House
Entire Place • 6 bedrooms

Beachfront Villa Cancún | Premium & Private
Entire Place • 5 bedrooms

Villa Serena | 6BR | Beachfront & Private Pool
Entire Place • 6 bedrooms
Oceanfront Villa - Private Beach at the Hotel Zone
Entire Place • 6 bedrooms

Villa Sha - Luxury Beachfront Villa in Cancun
Entire Place • 6 bedrooms

Beachfront villa with pool and private beach
Entire Place �• 5 bedrooms
Note: Performance varies based on location, size, amenities, seasonality, and management quality. Data reflects the past 12 months.
Top Performing Airbnb Hosts in Cancún (2026)
Learn from the best! This table showcases top-performing Airbnb hosts in Cancún based on the number of properties managed and estimated total revenue over the past year. Analyze their scale and performance metrics.
| Host Name | Properties | Grossing Revenue | Stay Reviews | Avg Rating |
|---|---|---|---|---|
| Igor | 48 | $1,600,117 | 3467 | 4.90/5.0 |
| Solmarrentals.Com | 8 | $1,535,445 | 70 | 4.71/5.0 |
| Jose Luis | 27 | $1,417,586 | 1000 | 4.80/5.0 |
| Alejandro | 27 | $1,203,033 | 1717 | 4.79/5.0 |
| Casa Paraiso Vacation | 36 | $1,150,069 | 3453 | 4.76/5.0 |
| Eric | 36 | $1,144,843 | 2766 | 4.76/5.0 |
| Dan | 60 | $1,142,755 | 2273 | 4.67/5.0 |
| Solmarrentals.Com | 14 | $1,045,539 | 582 | 4.53/5.0 |
| Carla Y Sebastián | 36 | $995,392 | 2388 | 4.83/5.0 |
| Andianirentals.Com | 61 | $941,835 | 2002 | 4.54/5.0 |
Analyzing the strategies of top hosts, such as their property selection, pricing, and guest communication, can offer valuable lessons for optimizing your own Airbnb operations in Cancún.
Dive Deeper: Advanced Cancún STR Market Data (2026)
Ready to unlock more insights? AirROI provides access to advanced metrics and comprehensive Airbnb data for Cancún. Explore detailed analytics beyond this report to refine your investment strategy, optimize pricing, and maximize your vacation rental profits.
Explore Advanced MetricsCancún Short-Term Rental Market Composition (2026): Property & Room Types
Room Type Distribution
Property Type Distribution
Market Composition Insights for Cancún
- The Cancún Airbnb market composition is heavily skewed towards Entire Home/Apt listings, which make up 81.1% of the 5,959 active rentals. This indicates strong guest preference for privacy and space.
- Looking at the property type distribution in Cancún, Apartment/Condo properties are the most common (68%), reflecting the local real estate landscape.
- Houses represent a significant 22.9% portion, catering likely to families or larger groups.
- The presence of 7% Hotel/Boutique listings indicates integration with traditional hospitality.
- Smaller segments like others, outdoor/unique (combined 2.1%) offer potential for unique stay experiences.
Cancún Airbnb Room Capacity Analysis (2026): Bedroom Distribution
Distribution of Listings by Number of Bedrooms
Room Capacity Insights for Cancún
- The dominant room capacity in Cancún is 1 bedroom listings, making up 40.3% of the market. This suggests a strong demand for properties suitable for couples or solo travelers.
- Together, 1 bedroom and 2 bedrooms properties represent 66.1% of the active Airbnb listings in Cancún, indicating a high concentration in these sizes.
- A significant 21.2% of listings offer 3+ bedrooms, catering to larger groups and families seeking more space in Cancún.
Cancún Vacation Rental Guest Capacity Trends (2026)
Distribution of Listings by Guest Capacity
Guest Capacity Insights for Cancún
- The most common guest capacity trend in Cancún vacation rentals is listings accommodating 2 guests (22.4%). This suggests the primary traveler segment is likely couples or solo travelers.
- Properties designed for 2 guests and 4 guests dominate the Cancún STR market, accounting for 44.3% of listings.
- 34.6% of properties accommodate 6+ guests, serving the market segment for larger families or group travel in Cancún.
- On average, properties in Cancún are equipped to host 4.3 guests.
Cancún Airbnb Booking Patterns (2026): Available vs. Booked Days
Available Days Distribution
Booked Days Distribution
Booking Pattern Insights for Cancún
- The most common availability pattern in Cancún falls within the 271-366 days range, representing 52.7% of listings. This suggests many properties have significant open periods on their calendars.
- Approximately 79.7% of listings show high availability (181+ days open annually), indicating potential for increased bookings or specific owner usage patterns.
- For booked days, the 31-90 days range is most frequent in Cancún (30.7%), reflecting common guest stay durations or potential owner blocking patterns.
- A notable 21.3% of properties secure long booking periods (181+ days booked per year), highlighting successful long-term rental strategies or significant owner usage.
Cancún Airbnb Minimum Stay Requirements Analysis
Distribution of Listings by Minimum Night Requirement
1 Night
1964 listings
33% of total
2 Nights
1449 listings
24.3% of total
3 Nights
532 listings
8.9% of total
4-6 Nights
175 listings
2.9% of total
7-29 Nights
32 listings
0.5% of total
30+ Nights
1807 listings
30.3% of total
Key Insights
- The most prevalent minimum stay requirement in Cancún is 1 Night, adopted by 33% of listings. This highlights the market's preference for shorter, flexible bookings.
- A significant segment (30.3%) caters to monthly stays (30+ nights) in Cancún, pointing to opportunities in the extended-stay market.
Recommendations
- Align with the market by considering a 1 Night minimum stay, as 33% of Cancún hosts use this setting.
- Explore offering discounts for stays of 30+ nights to attract the 30.3% of the market seeking extended stays.
- Adjust minimum nights based on seasonality – potentially shorter during low season and longer during peak demand periods in Cancún.
Cancún Airbnb Cancellation Policy Trends Analysis (2026)
Limited
99 listings
1.7% of total
Super Strict 60 Days
33 listings
0.6% of total
Refundable
1 listings
0% of total
Non-refundable
1 listings
0% of total
Super Strict 30 Days
21 listings
0.4% of total
Flexible
1732 listings
29.2% of total
Moderate
1501 listings
25.3% of total
Firm
1568 listings
26.4% of total
Strict
980 listings
16.5% of total
Cancellation Policy Insights for Cancún
- The prevailing Airbnb cancellation policy trend in Cancún is Flexible, used by 29.2% of listings.
- There's a relatively balanced mix between guest-friendly (54.5%) and stricter (42.9%) policies, offering choices for different guest needs.
Recommendations for Hosts
- Consider adopting a Flexible policy to align with the 29.2% market standard in Cancún.
- Regularly review your cancellation policy against competitors and market demand shifts in Cancún.
Cancún STR Booking Lead Time Analysis (2026)
Average Booking Lead Time by Month
Booking Lead Time Insights for Cancún
- The overall average booking lead time for vacation rentals in Cancún is 36 days.
- Guests book furthest in advance for stays during December (average 57 days), likely coinciding with peak travel demand or local events.
- The shortest booking windows occur for stays in June (average 28 days), indicating more last-minute travel plans during this time.
- Seasonally, Winter (47 days avg.) sees the longest lead times, while Spring (33 days avg.) has the shortest, reflecting typical travel planning cycles.
Recommendations for Hosts
- Use the overall average lead time (36 days) as a baseline for your pricing and availability strategy in Cancún.
- For December stays, consider implementing length-of-stay discounts or slightly higher rates for bookings made less than 57 days out to capitalize on advance planning.
- Target marketing efforts for the Winter season well in advance (at least 47 days) to capture early planners.
- Monitor your own booking lead times against these Cancún averages to identify opportunities for dynamic pricing adjustments.
Popular & Essential Airbnb Amenities in Cancún (2026)
Amenity Prevalence
Amenity Insights for Cancún
- Essential amenities in Cancún that guests expect include: Wifi, Air conditioning. Lacking these (any) could significantly impact bookings.
- Popular amenities like TV, Hot water, Kitchen are common but not universal. Offering these can provide a competitive edge.
Recommendations for Hosts
- Ensure your listing includes all essential amenities for Cancún: Wifi, Air conditioning.
- Prioritize adding missing essentials: Wifi, Air conditioning.
- Consider adding popular differentiators like TV or Hot water to increase appeal.
- Highlight unique or less common amenities you offer (e.g., hot tub, dedicated workspace, EV charger) in your listing description and photos.
- Regularly check competitor amenities in Cancún to stay competitive.
Cancún Airbnb Guest Demographics & Profile Analysis (2026)
Guest Profile Summary for Cancún
- The typical guest profile for Airbnb in Cancún consists of a mix of domestic (40%) and international guests, with top international origins including United States, typically belonging to the Post-2000s (Gen Z/Alpha) group (50%), primarily speaking English or Spanish.
- Domestic travelers account for 39.8% of guests.
- Key international markets include Mexico (39.8%) and United States (28.5%).
- Top languages spoken are English (41.5%) followed by Spanish (37.8%).
- A significant demographic segment is the Post-2000s (Gen Z/Alpha) group, representing 50% of guests.
Recommendations for Hosts
- Focus marketing internationally, particularly towards travelers from United States.
- Tailor amenities and listing descriptions to appeal to the dominant Post-2000s (Gen Z/Alpha) demographic (e.g., highlight fast WiFi, smart home features, local guides).
- Highlight unique local experiences or amenities relevant to the primary guest profile.
- Consider seasonal promotions aligned with peak travel times for key origin markets.
Nearby Short-Term Rental Market Comparison
How does the Cancún Airbnb market stack up against its neighbors? Compare key performance metrics like average monthly revenue, ADR, and occupancy rates in surrounding areas to understand the broader regional STR landscape.
| Market | Active Properties | Monthly Revenue | Daily Rate | Avg. Occupancy |
|---|---|---|---|---|
| Punta Sam | 32 | $3,194 | $441.63 | 37% |
| Isla Mujeres | 898 | $2,309 | $237.30 | 39% |
| Cozumel | 38 | $2,211 | $321.10 | 33% |
| Quintana Roo | 85 | $1,678 | $238.66 | 34% |
| Puerto Aventuras | 399 | $1,631 | $278.65 | 32% |
| Holbox | 617 | $1,314 | $163.08 | 31% |
| Tulum | 8,104 | $1,240 | $183.84 | 31% |
| San Miguel de Cozumel | 1,232 | $1,073 | $141.46 | 35% |
| Playa del Carmen | 7,725 | $1,018 | $128.74 | 38% |
| Puerto Morelos | 873 | $965 | $143.05 | 35% |