Santo André Airbnb Market Analysis 2026: Short Term Rental Data & Vacation Rental Statistics in São Paulo, Brazil
Is Airbnb profitable in Santo André in 2026? Explore comprehensive Airbnb analytics for Santo André, São Paulo, Brazil to uncover income potential. This 2026 STR market report for Santo André, based on AirROI data from February 2025 to January 2026, reveals key trends in the niche market of 159 active listings.
Whether you're considering an Airbnb investment in Santo André, optimizing your existing vacation rental, or exploring rental arbitrage opportunities, understanding the Santo André Airbnb data is crucial. Leveraging the low regulation environment is key to maximizing your short term rental income potential. Let's dive into the specifics.
Key Santo André Airbnb Performance Metrics Overview
Monthly Airbnb Revenue Variations & Income Potential in Santo André (2026)
Understanding the monthly revenue variations for Airbnb listings in Santo André is key to maximizing your short term rental income potential. Seasonality significantly impacts earnings. Our analysis, based on data from the past 12 months, shows that the peak revenue month for STRs in Santo André is typically December, while April often presents the lowest earnings, highlighting opportunities for strategic pricing adjustments during shoulder and low seasons. Explore the typical Airbnb income in Santo André across different performance tiers:
- Best-in-class properties (Top 10%) achieve $1,281+ monthly, often utilizing dynamic pricing and superior guest experiences.
- Strong performing properties (Top 25%) earn $807 or more, indicating effective management and desirable locations/amenities.
- Typical properties (Median) generate around $392 per month, representing the average market performance.
- Entry-level properties (Bottom 25%) see earnings around $178, often with potential for optimization.
Average Monthly Airbnb Earnings Trend in Santo André
Santo André Airbnb Occupancy Rate Trends (2026)
Maximize your bookings by understanding the Santo André STR occupancy trends. Seasonal demand shifts significantly influence how often properties are booked. Typically, Februarysees the highest demand (peak season occupancy), while January experiences the lowest (low season). Effective strategies, like adjusting minimum stays or offering promotions, can boost occupancy during slower periods. Here's how different property tiers perform in Santo André:
- Best-in-class properties (Top 10%) achieve 83%+ occupancy, indicating high desirability and potentially optimized availability.
- Strong performing properties (Top 25%) maintain 65% or higher occupancy, suggesting good market fit and guest satisfaction.
- Typical properties (Median) have an occupancy rate around 39%.
- Entry-level properties (Bottom 25%) average 18% occupancy, potentially facing higher vacancy.
Average Monthly Occupancy Rate Trend in Santo André
Average Daily Rate (ADR) Airbnb Trends in Santo André (2026)
Effective short term rental pricing strategy in Santo André involves understanding monthly ADR fluctuations. The Average Daily Rate (ADR) for Airbnb in Santo André typically peaks in December and dips lowest during February. Leveraging Airbnb dynamic pricing tools or strategies based on this seasonality can significantly boost revenue. Here's a look at the typical nightly rates achieved:
- Best-in-class properties (Top 10%) command rates of $69+ per night, often due to premium features or locations.
- Strong performing properties (Top 25%) achieve nightly rates of $47 or more.
- Typical properties (Median) charge around $34 per night.
- Entry-level properties (Bottom 25%) earn around $22 per night.
Average Daily Rate (ADR) Trend by Month in Santo André
Get Live Santo André Market Intelligence 👇

Explore Real-time Analytics
Airbnb Seasonality Analysis & Trends in Santo André (2026)
Peak Season (December, November, July)
- Revenue averages $698 per month
- Occupancy rates average 43.2%
- Daily rates average $45
Shoulder Season
- Revenue averages $584 per month
- Occupancy maintains around 43.7%
- Daily rates hold near $42
Low Season (January, April, June)
- Revenue drops to average $517 per month
- Occupancy decreases to average 40.3%
- Daily rates adjust to average $43
Seasonality Insights for Santo André
- The Airbnb seasonality in Santo André shows moderate seasonality with distinct peak and low periods. While the sections above show seasonal averages, it's also insightful to look at the extremes:
- During the high season, the absolute peak month showcases Santo André's highest earning potential, with monthly revenues capable of climbing to $788, occupancy reaching a high of 48.0%, and ADRs peaking at $47.
- Conversely, the slowest single month of the year, typically falling within the low season, marks the market's lowest point. In this month, revenue might dip to $513, occupancy could drop to 35.6%, and ADRs may adjust down to $39.
- Understanding both the seasonal averages and these monthly peaks and troughs in revenue, occupancy, and ADR is crucial for maximizing your Airbnb profit potential in Santo André.
Seasonal Strategies for Maximizing Profit
- Peak Season: Maximize revenue through premium pricing and potentially longer minimum stays. Ensure high availability.
- Low Season: Offer competitive pricing, special promotions (e.g., extended stay discounts), and flexible cancellation policies. Target off-season travelers like remote workers or budget-conscious guests.
- Shoulder Seasons: Implement dynamic pricing that balances peak and low rates. Target weekend travelers or specific events. Offer slightly more flexible terms than peak season.
- Regularly analyze your own performance against these Santo André seasonality benchmarks and adjust your pricing and availability strategy accordingly.
Best Areas for Airbnb Investment in Santo André (2026)
Exploring the top neighborhoods for short-term rentals in Santo André? This section highlights key areas, outlining why they are attractive for hosts and guests, along with notable local attractions. Consider these locations based on your target guest profile and investment strategy.
| Neighborhood / Area | Why Host Here? (Target Guests & Appeal) | Key Attractions & Landmarks |
|---|---|---|
| Vila Assunção | A picturesque neighborhood known for its beautiful houses and proximity to the Paraíba do Sul River. It's ideal for families and tourists looking for a peaceful stay while being close to the city. | Parque Central, Alameda São Paulo, Praça do Carmo, Escola de Samba Leandro de Itaquera, Shopping Metrópole |
| Santa Tereza | A historic neighborhood with charming streets and cultural attractions. It offers a blend of history and modernity, making it appealing for tourists interested in the local culture. | Igreja Santa Tereza, Museu de Santo André, Parque do Ipiranga, Cine Eldorado, Centro Cultural |
| Jardim | A trendy area surrounded by parks and green spaces, perfect for younger travelers and families. It features a vibrant restaurant scene and is close to various amenities. | Parque Natural Municipal Ecológico do Pedroso, Shopping ABC, Parque da Juventude, Praça dos Sabi�ás, Café da Praça |
| Vila Boa Vista | A residential area that offers easy access to public transportation and local shops. It's great for guests who want to explore the city conveniently. | Centro de Santo André, Teatro Municipal, Igreja do Evangelho Quadrangular, Praça IV Centenário, Feira de Alimentos |
| Parque Jaçatuba | Known for its green spaces and recreational areas, this district is perfect for families and nature lovers. Its parks attract visitors looking for outdoor activities. | Parque Jaçatuba, Parque Natural Municipal Engenheiro D. F. de L. Figueiredo, Parque Orlando Batista, Centro de Convivência, Feira Livre |
| Vila Palos verdes | Features spacious properties and a suburban feel. This area is appealing for long-term stays and those who seek a quieter atmosphere away from the hustle of the city. | Praça Palos Verdes, Horto Florestal, Igreja São José, Centro Comercial, Parque dos Patins |
| Rudge Ramos | A diverse neighborhood with a rich cultural scene. It attracts tourists who are looking for an authentic local experience, with various local shops and restaurants. | Parque Rudge Ramos, Centro Cultural de Rudge Ramos, Café da Rua, Música ao Vivo na Praça, Igreja Nossa Senhora de Fátima |
| Vila Curuçá | This area combines affordability with accessibility to public transport, making it ideal for those who want to explore São Paulo while enjoying a local atmosphere. | Feira de Curuçá, Igreja Batista Nova Esperança, Shopping Center Curuçá, Praça da Vila, Centro de Eventos |
Understanding Airbnb License Requirements & STR Laws in Santo André (2026)
While Santo André, São Paulo, Brazil currently shows low STR regulations, specific Airbnb license requirements might still exist or change. Always verify the latest short term rental regulations and Airbnb license requirements directly with local government authorities for Santo André to ensure full compliance before hosting.
(Source: AirROI data, 2026, based on 3% licensed listings)
Top Performing Airbnb Properties in Santo André (2026)
Benchmark your potential! Explore examples of top-performing Airbnb properties in Santo Andrébased on Trailing Twelve Month (TTM) revenue. Analyze their characteristics, revenue, occupancy rate, and ADR to understand what drives success in this market.
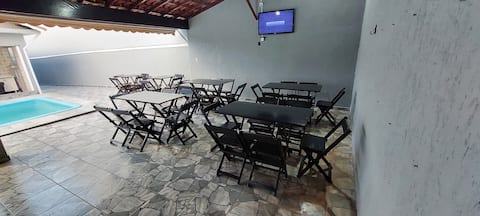
Pool&Party -DayUse house pool- Party Space
Entire Place • N/A

House 527- Paranapiacaba
Entire Place • 2 bedrooms

Paranapiacaba English Zen House
Entire Place • 1 bedroom

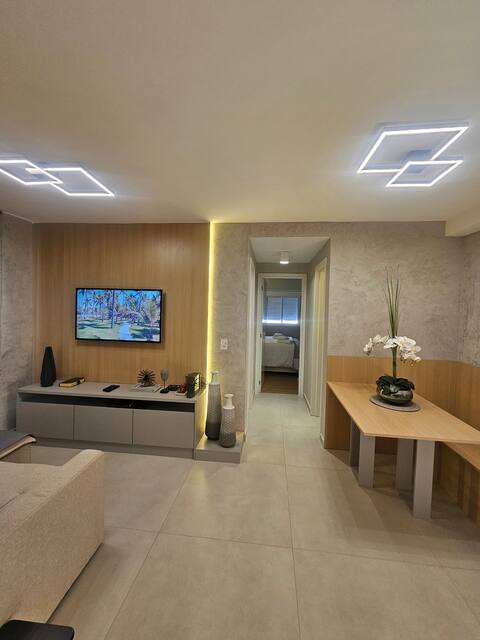
New apartment with air conditioning and backyard | Privileged location
Entire Place • 2 bedrooms

Paranapiacaba Zen Indigenous House
Entire Place • 1 bedroom
apartment in luxury building
Entire Place • 2 bedrooms
Note: Performance varies based on location, size, amenities, seasonality, and management quality. Data reflects the past 12 months.
Top Performing Airbnb Hosts in Santo André (2026)
Learn from the best! This table showcases top-performing Airbnb hosts in Santo André based on the number of properties managed and estimated total revenue over the past year. Analyze their scale and performance metrics.
| Host Name | Properties | Grossing Revenue | Stay Reviews | Avg Rating |
|---|---|---|---|---|
| Gleice Queiroz | 1 | $61,192 | 16 | 5.00/5.0 |
| Viviane Gouvêa | 4 | $42,693 | 54 | 4.97/5.0 |
| Fatima | 5 | $39,805 | 344 | 4.76/5.0 |
| Adler | 6 | $39,264 | 629 | 4.88/5.0 |
| Adriana | 2 | $36,295 | 117 | 4.98/5.0 |
| Claudia | 8 | $32,698 | 204 | 4.93/5.0 |
| Rodrigo | 5 | $32,374 | 35 | 4.98/5.0 |
| Caio Graco | 1 | $23,713 | 67 | 4.96/5.0 |
| Ana | 2 | $21,585 | 120 | 4.86/5.0 |
| Claudio | 1 | $16,604 | 24 | 5.00/5.0 |
Analyzing the strategies of top hosts, such as their property selection, pricing, and guest communication, can offer valuable lessons for optimizing your own Airbnb operations in Santo André.
Dive Deeper: Advanced Santo André STR Market Data (2026)
Ready to unlock more insights? AirROI provides access to advanced metrics and comprehensive Airbnb data for Santo André. Explore detailed analytics beyond this report to refine your investment strategy, optimize pricing, and maximize your vacation rental profits.
Explore Advanced MetricsSanto André Short-Term Rental Market Composition (2026): Property & Room Types
Room Type Distribution
Property Type Distribution
Market Composition Insights for Santo André
- The Santo André Airbnb market composition is heavily skewed towards Entire Home/Apt listings, which make up 76.7% of the 159 active rentals. This indicates strong guest preference for privacy and space.
- Looking at the property type distribution in Santo André, Apartment/Condo properties are the most common (59.7%), reflecting the local real estate landscape.
- Houses represent a significant 29.6% portion, catering likely to families or larger groups.
- The presence of 5.7% Hotel/Boutique listings indicates integration with traditional hospitality.
- Smaller segments like outdoor/unique, others (combined 5.0%) offer potential for unique stay experiences.
Santo André Airbnb Room Capacity Analysis (2026): Bedroom Distribution
Distribution of Listings by Number of Bedrooms
Room Capacity Insights for Santo André
- The dominant room capacity in Santo André is 1 bedroom listings, making up 35.8% of the market. This suggests a strong demand for properties suitable for couples or solo travelers.
- Together, 1 bedroom and 2 bedrooms properties represent 70.4% of the active Airbnb listings in Santo André, indicating a high concentration in these sizes.
Santo André Vacation Rental Guest Capacity Trends (2026)
Distribution of Listings by Guest Capacity
Guest Capacity Insights for Santo André
- The most common guest capacity trend in Santo André vacation rentals is listings accommodating 4 guests (23.3%). This suggests the primary traveler segment is likely small families or groups.
- Properties designed for 4 guests and 3 guests dominate the Santo André STR market, accounting for 42.2% of listings.
- 15.6% of properties accommodate 6+ guests, serving the market segment for larger families or group travel in Santo André.
- On average, properties in Santo André are equipped to host 3.3 guests.
Santo André Airbnb Booking Patterns (2026): Available vs. Booked Days
Available Days Distribution
Booked Days Distribution
Booking Pattern Insights for Santo André
- The most common availability pattern in Santo André falls within the 271-366 days range, representing 50.9% of listings. This suggests many properties have significant open periods on their calendars.
- Approximately 80.5% of listings show high availability (181+ days open annually), indicating potential for increased bookings or specific owner usage patterns.
- For booked days, the 91-180 days range is most frequent in Santo André (28.3%), reflecting common guest stay durations or potential owner blocking patterns.
- A notable 20.8% of properties secure long booking periods (181+ days booked per year), highlighting successful long-term rental strategies or significant owner usage.
Santo André Airbnb Minimum Stay Requirements Analysis
Distribution of Listings by Minimum Night Requirement
1 Night
47 listings
29.6% of total
2 Nights
20 listings
12.6% of total
3 Nights
7 listings
4.4% of total
4-6 Nights
13 listings
8.2% of total
7-29 Nights
26 listings
16.4% of total
30+ Nights
46 listings
28.9% of total
Key Insights
- The most prevalent minimum stay requirement in Santo André is 1 Night, adopted by 29.6% of listings. This highlights the market's preference for shorter, flexible bookings.
- A significant segment (28.9%) caters to monthly stays (30+ nights) in Santo André, pointing to opportunities in the extended-stay market.
Recommendations
- Align with the market by considering a 1 Night minimum stay, as 29.6% of Santo André hosts use this setting.
- If feasible, allowing 1-night stays, especially midweek or during low season, could capture last-minute bookings, as only 29.6% currently do.
- Explore offering discounts for stays of 30+ nights to attract the 28.9% of the market seeking extended stays.
- Adjust minimum nights based on seasonality – potentially shorter during low season and longer during peak demand periods in Santo André.
Santo André Airbnb Cancellation Policy Trends Analysis (2026)
Limited
3 listings
1.9% of total
Flexible
54 listings
34.4% of total
Moderate
24 listings
15.3% of total
Firm
43 listings
27.4% of total
Strict
33 listings
21% of total
Cancellation Policy Insights for Santo André
- The prevailing Airbnb cancellation policy trend in Santo André is Flexible, used by 34.4% of listings.
- There's a relatively balanced mix between guest-friendly (49.7%) and stricter (48.4%) policies, offering choices for different guest needs.
Recommendations for Hosts
- Consider adopting a Flexible policy to align with the 34.4% market standard in Santo André.
- Regularly review your cancellation policy against competitors and market demand shifts in Santo André.
Santo André STR Booking Lead Time Analysis (2026)
Average Booking Lead Time by Month
Booking Lead Time Insights for Santo André
- The overall average booking lead time for vacation rentals in Santo André is 17 days.
- Guests book furthest in advance for stays during December (average 29 days), likely coinciding with peak travel demand or local events.
- The shortest booking windows occur for stays in March (average 12 days), indicating more last-minute travel plans during this time.
- Seasonally, Winter (22 days avg.) sees the longest lead times, while Spring (15 days avg.) has the shortest, reflecting typical travel planning cycles.
Recommendations for Hosts
- Use the overall average lead time (17 days) as a baseline for your pricing and availability strategy in Santo André.
- For December stays, consider implementing length-of-stay discounts or slightly higher rates for bookings made less than 29 days out to capitalize on advance planning.
- Target marketing efforts for the Winter season well in advance (at least 22 days) to capture early planners.
- Monitor your own booking lead times against these Santo André averages to identify opportunities for dynamic pricing adjustments.
Popular & Essential Airbnb Amenities in Santo André (2026)
Amenity Prevalence
Amenity Insights for Santo André
- Essential amenities in Santo André that guests expect include: Wifi, Kitchen. Lacking these (any) could significantly impact bookings.
- Popular amenities like TV, Free parking on premises, Dishes and silverware are common but not universal. Offering these can provide a competitive edge.
Recommendations for Hosts
- Ensure your listing includes all essential amenities for Santo André: Wifi, Kitchen.
- Prioritize adding missing essentials: Wifi, Kitchen.
- Consider adding popular differentiators like TV or Free parking on premises to increase appeal.
- Highlight unique or less common amenities you offer (e.g., hot tub, dedicated workspace, EV charger) in your listing description and photos.
- Regularly check competitor amenities in Santo André to stay competitive.
Santo André Airbnb Guest Demographics & Profile Analysis (2026)
Guest Profile Summary for Santo André
- The typical guest profile for Airbnb in Santo André consists of primarily domestic travelers (90%), often arriving from nearby São Paulo, typically belonging to the Post-2000s (Gen Z/Alpha) group (50%), primarily speaking Portuguese or English.
- Domestic travelers account for 90.3% of guests.
- Key international markets include Brazil (90.3%) and United States (2.8%).
- Top languages spoken are Portuguese (46.7%) followed by English (31.3%).
- A significant demographic segment is the Post-2000s (Gen Z/Alpha) group, representing 50% of guests.
Recommendations for Hosts
- Target domestic marketing efforts towards travelers from São Paulo and Rio de Janeiro.
- Tailor amenities and listing descriptions to appeal to the dominant Post-2000s (Gen Z/Alpha) demographic (e.g., highlight fast WiFi, smart home features, local guides).
- Highlight unique local experiences or amenities relevant to the primary guest profile.
- Consider seasonal promotions aligned with peak travel times for key origin markets.
Nearby Short-Term Rental Market Comparison
How does the Santo André Airbnb market stack up against its neighbors? Compare key performance metrics like average monthly revenue, ADR, and occupancy rates in surrounding areas to understand the broader regional STR landscape.
| Market | Active Properties | Monthly Revenue | Daily Rate | Avg. Occupancy |
|---|---|---|---|---|
| Riviera de São Lourenço | 10 | $2,868 | $213.78 | 46% |
| Tuiuti | 18 | $1,686 | $156.45 | 30% |
| Itupeva | 136 | $1,561 | $225.82 | 28% |
| Morungaba | 31 | $1,435 | $263.39 | 27% |
| Campo Limpo Paulista | 49 | $1,428 | $181.02 | 30% |
| Valinhos | 61 | $1,370 | $176.28 | 33% |
| Itatiba | 171 | $1,331 | $177.58 | 29% |
| Vargem | 48 | $1,319 | $190.42 | 28% |
| Elias Fausto | 13 | $1,296 | $143.78 | 30% |
| Porto Feliz | 69 | $1,279 | $260.86 | 27% |