Ilhabela Airbnb Market Analysis 2026: Short Term Rental Data & Vacation Rental Statistics in São Paulo, Brazil
Is Airbnb profitable in Ilhabela in 2026? Explore comprehensive Airbnb analytics for Ilhabela, São Paulo, Brazil to uncover income potential. This 2026 STR market report for Ilhabela, based on AirROI data from February 2025 to January 2026, reveals key trends in the bustling market of 2,867 active listings.
Whether you're considering an Airbnb investment in Ilhabela, optimizing your existing vacation rental, or exploring rental arbitrage opportunities, understanding the Ilhabela Airbnb data is crucial. Leveraging the low regulation environment is key to maximizing your short term rental income potential. Let's dive into the specifics.
Key Ilhabela Airbnb Performance Metrics Overview
Monthly Airbnb Revenue Variations & Income Potential in Ilhabela (2026)
Understanding the monthly revenue variations for Airbnb listings in Ilhabela is key to maximizing your short term rental income potential. Seasonality significantly impacts earnings. Our analysis, based on data from the past 12 months, shows that the peak revenue month for STRs in Ilhabela is typically December, while June often presents the lowest earnings, highlighting opportunities for strategic pricing adjustments during shoulder and low seasons. Explore the typical Airbnb income in Ilhabela across different performance tiers:
- Best-in-class properties (Top 10%) achieve $3,166+ monthly, often utilizing dynamic pricing and superior guest experiences.
- Strong performing properties (Top 25%) earn $1,585 or more, indicating effective management and desirable locations/amenities.
- Typical properties (Median) generate around $772 per month, representing the average market performance.
- Entry-level properties (Bottom 25%) see earnings around $349, often with potential for optimization.
Average Monthly Airbnb Earnings Trend in Ilhabela
Ilhabela Airbnb Occupancy Rate Trends (2026)
Maximize your bookings by understanding the Ilhabela STR occupancy trends. Seasonal demand shifts significantly influence how often properties are booked. Typically, Marchsees the highest demand (peak season occupancy), while June experiences the lowest (low season). Effective strategies, like adjusting minimum stays or offering promotions, can boost occupancy during slower periods. Here's how different property tiers perform in Ilhabela:
- Best-in-class properties (Top 10%) achieve 71%+ occupancy, indicating high desirability and potentially optimized availability.
- Strong performing properties (Top 25%) maintain 52% or higher occupancy, suggesting good market fit and guest satisfaction.
- Typical properties (Median) have an occupancy rate around 28%.
- Entry-level properties (Bottom 25%) average 14% occupancy, potentially facing higher vacancy.
Average Monthly Occupancy Rate Trend in Ilhabela
Average Daily Rate (ADR) Airbnb Trends in Ilhabela (2026)
Effective short term rental pricing strategy in Ilhabela involves understanding monthly ADR fluctuations. The Average Daily Rate (ADR) for Airbnb in Ilhabela typically peaks in January and dips lowest during April. Leveraging Airbnb dynamic pricing tools or strategies based on this seasonality can significantly boost revenue. Here's a look at the typical nightly rates achieved:
- Best-in-class properties (Top 10%) command rates of $301+ per night, often due to premium features or locations.
- Strong performing properties (Top 25%) achieve nightly rates of $162 or more.
- Typical properties (Median) charge around $85 per night.
- Entry-level properties (Bottom 25%) earn around $54 per night.
Average Daily Rate (ADR) Trend by Month in Ilhabela
Get Live Ilhabela Market Intelligence 👇

Explore Real-time Analytics
Airbnb Seasonality Analysis & Trends in Ilhabela (2026)
Peak Season (December, January, March)
- Revenue averages $1,918 per month
- Occupancy rates average 40.7%
- Daily rates average $159
Shoulder Season
- Revenue averages $1,246 per month
- Occupancy maintains around 34.4%
- Daily rates hold near $135
Low Season (June, August, September)
- Revenue drops to average $971 per month
- Occupancy decreases to average 27.7%
- Daily rates adjust to average $132
Seasonality Insights for Ilhabela
- The Airbnb seasonality in Ilhabela shows highly seasonal trends requiring careful strategy. While the sections above show seasonal averages, it's also insightful to look at the extremes:
- During the high season, the absolute peak month showcases Ilhabela's highest earning potential, with monthly revenues capable of climbing to $2,070, occupancy reaching a high of 42.8%, and ADRs peaking at $171.
- Conversely, the slowest single month of the year, typically falling within the low season, marks the market's lowest point. In this month, revenue might dip to $936, occupancy could drop to 24.4%, and ADRs may adjust down to $129.
- Understanding both the seasonal averages and these monthly peaks and troughs in revenue, occupancy, and ADR is crucial for maximizing your Airbnb profit potential in Ilhabela.
Seasonal Strategies for Maximizing Profit
- Peak Season: Maximize revenue through premium pricing and potentially longer minimum stays. Ensure high availability.
- Low Season: Offer competitive pricing, special promotions (e.g., extended stay discounts), and flexible cancellation policies. Target off-season travelers like remote workers or budget-conscious guests.
- Shoulder Seasons: Implement dynamic pricing that balances peak and low rates. Target weekend travelers or specific events. Offer slightly more flexible terms than peak season.
- Regularly analyze your own performance against these Ilhabela seasonality benchmarks and adjust your pricing and availability strategy accordingly.
Best Areas for Airbnb Investment in Ilhabela (2026)
Exploring the top neighborhoods for short-term rentals in Ilhabela? This section highlights key areas, outlining why they are attractive for hosts and guests, along with notable local attractions. Consider these locations based on your target guest profile and investment strategy.
| Neighborhood / Area | Why Host Here? (Target Guests & Appeal) | Key Attractions & Landmarks |
|---|---|---|
| Praia do Curral | One of Ilhabela's most popular beaches, known for its stunning views and lively atmosphere. Ideal for tourists looking for relaxation and beach activities. | Curral Beach, Barquinhas Beach, Praia do Veloso, Praia do Jabaquara, Pico do Baepi |
| Praia da Feiticeira | A beautiful, secluded beach known for its clear waters and natural beauty. Attracts visitors seeking a more tranquil and picturesque beach experience. | Feiticeira Beach, Ilhabela State Park, Baldy Waterfall, Ilha das Cabras, Praia do Julião |
| Centro Histórico | The historic center of Ilhabela, filled with charming colonial architecture, shops, and restaurants. Perfect for guests who want to experience the local culture and history. | Igreja Matriz de Nossa Senhora da Ajuda, Culture and Arts House, Ilhabela Historical Museum, Street Market, Largo de São Sebastião |
| Praia do Julião | Known for its crystal-clear waters and calm environment, making it ideal for families and those looking to spend a peaceful day at the beach. | Julião Beach, Pedra do Sino, Marinas, Diving spots, Kite surfing areas |
| Praia do Viana | A quiet beach loved by locals, surrounded by lush greenery and natural beauty. Great for those who want a more authentic experience away from tourist crowds. | Viana Beach, Cascata do Gato, Walking trails, Naturalistic spots, Kayaking opportunities |
| Praia do Sino | Renowned for its scenic beauty and natural sounds, attracting nature lovers and those interested in outdoor activities. | Sino Beach, Hiking trails, Bird watching, Beach bars, Swimming spots |
| Praia da Vila | Features a beautiful stretch of sand and proximity to local restaurants and shops. An excellent spot for visitors wanting easy access to amenities. | Vila Beach, Local market, Nearby cafes, Cultural events, Sailing tours |
| Praia do Bonete | A remote beach that requires a hike to access, offering stunning natural landscapes. Ideal for adventure seekers and those looking to disconnect. | Bonete Beach, Hiking trails, Natural scenery, Wildlife watching, Camping areas |
Understanding Airbnb License Requirements & STR Laws in Ilhabela (2026)
While Ilhabela, São Paulo, Brazil currently shows low STR regulations, specific Airbnb license requirements might still exist or change. Always verify the latest short term rental regulations and Airbnb license requirements directly with local government authorities for Ilhabela to ensure full compliance before hosting.
(Source: AirROI data, 2026, based on 0% licensed listings)
Top Performing Airbnb Properties in Ilhabela (2026)
Benchmark your potential! Explore examples of top-performing Airbnb properties in Ilhabelabased on Trailing Twelve Month (TTM) revenue. Analyze their characteristics, revenue, occupancy rate, and ADR to understand what drives success in this market.
Modern coastal house with staff included
Entire Place • 4 bedrooms
Casa Super Paradise
Entire Place • 5 bedrooms
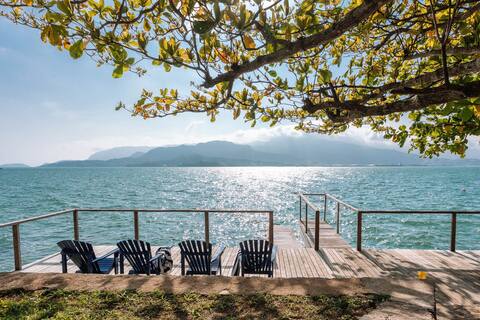
Paradise house overlooking the ocean
Entire Place • 5 bedrooms

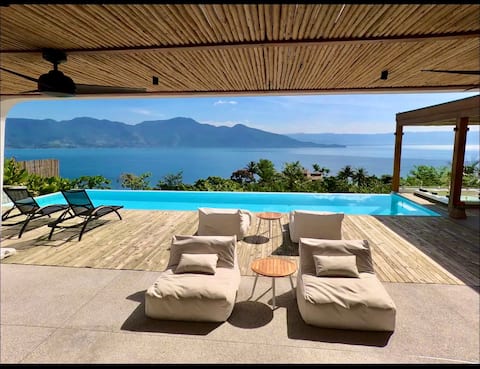
Ilhabela. Ocean view. Infinity pool
Entire Place • 5 bedrooms

Lehua Feiticeira House 1 - Walk to the beach
Entire Place • 4 bedrooms

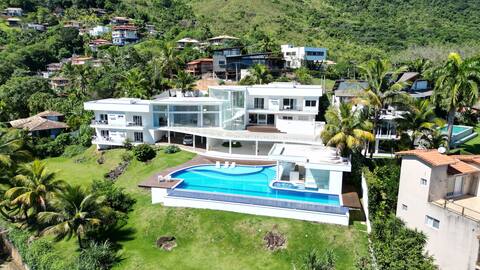
House with cinematic view with Pool and SPA
Entire Place • 5 bedrooms
Note: Performance varies based on location, size, amenities, seasonality, and management quality. Data reflects the past 12 months.
Top Performing Airbnb Hosts in Ilhabela (2026)
Learn from the best! This table showcases top-performing Airbnb hosts in Ilhabela based on the number of properties managed and estimated total revenue over the past year. Analyze their scale and performance metrics.
| Host Name | Properties | Grossing Revenue | Stay Reviews | Avg Rating |
|---|---|---|---|---|
| Bnbguests | 73 | $1,889,490 | 1238 | 4.85/5.0 |
| Anna Carolina | 73 | $715,818 | 1233 | 4.71/5.0 |
| Patricia | 5 | $435,367 | 204 | 4.95/5.0 |
| Cristina | 10 | $424,944 | 1153 | 4.84/5.0 |
| Chalés De Charme | 41 | $411,168 | 6814 | 4.68/5.0 |
| Agência Meu Anfitrião | 18 | $396,510 | 546 | 4.69/5.0 |
| Fábio | 11 | $370,849 | 903 | 4.96/5.0 |
| Jeannine | 9 | $241,026 | 1748 | 4.99/5.0 |
| Rafael | 19 | $240,954 | 183 | 4.89/5.0 |
| Nômade Urbano | 9 | $236,187 | 43 | 4.96/5.0 |
Analyzing the strategies of top hosts, such as their property selection, pricing, and guest communication, can offer valuable lessons for optimizing your own Airbnb operations in Ilhabela.
Dive Deeper: Advanced Ilhabela STR Market Data (2026)
Ready to unlock more insights? AirROI provides access to advanced metrics and comprehensive Airbnb data for Ilhabela. Explore detailed analytics beyond this report to refine your investment strategy, optimize pricing, and maximize your vacation rental profits.
Explore Advanced MetricsIlhabela Short-Term Rental Market Composition (2026): Property & Room Types
Room Type Distribution
Property Type Distribution
Market Composition Insights for Ilhabela
- The Ilhabela Airbnb market composition is heavily skewed towards Entire Home/Apt listings, which make up 76.8% of the 2,867 active rentals. This indicates strong guest preference for privacy and space.
- Looking at the property type distribution in Ilhabela, House properties are the most common (67.6%), reflecting the local real estate landscape.
- Houses represent a significant 67.6% portion, catering likely to families or larger groups.
- The presence of 10.4% Hotel/Boutique listings indicates integration with traditional hospitality.
- Smaller segments like outdoor/unique, unique stays (combined 1.5%) offer potential for unique stay experiences.
Ilhabela Airbnb Room Capacity Analysis (2026): Bedroom Distribution
Distribution of Listings by Number of Bedrooms
Room Capacity Insights for Ilhabela
- The dominant room capacity in Ilhabela is 1 bedroom listings, making up 36.2% of the market. This suggests a strong demand for properties suitable for couples or solo travelers.
- Together, 1 bedroom and 2 bedrooms properties represent 54.2% of the active Airbnb listings in Ilhabela, indicating a high concentration in these sizes.
- A significant 26.0% of listings offer 3+ bedrooms, catering to larger groups and families seeking more space in Ilhabela.
Ilhabela Vacation Rental Guest Capacity Trends (2026)
Distribution of Listings by Guest Capacity
Guest Capacity Insights for Ilhabela
- The most common guest capacity trend in Ilhabela vacation rentals is listings accommodating 8+ guests (23.6%). This suggests the primary traveler segment is likely larger groups.
- Properties designed for 8+ guests and 4 guests dominate the Ilhabela STR market, accounting for 40.1% of listings.
- 36.7% of properties accommodate 6+ guests, serving the market segment for larger families or group travel in Ilhabela.
- On average, properties in Ilhabela are equipped to host 4.2 guests.
Ilhabela Airbnb Booking Patterns (2026): Available vs. Booked Days
Available Days Distribution
Booked Days Distribution
Booking Pattern Insights for Ilhabela
- The most common availability pattern in Ilhabela falls within the 271-366 days range, representing 64.5% of listings. This suggests many properties have significant open periods on their calendars.
- Approximately 88.7% of listings show high availability (181+ days open annually), indicating potential for increased bookings or specific owner usage patterns.
- For booked days, the 31-90 days range is most frequent in Ilhabela (35.6%), reflecting common guest stay durations or potential owner blocking patterns.
- A notable 12.0% of properties secure long booking periods (181+ days booked per year), highlighting successful long-term rental strategies or significant owner usage.
Ilhabela Airbnb Minimum Stay Requirements Analysis
Distribution of Listings by Minimum Night Requirement
1 Night
430 listings
15% of total
2 Nights
1210 listings
42.2% of total
3 Nights
71 listings
2.5% of total
4-6 Nights
47 listings
1.6% of total
7-29 Nights
30 listings
1% of total
30+ Nights
1078 listings
37.6% of total
Key Insights
- The most prevalent minimum stay requirement in Ilhabela is 2 Nights, adopted by 42.2% of listings. This highlights the market's preference for shorter, flexible bookings.
- A significant segment (37.6%) caters to monthly stays (30+ nights) in Ilhabela, pointing to opportunities in the extended-stay market.
Recommendations
- Align with the market by considering a 2 Nights minimum stay, as 42.2% of Ilhabela hosts use this setting.
- If feasible, allowing 1-night stays, especially midweek or during low season, could capture last-minute bookings, as only 15% currently do.
- A 2-night minimum appears standard (42.2%). Consider this for weekends or peak periods.
- Explore offering discounts for stays of 30+ nights to attract the 37.6% of the market seeking extended stays.
- Adjust minimum nights based on seasonality – potentially shorter during low season and longer during peak demand periods in Ilhabela.
Ilhabela Airbnb Cancellation Policy Trends Analysis (2026)
Non-refundable
20 listings
0.7% of total
Refundable
27 listings
0.9% of total
Super Strict 30 Days
109 listings
3.8% of total
Super Strict 60 Days
20 listings
0.7% of total
Limited
47 listings
1.6% of total
Flexible
408 listings
14.3% of total
Moderate
570 listings
20% of total
Firm
1169 listings
40.9% of total
Strict
485 listings
17% of total
Cancellation Policy Insights for Ilhabela
- The prevailing Airbnb cancellation policy trend in Ilhabela is Firm, used by 40.9% of listings.
- A majority (57.9%) of hosts in Ilhabela utilize Firm or Strict policies, indicating a market where hosts prioritize booking security.
Recommendations for Hosts
- Consider adopting a Firm policy to align with the 40.9% market standard in Ilhabela.
- Regularly review your cancellation policy against competitors and market demand shifts in Ilhabela.
Ilhabela STR Booking Lead Time Analysis (2026)
Average Booking Lead Time by Month
Booking Lead Time Insights for Ilhabela
- The overall average booking lead time for vacation rentals in Ilhabela is 36 days.
- Guests book furthest in advance for stays during December (average 60 days), likely coinciding with peak travel demand or local events.
- The shortest booking windows occur for stays in July (average 23 days), indicating more last-minute travel plans during this time.
- Seasonally, Winter (43 days avg.) sees the longest lead times, while Summer (25 days avg.) has the shortest, reflecting typical travel planning cycles.
Recommendations for Hosts
- Use the overall average lead time (36 days) as a baseline for your pricing and availability strategy in Ilhabela.
- For December stays, consider implementing length-of-stay discounts or slightly higher rates for bookings made less than 60 days out to capitalize on advance planning.
- Target marketing efforts for the Winter season well in advance (at least 43 days) to capture early planners.
- Monitor your own booking lead times against these Ilhabela averages to identify opportunities for dynamic pricing adjustments.
Popular & Essential Airbnb Amenities in Ilhabela (2026)
Amenity Prevalence
Amenity Insights for Ilhabela
- Essential amenities in Ilhabela that guests expect include: Wifi. Lacking these (this) could significantly impact bookings.
- Popular amenities like TV, Free parking on premises, Kitchen are common but not universal. Offering these can provide a competitive edge.
Recommendations for Hosts
- Ensure your listing includes all essential amenities for Ilhabela: Wifi.
- Prioritize adding missing essentials: Wifi.
- Consider adding popular differentiators like TV or Free parking on premises to increase appeal.
- Highlight unique or less common amenities you offer (e.g., hot tub, dedicated workspace, EV charger) in your listing description and photos.
- Regularly check competitor amenities in Ilhabela to stay competitive.
Ilhabela Airbnb Guest Demographics & Profile Analysis (2026)
Guest Profile Summary for Ilhabela
- The typical guest profile for Airbnb in Ilhabela consists of primarily domestic travelers (90%), often arriving from nearby São Paulo, typically belonging to the Post-2000s (Gen Z/Alpha) group (50%), primarily speaking Portuguese or English.
- Domestic travelers account for 90.4% of guests.
- Key international markets include Brazil (90.4%) and United States (1.8%).
- Top languages spoken are Portuguese (44.5%) followed by English (30.8%).
- A significant demographic segment is the Post-2000s (Gen Z/Alpha) group, representing 50% of guests.
Recommendations for Hosts
- Target domestic marketing efforts towards travelers from São Paulo and Campinas.
- Tailor amenities and listing descriptions to appeal to the dominant Post-2000s (Gen Z/Alpha) demographic (e.g., highlight fast WiFi, smart home features, local guides).
- Highlight unique local experiences or amenities relevant to the primary guest profile.
- Consider seasonal promotions aligned with peak travel times for key origin markets.
Nearby Short-Term Rental Market Comparison
How does the Ilhabela Airbnb market stack up against its neighbors? Compare key performance metrics like average monthly revenue, ADR, and occupancy rates in surrounding areas to understand the broader regional STR landscape.
| Market | Active Properties | Monthly Revenue | Daily Rate | Avg. Occupancy |
|---|---|---|---|---|
| Riviera de São Lourenço | 10 | $2,868 | $213.78 | 46% |
| Ilha Grande | 11 | $1,783 | $166.42 | 38% |
| Tuiuti | 18 | $1,686 | $156.45 | 30% |
| Morungaba | 31 | $1,435 | $263.39 | 27% |
| Campo Limpo Paulista | 49 | $1,428 | $181.02 | 30% |
| Valinhos | 61 | $1,370 | $176.28 | 33% |
| Itatiba | 171 | $1,331 | $177.58 | 29% |
| Vargem | 48 | $1,319 | $190.42 | 28% |
| Queluz | 17 | $1,291 | $152.05 | 30% |
| Bom Jesus dos Perdões | 83 | $1,236 | $167.74 | 28% |