Campinas Airbnb Market Analysis 2026: Short Term Rental Data & Vacation Rental Statistics in São Paulo, Brazil
Is Airbnb profitable in Campinas in 2026? Explore comprehensive Airbnb analytics for Campinas, São Paulo, Brazil to uncover income potential. This 2026 STR market report for Campinas, based on AirROI data from February 2025 to January 2026, reveals key trends in the bustling market of 1,471 active listings.
Whether you're considering an Airbnb investment in Campinas, optimizing your existing vacation rental, or exploring rental arbitrage opportunities, understanding the Campinas Airbnb data is crucial. Leveraging the low regulation environment is key to maximizing your short term rental income potential. Let's dive into the specifics.
Key Campinas Airbnb Performance Metrics Overview
Monthly Airbnb Revenue Variations & Income Potential in Campinas (2026)
Understanding the monthly revenue variations for Airbnb listings in Campinas is key to maximizing your short term rental income potential. Seasonality significantly impacts earnings. Our analysis, based on data from the past 12 months, shows that the peak revenue month for STRs in Campinas is typically December, while May often presents the lowest earnings, highlighting opportunities for strategic pricing adjustments during shoulder and low seasons. Explore the typical Airbnb income in Campinas across different performance tiers:
- Best-in-class properties (Top 10%) achieve $1,372+ monthly, often utilizing dynamic pricing and superior guest experiences.
- Strong performing properties (Top 25%) earn $824 or more, indicating effective management and desirable locations/amenities.
- Typical properties (Median) generate around $441 per month, representing the average market performance.
- Entry-level properties (Bottom 25%) see earnings around $202, often with potential for optimization.
Average Monthly Airbnb Earnings Trend in Campinas
Campinas Airbnb Occupancy Rate Trends (2026)
Maximize your bookings by understanding the Campinas STR occupancy trends. Seasonal demand shifts significantly influence how often properties are booked. Typically, Februarysees the highest demand (peak season occupancy), while January experiences the lowest (low season). Effective strategies, like adjusting minimum stays or offering promotions, can boost occupancy during slower periods. Here's how different property tiers perform in Campinas:
- Best-in-class properties (Top 10%) achieve 82%+ occupancy, indicating high desirability and potentially optimized availability.
- Strong performing properties (Top 25%) maintain 66% or higher occupancy, suggesting good market fit and guest satisfaction.
- Typical properties (Median) have an occupancy rate around 42%.
- Entry-level properties (Bottom 25%) average 20% occupancy, potentially facing higher vacancy.
Average Monthly Occupancy Rate Trend in Campinas
Average Daily Rate (ADR) Airbnb Trends in Campinas (2026)
Effective short term rental pricing strategy in Campinas involves understanding monthly ADR fluctuations. The Average Daily Rate (ADR) for Airbnb in Campinas typically peaks in December and dips lowest during February. Leveraging Airbnb dynamic pricing tools or strategies based on this seasonality can significantly boost revenue. Here's a look at the typical nightly rates achieved:
- Best-in-class properties (Top 10%) command rates of $80+ per night, often due to premium features or locations.
- Strong performing properties (Top 25%) achieve nightly rates of $51 or more.
- Typical properties (Median) charge around $32 per night.
- Entry-level properties (Bottom 25%) earn around $21 per night.
Average Daily Rate (ADR) Trend by Month in Campinas
Get Live Campinas Market Intelligence 👇

Explore Real-time Analytics
Airbnb Seasonality Analysis & Trends in Campinas (2026)
Peak Season (December, September, November)
- Revenue averages $744 per month
- Occupancy rates average 43.9%
- Daily rates average $53
Shoulder Season
- Revenue averages $658 per month
- Occupancy maintains around 43.9%
- Daily rates hold near $50
Low Season (February, April, May)
- Revenue drops to average $581 per month
- Occupancy decreases to average 44.5%
- Daily rates adjust to average $47
Seasonality Insights for Campinas
- The Airbnb seasonality in Campinas shows moderate seasonality with distinct peak and low periods. While the sections above show seasonal averages, it's also insightful to look at the extremes:
- During the high season, the absolute peak month showcases Campinas's highest earning potential, with monthly revenues capable of climbing to $823, occupancy reaching a high of 51.4%, and ADRs peaking at $55.
- Conversely, the slowest single month of the year, typically falling within the low season, marks the market's lowest point. In this month, revenue might dip to $557, occupancy could drop to 34.8%, and ADRs may adjust down to $46.
- Understanding both the seasonal averages and these monthly peaks and troughs in revenue, occupancy, and ADR is crucial for maximizing your Airbnb profit potential in Campinas.
Seasonal Strategies for Maximizing Profit
- Peak Season: Maximize revenue through premium pricing and potentially longer minimum stays. Ensure high availability.
- Low Season: Offer competitive pricing, special promotions (e.g., extended stay discounts), and flexible cancellation policies. Target off-season travelers like remote workers or budget-conscious guests.
- Shoulder Seasons: Implement dynamic pricing that balances peak and low rates. Target weekend travelers or specific events. Offer slightly more flexible terms than peak season.
- Regularly analyze your own performance against these Campinas seasonality benchmarks and adjust your pricing and availability strategy accordingly.
Best Areas for Airbnb Investment in Campinas (2026)
Exploring the top neighborhoods for short-term rentals in Campinas? This section highlights key areas, outlining why they are attractive for hosts and guests, along with notable local attractions. Consider these locations based on your target guest profile and investment strategy.
| Neighborhood / Area | Why Host Here? (Target Guests & Appeal) | Key Attractions & Landmarks |
|---|---|---|
| Cambui | Upscale neighborhood known for its vibrant restaurant scene, art galleries, and proximity to shopping. Attracts both tourists and business travelers looking for a sophisticated atmosphere. | Cambui Square, Mendel Music School, Art Galleries, Shopping Centers, Charming Cafes |
| Barão Geraldo | A lively area close to universities, popular with students and young professionals. Offers a unique mix of culture and nature. | State University of Campinas (UNICAMP), Polo de Biotecnologia, Praça dos Taperás, Natural Parks, Bars and Restaurants |
| Centro | The historical center of Campinas with important cultural landmarks and a bustling commercial area. Ideal for guests wanting to explore the city's history. | Museu Carlos Gomes, Igreja da Boa Morte, Parque Portugal, Largo do Rosário, Civic Center |
| Taquaral | Family-friendly neighborhood with easy access to parks and leisure activities. Great for families seeking short-term stays. | Lagoa do Taquaral, Parque Portugal, Children's Park, Shopping Dom Pedro, Cultural Events |
| Vila Nova Cambuí | A trendy area known for its nightlife and close proximity to various amenities. Appeals to a younger crowd looking for vibrant activities. | Restaurants & Bars, Cultural Festivals, Yoga Studios, Shopping, Music Events |
| Sousas | Quaint district known for its rural charm and outdoor activities. Perfect for those seeking relaxation and nature escapes. | Hiking Trails, Natural Parks, Local Artisan Shops, Restaurants, Cultural Events |
| Jardim Chapadão | A residential area with parks and green spaces, attracting families and nature lovers. Ideal for longer-term stays. | Parque de Lagarta, Botanical Gardens, Outdoor Activities, Family Parks, Event Spaces |
| São Bernardo do Campo | A growing suburb that offers great accessibility to Campinas, popular for its affordability and community feel. | Shopping Malls, Cultural Centers, Parks, Local Markets, Community Events |
Understanding Airbnb License Requirements & STR Laws in Campinas (2026)
While Campinas, São Paulo, Brazil currently shows low STR regulations, specific Airbnb license requirements might still exist or change. Always verify the latest short term rental regulations and Airbnb license requirements directly with local government authorities for Campinas to ensure full compliance before hosting.
(Source: AirROI data, 2026, based on 0% licensed listings)
Top Performing Airbnb Properties in Campinas (2026)
Benchmark your potential! Explore examples of top-performing Airbnb properties in Campinasbased on Trailing Twelve Month (TTM) revenue. Analyze their characteristics, revenue, occupancy rate, and ADR to understand what drives success in this market.
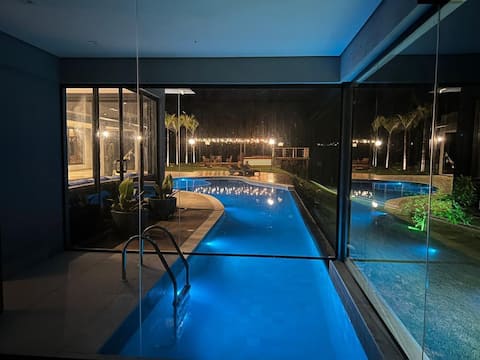
Charm and exuberance in the midst of nature
Entire Place • 5 bedrooms
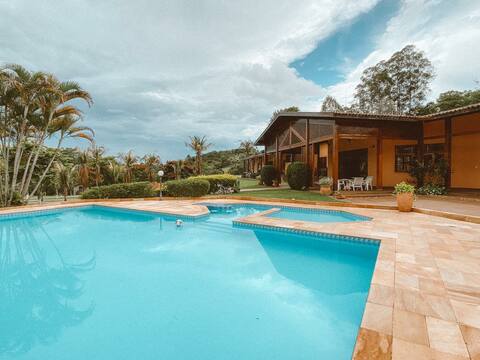
Sítio 3 Curumins
Entire Place • 5 bedrooms

Country House - Capim Santo - Sousas
Entire Place • 6 bedrooms
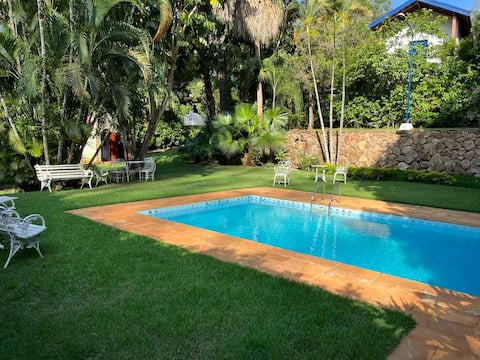
Beautiful Country House-Sousas- Campinas
Entire Place • 5 bedrooms
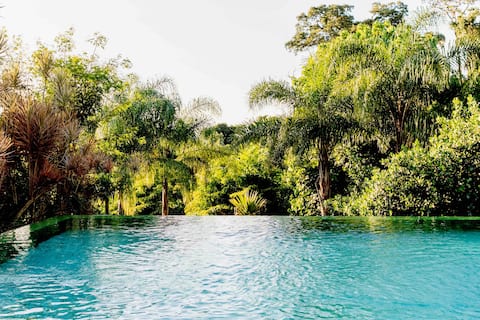
Beautiful place in Joaquim Egidio - Campinas
Entire Place • 8 bedrooms

Leisure and Comfort House 4 bedrooms with AC and Pool
Entire Place • 4 bedrooms
Note: Performance varies based on location, size, amenities, seasonality, and management quality. Data reflects the past 12 months.
Top Performing Airbnb Hosts in Campinas (2026)
Learn from the best! This table showcases top-performing Airbnb hosts in Campinas based on the number of properties managed and estimated total revenue over the past year. Analyze their scale and performance metrics.
| Host Name | Properties | Grossing Revenue | Stay Reviews | Avg Rating |
|---|---|---|---|---|
| Sofia Homes | 18 | $300,574 | 2046 | 4.94/5.0 |
| Olugar Gestão De Propriedades | 39 | $218,033 | 1413 | 4.86/5.0 |
| Ivanete | 26 | $177,695 | 892 | 4.95/5.0 |
| Luiza | 19 | $159,944 | 372 | 4.94/5.0 |
| Nômade Urbano | 10 | $148,457 | 468 | 4.89/5.0 |
| Sofia Homes | 13 | $130,840 | 525 | 4.92/5.0 |
| K Residence | 20 | $111,140 | 2420 | 4.80/5.0 |
| Marcio | 1 | $98,878 | 21 | 4.86/5.0 |
| Leonardo | 13 | $98,824 | 562 | 4.91/5.0 |
| Flavio De Oliveira | 7 | $97,762 | 430 | 4.88/5.0 |
Analyzing the strategies of top hosts, such as their property selection, pricing, and guest communication, can offer valuable lessons for optimizing your own Airbnb operations in Campinas.
Dive Deeper: Advanced Campinas STR Market Data (2026)
Ready to unlock more insights? AirROI provides access to advanced metrics and comprehensive Airbnb data for Campinas. Explore detailed analytics beyond this report to refine your investment strategy, optimize pricing, and maximize your vacation rental profits.
Explore Advanced MetricsCampinas Short-Term Rental Market Composition (2026): Property & Room Types
Room Type Distribution
Property Type Distribution
Market Composition Insights for Campinas
- The Campinas Airbnb market composition is heavily skewed towards Entire Home/Apt listings, which make up 69.5% of the 1,471 active rentals. This indicates strong guest preference for privacy and space.
- However, a notable 29% share for Private Rooms suggests opportunities for budget-conscious travelers or hosts renting out spare rooms.
- Looking at the property type distribution in Campinas, Apartment/Condo properties are the most common (52.6%), reflecting the local real estate landscape.
- Houses represent a significant 38.5% portion, catering likely to families or larger groups.
- The presence of 5.6% Hotel/Boutique listings indicates integration with traditional hospitality.
- Smaller segments like others, outdoor/unique, unique stays (combined 3.3%) offer potential for unique stay experiences.
Campinas Airbnb Room Capacity Analysis (2026): Bedroom Distribution
Distribution of Listings by Number of Bedrooms
Room Capacity Insights for Campinas
- The dominant room capacity in Campinas is 1 bedroom listings, making up 49.4% of the market. This suggests a strong demand for properties suitable for couples or solo travelers.
- Together, 1 bedroom and 2 bedrooms properties represent 62.7% of the active Airbnb listings in Campinas, indicating a high concentration in these sizes.
- Listings with 3+ bedrooms (9.7%) represent a smaller niche, potentially indicating an underserved market for larger group accommodations in Campinas.
Campinas Vacation Rental Guest Capacity Trends (2026)
Distribution of Listings by Guest Capacity
Guest Capacity Insights for Campinas
- The most common guest capacity trend in Campinas vacation rentals is listings accommodating 2 guests (28.7%). This suggests the primary traveler segment is likely couples or solo travelers.
- Properties designed for 2 guests and 4 guests dominate the Campinas STR market, accounting for 41.3% of listings.
- 13.5% of properties accommodate 6+ guests, serving the market segment for larger families or group travel in Campinas.
- On average, properties in Campinas are equipped to host 2.7 guests.
Campinas Airbnb Booking Patterns (2026): Available vs. Booked Days
Available Days Distribution
Booked Days Distribution
Booking Pattern Insights for Campinas
- The most common availability pattern in Campinas falls within the 271-366 days range, representing 46.6% of listings. This suggests many properties have significant open periods on their calendars.
- Approximately 77.3% of listings show high availability (181+ days open annually), indicating potential for increased bookings or specific owner usage patterns.
- For booked days, the 91-180 days range is most frequent in Campinas (30.8%), reflecting common guest stay durations or potential owner blocking patterns.
- A notable 23.8% of properties secure long booking periods (181+ days booked per year), highlighting successful long-term rental strategies or significant owner usage.
Campinas Airbnb Minimum Stay Requirements Analysis
Distribution of Listings by Minimum Night Requirement
1 Night
665 listings
45.2% of total
2 Nights
257 listings
17.5% of total
3 Nights
103 listings
7% of total
4-6 Nights
97 listings
6.6% of total
7-29 Nights
81 listings
5.5% of total
30+ Nights
268 listings
18.2% of total
Key Insights
- The most prevalent minimum stay requirement in Campinas is 1 Night, adopted by 45.2% of listings. This highlights the market's preference for shorter, flexible bookings.
- A strong majority (62.7%) of the Campinas Airbnb data shows acceptance of very short stays (1-2 nights), indicating a dynamic, high-turnover market.
- A significant segment (18.2%) caters to monthly stays (30+ nights) in Campinas, pointing to opportunities in the extended-stay market.
Recommendations
- Align with the market by considering a 1 Night minimum stay, as 45.2% of Campinas hosts use this setting.
- Explore offering discounts for stays of 30+ nights to attract the 18.2% of the market seeking extended stays.
- Adjust minimum nights based on seasonality – potentially shorter during low season and longer during peak demand periods in Campinas.
Campinas Airbnb Cancellation Policy Trends Analysis (2026)
Limited
19 listings
1.3% of total
Flexible
522 listings
35.6% of total
Moderate
432 listings
29.4% of total
Firm
397 listings
27% of total
Strict
98 listings
6.7% of total
Cancellation Policy Insights for Campinas
- The prevailing Airbnb cancellation policy trend in Campinas is Flexible, used by 35.6% of listings.
- There's a relatively balanced mix between guest-friendly (65.0%) and stricter (33.7%) policies, offering choices for different guest needs.
- Strict cancellation policies are quite rare (6.7%), potentially making listings with this policy less competitive unless justified by high demand or property type.
Recommendations for Hosts
- Consider adopting a Flexible policy to align with the 35.6% market standard in Campinas.
- Using a Strict policy might deter some guests, as only 6.7% of listings use it. Evaluate if potential revenue protection outweighs possible lower booking rates.
- Regularly review your cancellation policy against competitors and market demand shifts in Campinas.
Campinas STR Booking Lead Time Analysis (2026)
Average Booking Lead Time by Month
Booking Lead Time Insights for Campinas
- The overall average booking lead time for vacation rentals in Campinas is 22 days.
- Guests book furthest in advance for stays during December (average 28 days), likely coinciding with peak travel demand or local events.
- The shortest booking windows occur for stays in February (average 16 days), indicating more last-minute travel plans during this time.
- Seasonally, Fall (25 days avg.) sees the longest lead times, while Spring (20 days avg.) has the shortest, reflecting typical travel planning cycles.
Recommendations for Hosts
- Use the overall average lead time (22 days) as a baseline for your pricing and availability strategy in Campinas.
- Target marketing efforts for the Fall season well in advance (at least 25 days) to capture early planners.
- Monitor your own booking lead times against these Campinas averages to identify opportunities for dynamic pricing adjustments.
Popular & Essential Airbnb Amenities in Campinas (2026)
Amenity Prevalence
Amenity Insights for Campinas
- Essential amenities in Campinas that guests expect include: Wifi. Lacking these (this) could significantly impact bookings.
- Popular amenities like Kitchen, TV, Dishes and silverware are common but not universal. Offering these can provide a competitive edge.
Recommendations for Hosts
- Ensure your listing includes all essential amenities for Campinas: Wifi.
- Prioritize adding missing essentials: Wifi.
- Consider adding popular differentiators like Kitchen or TV to increase appeal.
- Highlight unique or less common amenities you offer (e.g., hot tub, dedicated workspace, EV charger) in your listing description and photos.
- Regularly check competitor amenities in Campinas to stay competitive.
Campinas Airbnb Guest Demographics & Profile Analysis (2026)
Guest Profile Summary for Campinas
- The typical guest profile for Airbnb in Campinas consists of primarily domestic travelers (91%), often arriving from nearby São Paulo, typically belonging to the Post-2000s (Gen Z/Alpha) group (50%), primarily speaking Portuguese or English.
- Domestic travelers account for 91.3% of guests.
- Key international markets include Brazil (91.3%) and United States (2.3%).
- Top languages spoken are Portuguese (43.7%) followed by English (31.9%).
- A significant demographic segment is the Post-2000s (Gen Z/Alpha) group, representing 50% of guests.
Recommendations for Hosts
- Target domestic marketing efforts towards travelers from São Paulo and Rio de Janeiro.
- Tailor amenities and listing descriptions to appeal to the dominant Post-2000s (Gen Z/Alpha) demographic (e.g., highlight fast WiFi, smart home features, local guides).
- Highlight unique local experiences or amenities relevant to the primary guest profile.
- Consider seasonal promotions aligned with peak travel times for key origin markets.
Nearby Short-Term Rental Market Comparison
How does the Campinas Airbnb market stack up against its neighbors? Compare key performance metrics like average monthly revenue, ADR, and occupancy rates in surrounding areas to understand the broader regional STR landscape.
| Market | Active Properties | Monthly Revenue | Daily Rate | Avg. Occupancy |
|---|---|---|---|---|
| Riviera de São Lourenço | 10 | $2,868 | $213.78 | 46% |
| Tuiuti | 18 | $1,686 | $156.45 | 30% |
| Itupeva | 136 | $1,561 | $225.82 | 28% |
| Morungaba | 31 | $1,435 | $263.39 | 27% |
| Campo Limpo Paulista | 49 | $1,428 | $181.02 | 30% |
| Valinhos | 61 | $1,370 | $176.28 | 33% |
| Itatiba | 171 | $1,331 | $177.58 | 29% |
| Vargem | 48 | $1,319 | $190.42 | 28% |
| Elias Fausto | 13 | $1,296 | $143.78 | 30% |
| Porto Feliz | 69 | $1,279 | $260.86 | 27% |