
Unit Revenue
Key Takeaways
- Unit Revenue = Sum of all guest charges for one listing (excluding taxes) over a given period
- A single property's unit revenue is the raw material for portfolio metrics — RevPAL is the average; unit revenue is the data behind it
- AirROI data shows annual unit revenue ranging from $21,970 in New York to $50,438 in Gatlinburg, driven by both ADR and occupancy
- ADR and occupancy rate are the two primary levers — unit revenue is their product, scaled to a full year
- Tracking unit revenue monthly reveals seasonality patterns; tracking it annually identifies structural underperformers in a portfolio
How to Calculate Unit Revenue
Unit revenue is additive across all revenue streams for one listing:
Unit Revenue = Nightly Revenue + Cleaning Fees + Ancillary Fees (excluding taxes collected)
A single listing's monthly example:
| Revenue Component | Amount |
|---|---|
| Nightly revenue (22 booked nights) | $4,200 |
| Cleaning fees (8 turnovers) | $960 |
| Extra guest fees | $180 |
| Pet fees | $75 |
| Taxes collected | -$510 (excluded) |
| Unit Revenue | $5,415 |
Annualizing this figure across 12 months — accounting for seasonal variation — produces the annual unit revenue, the most comparable metric across markets and property types.
Annual Unit Revenue Across US Markets
Market choice is the single largest determinant of unit revenue. AirROI's trailing-12-month data across 69,631 active listings shows a more than 2× spread between the strongest and weakest major US markets.
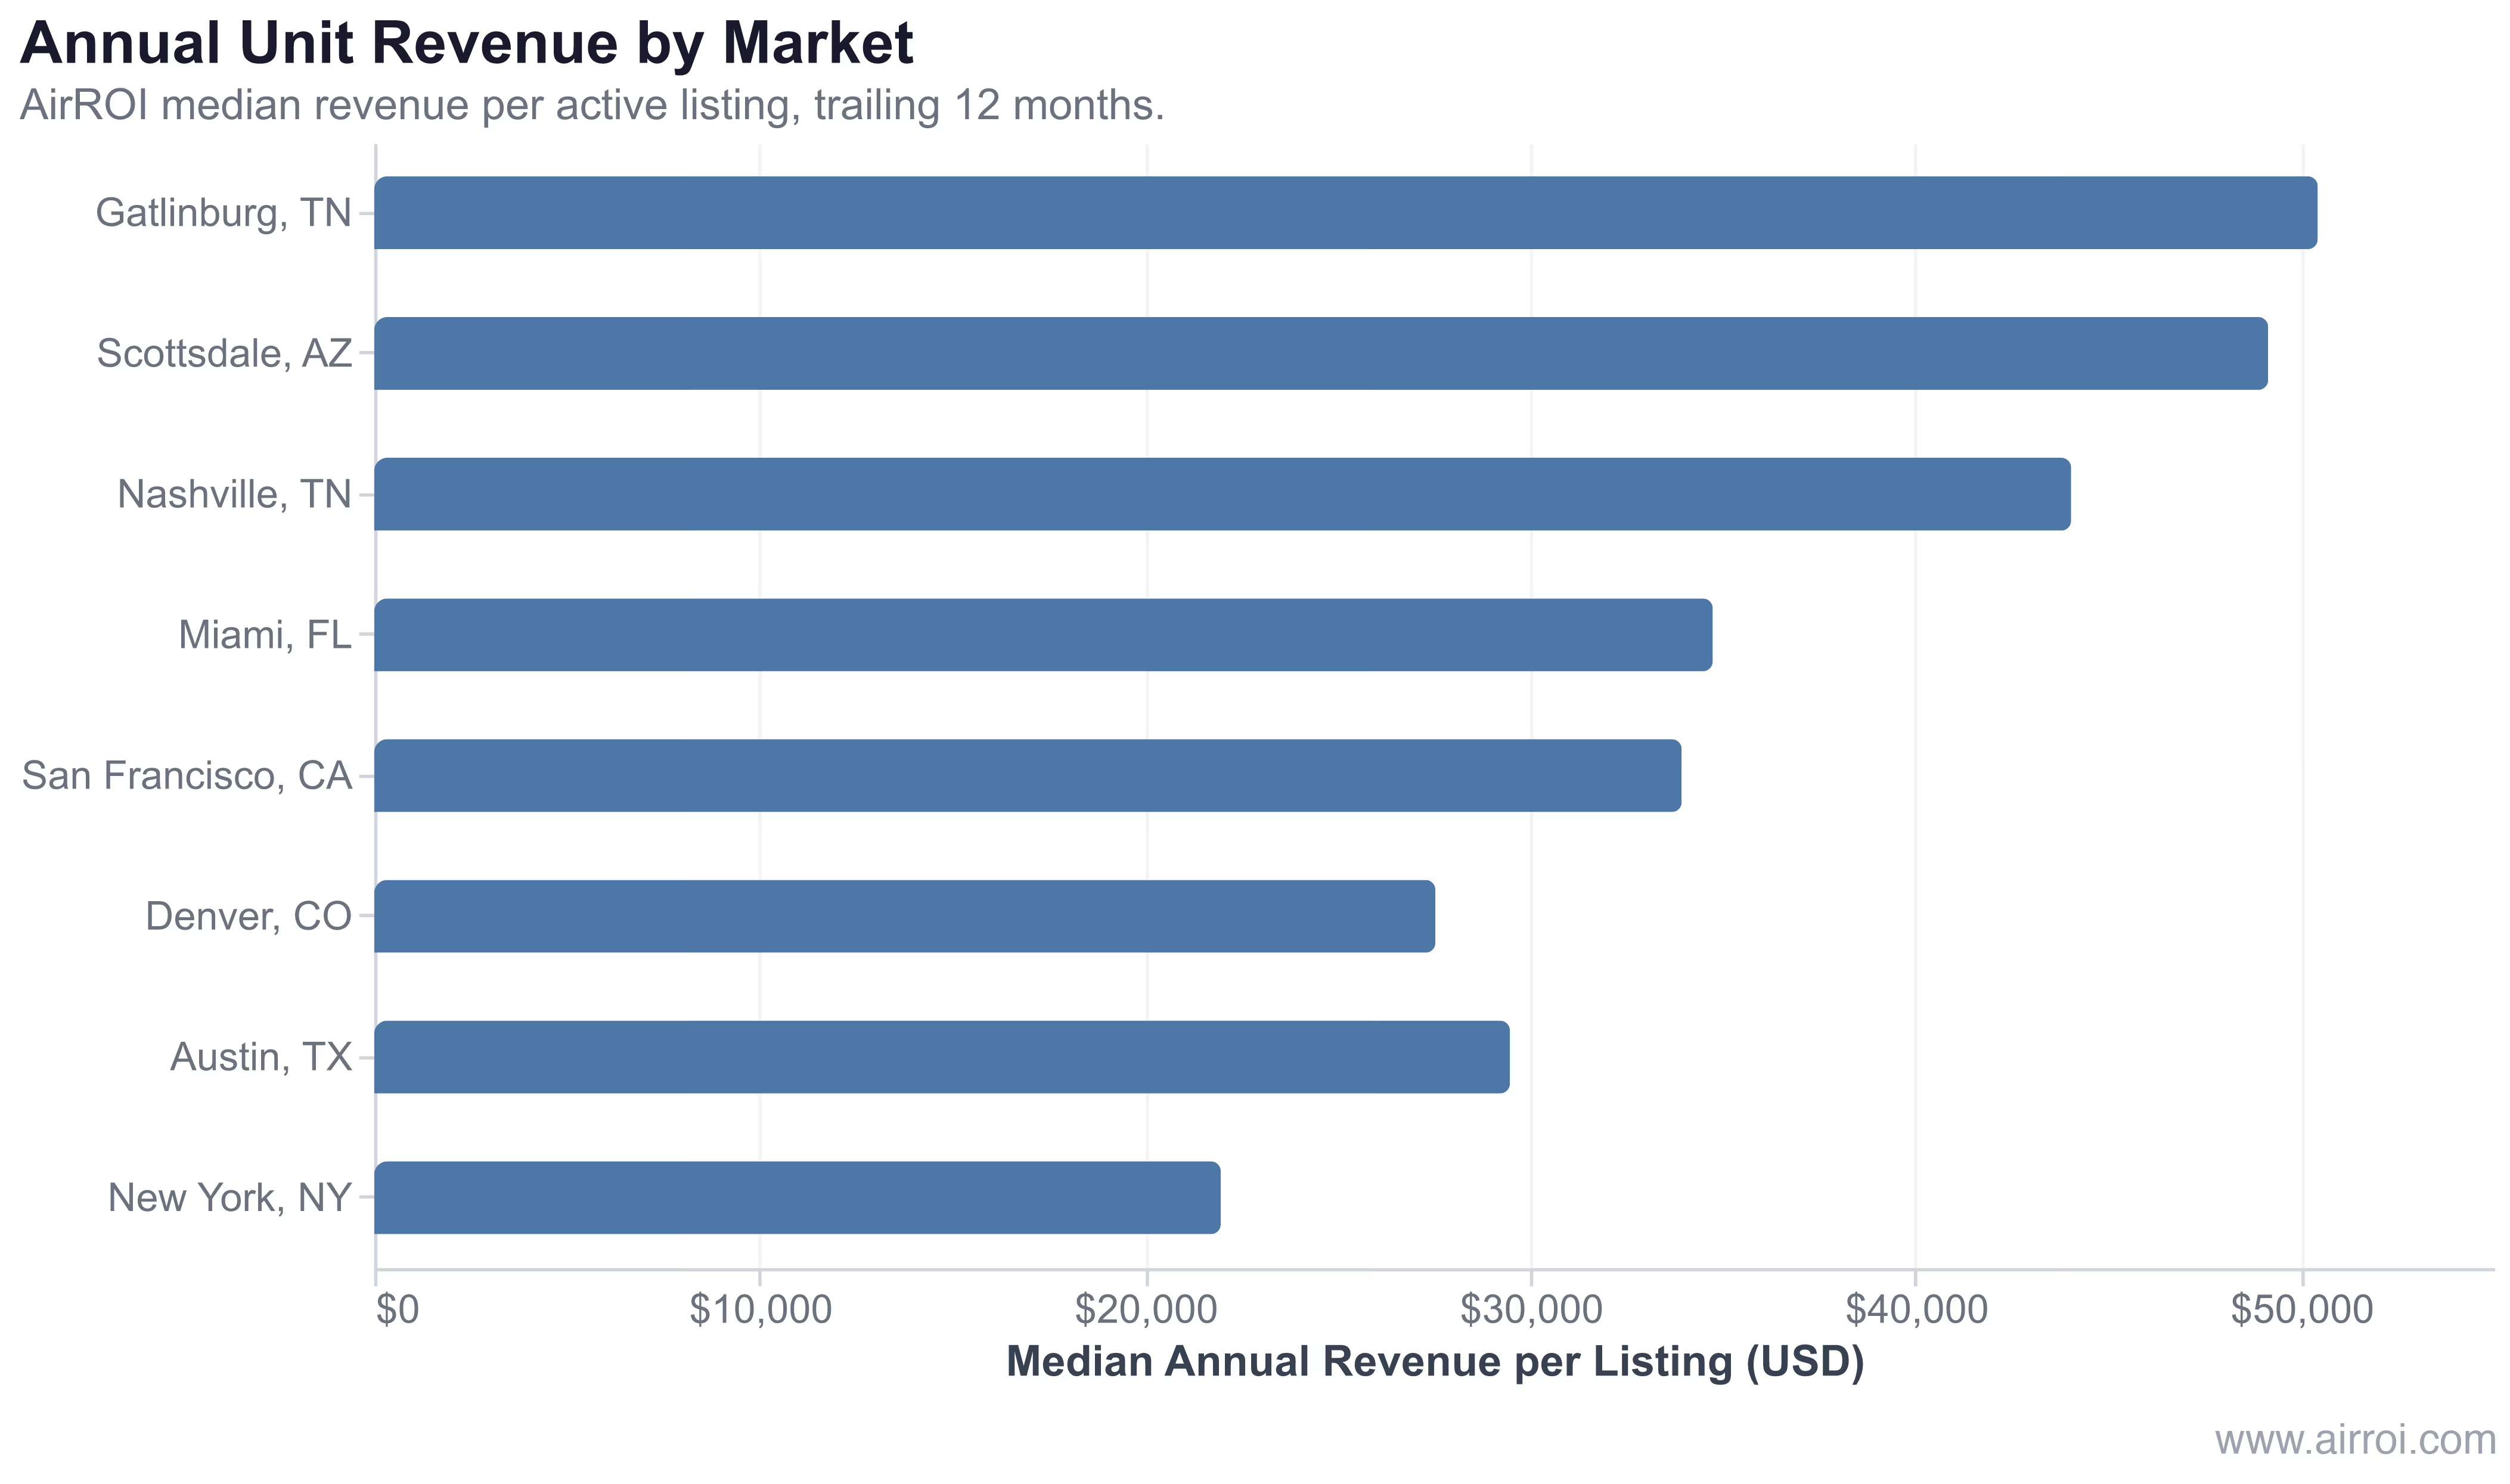
In AirROI's analysis of 69,631 active listings across eight US markets, Gatlinburg leads at $50,438 per listing annually — driven by strong ADR ($376.50) despite mid-range occupancy (47%). New York sits at the bottom of this set at $21,970, a product of Local Law 18's 30-day minimum stay requirement compressing booking volume. San Diego ($53,472) and Nashville ($44,039) fill the middle range, each reaching strong unit revenue through different combinations of ADR and occupancy.
Unit revenue is where ADR and occupancy converge into a single, unambiguous verdict on a listing's performance. A high ADR means nothing if occupancy craters; strong occupancy at low rates tells only half the story. Unit revenue tells the whole one.
Why Unit Revenue Matters for Portfolio Managers
Portfolio ranking is unit revenue's primary use case. Sorting listings from highest to lowest revenue makes outliers visible immediately — a listing generating $18,000 in a market where peers average $35,000 warrants investigation before any other metric is examined.
Owner reporting depends on it. Property managers who report unit revenue alongside fees and expenses give owners a transparent view of gross performance before deductions. It removes ambiguity and builds trust.
Unit Revenue Benchmarks by Property Type
These ranges reflect market-wide medians across US STR markets — individual listings with strong management, Superhost status, or premium amenities routinely outperform:
| Property Type | Typical Annual Unit Revenue |
|---|---|
| Urban studio / 1BR | $18,000–$36,000 |
| Urban 2–3BR | $28,000–$60,000 |
| Suburban single-family | $24,000–$52,000 |
| Vacation coastal | $36,000–$80,000 |
| Mountain / cabin | $30,000–$65,000 |
| Luxury / unique stays | $60,000–$200,000+ |
How to Increase Unit Revenue
Reduce occupancy gaps. Minimum-stay adjustments that fill weekend orphan nights and shoulder-season gaps translate directly into unit revenue without touching ADR. In Nashville, where average length of stay is just 3.7 nights, flexible minimum-stay rules are a key occupancy lever.
Pursue Superhost status. The data above is explicit: Superhost listings in strong markets earn 66–83% more annual revenue than non-Superhosts. That gap exists across all property types and compresses meaningfully at the portfolio level when multiple listings earn the badge.
Frequently Asked Questions
Unit revenue is the total revenue generated by a single listing over a given period, excluding taxes. It includes nightly rates, cleaning fees, and all other guest charges, giving each property a single number that captures its full revenue contribution to a portfolio.
Unit revenue is the actual total earned by one specific listing. RevPAL (Revenue Per Available Listing) is the portfolio average. If five listings earn $21,970, $27,540, $34,738, $44,039, and $50,438, the RevPAL is $35,745 — but unit revenue surfaces which listings are dragging the average down.
ADR and occupancy rate are the primary levers: higher nightly rates and more booked nights both compound into higher unit revenue. Market demand, regulatory environment, property type, and amenity quality all shape those two inputs. AirROI data shows annual unit revenue ranging from $21,970 in New York to $50,438 in Gatlinburg across US markets.
Tracking unit revenue lets property managers rank listings by revenue contribution, identify underperformers for corrective action, justify management fees to owners with concrete figures, and make defensible add-or-drop decisions for the portfolio.
The fastest levers are dynamic pricing to capture demand premiums, minimum-stay adjustments to reduce unbooked gaps, and cleaning-fee optimization. Longer term, amenity upgrades and Superhost status lift both ADR and occupancy, compounding into meaningfully higher annual unit revenue.