
Paid Occupancy Rate
Key Takeaways
- Paid Occupancy Rate = (Paid Guest Nights ÷ Total Available Nights) × 100
- Excludes owner use, comp stays, and non-revenue nights from the numerator
- Always equal to or lower than total occupancy rate
- Multiplied by ADR, it produces RevPAR — the single most useful STR revenue KPI
- AirROI data across 10 major US markets shows paid occupancy ranging from 42% (Las Vegas) to 55% (San Francisco)
How to Calculate Paid Occupancy Rate
Formula:
Paid Occupancy Rate = (Paid Guest Nights ÷ Total Available Nights) × 100
Example:
Your property was available for 30 nights in a given month. It was occupied for 24 nights total — but 4 were owner stays and 1 was a complimentary guest:
- Paid Guest Nights = 24 − 4 − 1 = 19
- Paid Occupancy Rate = (19 ÷ 30) × 100 = 63.3%
Compare this to the total occupancy of 80% (24 ÷ 30). The 16.7 percentage-point gap represents non-revenue occupancy — nights that generate zero income but consume your available inventory.
Paid Occupancy vs. Other Occupancy Metrics
Three occupancy measures are commonly reported for short-term rentals; each serves a different purpose:
| Metric | Numerator | Denominator | Best For |
|---|---|---|---|
| Total Occupancy | All occupied nights | All calendar nights | Overall utilization |
| Paid Occupancy | Paid guest nights only | All available nights | Revenue performance |
| Adjusted Occupancy | Booked nights | Available nights (excl. owner blocks) | Host benchmark comparison |
Total occupancy is the figure most booking platforms display by default. Adjusted occupancy removes owner-blocked periods from the denominator, making your performance look stronger than paid occupancy does. Paid occupancy is the most conservative and most investor-useful — it reflects exactly what the market is paying you for.
Paid Occupancy Rate Across US STR Markets
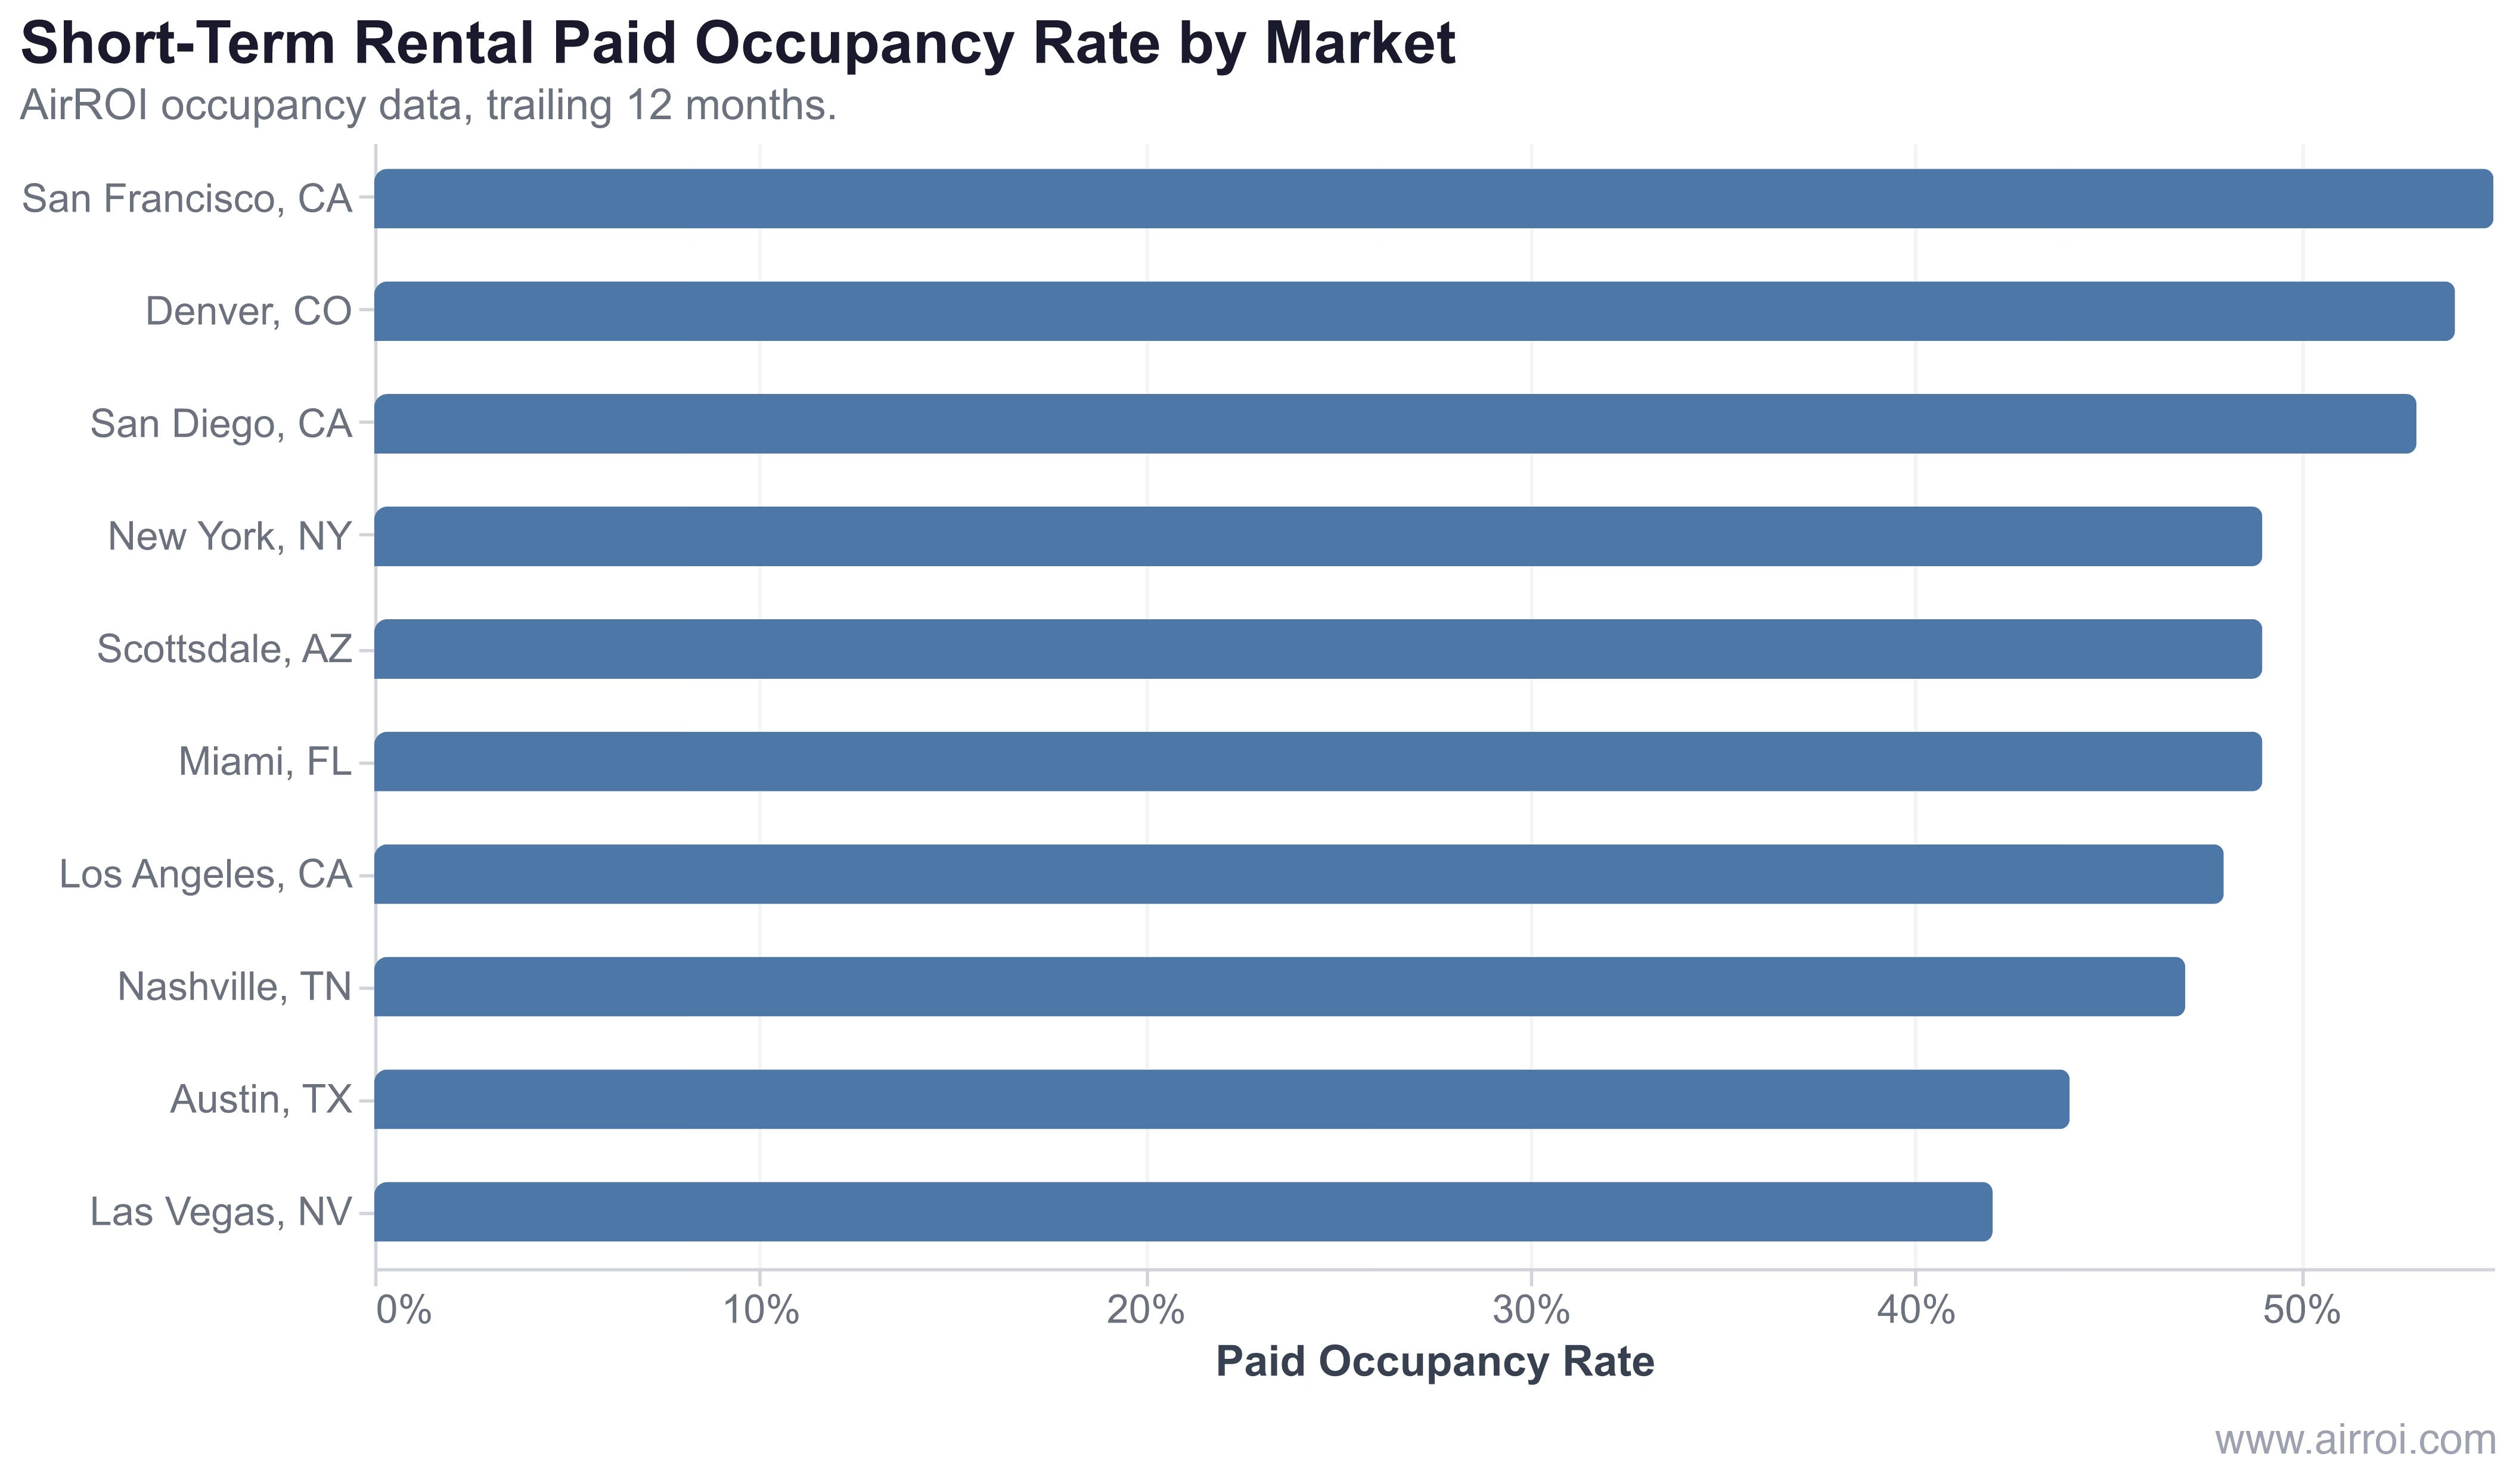
In AirROI's analysis of approximately 69,800 active listings across 10 US markets, paid occupancy ranges from 42% in Las Vegas to 55% in San Francisco. The spread is narrower than ADR spreads, which means that across most US markets, revenue differences are driven more by nightly rates than by how full a calendar is.
| Market | Paid Occupancy | ADR | RevPAR |
|---|---|---|---|
| San Francisco, CA | 55% | $273.5 | $152.1 |
| Denver, CO | 54% | $221.5 | $120.0 |
| San Diego, CA | 53% | $394.9 | $212.2 |
| Miami, FL | 49% | $291.0 | $142.9 |
| New York, NY | 49% | $224.7 | $120.5 |
| Scottsdale, AZ | 49% | $421.1 | $210.3 |
| Los Angeles, CA | 48% | $311.6 | $154.0 |
| Nashville, TN | 47% | $353.6 | $160.2 |
| Austin, TX | 44% | $297.7 | $129.8 |
| Las Vegas, NV | 42% | $274.2 | $115.1 |
The gap between a 47% and a 55% paid occupancy rate is 8 percentage points — but at $300 ADR, that gap is worth roughly $8,760 in annual revenue. Closing it through dynamic pricing, minimum-night optimization, and shoulder-season promotions is one of the highest-leverage moves an STR operator can make.
Why Paid Occupancy Rate Matters for Airbnb Hosts
Owner use impact. If you block 30 nights per year for personal stays at an average ADR of $280, you are forgoing roughly $8,400 in potential revenue. Paid occupancy makes that opportunity cost explicit in a way total occupancy never does.
How to Improve Your Paid Occupancy Rate
- Schedule owner stays in low-demand windows. Use AirROI market data to identify the weeks where demand is softest — those are the lowest-opportunity-cost nights to reserve for personal use.
- Implement dynamic pricing. Automated pricing engines fill shoulder-season gaps and last-minute openings that flat-rate pricing leaves empty. Closing-window pricing strategies alone recover multiple percentage points of annual paid occupancy.
- Reduce minimum-stay requirements during gap nights. A 3-night gap between bookings vanishes if your minimum is 3 nights; it stays empty if your minimum is 4. Flexible minimums convert dead calendar space into paid nights.
- Offer last-minute discounts strategically. Converting a night from $0 to $180 (a 40% discount off rack rate) is cash-flow positive the moment it crosses your variable cost floor — which for most STRs is just cleaning.
- Track paid occupancy separately in your reporting. Tools that aggregate total occupancy obscure the revenue cost of owner use. Maintain a dedicated paid-nights column so the metric stays visible.
Frequently Asked Questions
Total occupancy includes all nights the property is occupied, whether by paying guests, the owner, or complimentary stays. Paid occupancy only counts nights where a paying guest generated revenue, making it a more accurate measure of income-producing performance.
Divide the number of paid guest nights by the total available nights, then multiply by 100. For example, if your property had 20 paid guest nights out of 30 available nights, your paid occupancy rate is 66.7%.
Paid occupancy rate directly correlates to revenue generation. A property might show 80% total occupancy, but if 15% of that is owner use, the paid occupancy is only 65%. Investors need paid occupancy to accurately project rental income and calculate return metrics.
A paid occupancy rate of 50% to 65% is competitive in most US short-term rental markets. San Francisco leads AirROI's tracked markets at 55%, while Las Vegas sits at 42%. Market type, seasonality, and minimum-night settings all shift the benchmark significantly.
RevPAR equals ADR multiplied by paid occupancy rate. A listing charging $300 ADR at 55% paid occupancy earns $165 RevPAR — the same as a $220 listing running at 75%. Raising paid occupancy directly lifts RevPAR without touching your nightly rate.