
What Is Adjusted Occupancy Rate in Short-Term Rentals
Key Takeaways
- Adjusted Occupancy = (Booked Nights ÷ Bookable Nights) × 100, where Bookable Nights = Calendar Nights − Owner-Blocked Nights
- Always equal to or higher than standard occupancy for the same property in the same period
- Removes personal-use distortion so hosts and property managers can evaluate pricing and marketing effectiveness on equal footing
- Most useful when combined with paid occupancy rate and RevPAR for a complete revenue picture
- AirROI's trailing-12-month data shows market-median occupancy ranging from 44% (Austin) to 55% (San Francisco) — benchmarks that become meaningful only when owner blocks are stripped out
How to Calculate Adjusted Occupancy Rate
Formula:
Adjusted Occupancy Rate = (Booked Nights ÷ Bookable Nights) × 100
Where: Bookable Nights = Total Calendar Nights − Owner-Blocked Nights
Worked example:
Your property has 30 calendar nights in a month. You blocked 8 nights for personal use and booked 18 guest nights:
- Bookable Nights = 30 − 8 = 22
- Adjusted Occupancy Rate = (18 ÷ 22) × 100 = 81.8%
- Standard Occupancy Rate = (18 ÷ 30) × 100 = 60.0%
The 21-point spread is entirely attributable to owner blocks. Strip those out and the same listing is performing in the top tier of most markets.
Adjusted vs. Standard Occupancy: Side-by-Side
| Scenario | Calendar Nights | Owner Blocks | Booked | Standard Occupancy | Adjusted Occupancy |
|---|---|---|---|---|---|
| No owner use | 30 | 0 | 22 | 73.3% | 73.3% |
| Light owner use | 30 | 5 | 20 | 66.7% | 80.0% |
| Heavy owner use | 30 | 15 | 12 | 40.0% | 80.0% |
| Seasonal vacation home | 30 | 20 | 8 | 26.7% | 80.0% |
All four scenarios reflect an identical booking conversion rate of 80% against available supply — yet standard occupancy paints a picture ranging from strong to alarming. Adjusted occupancy tells the truth.
STR Occupancy Rates Across Key Markets
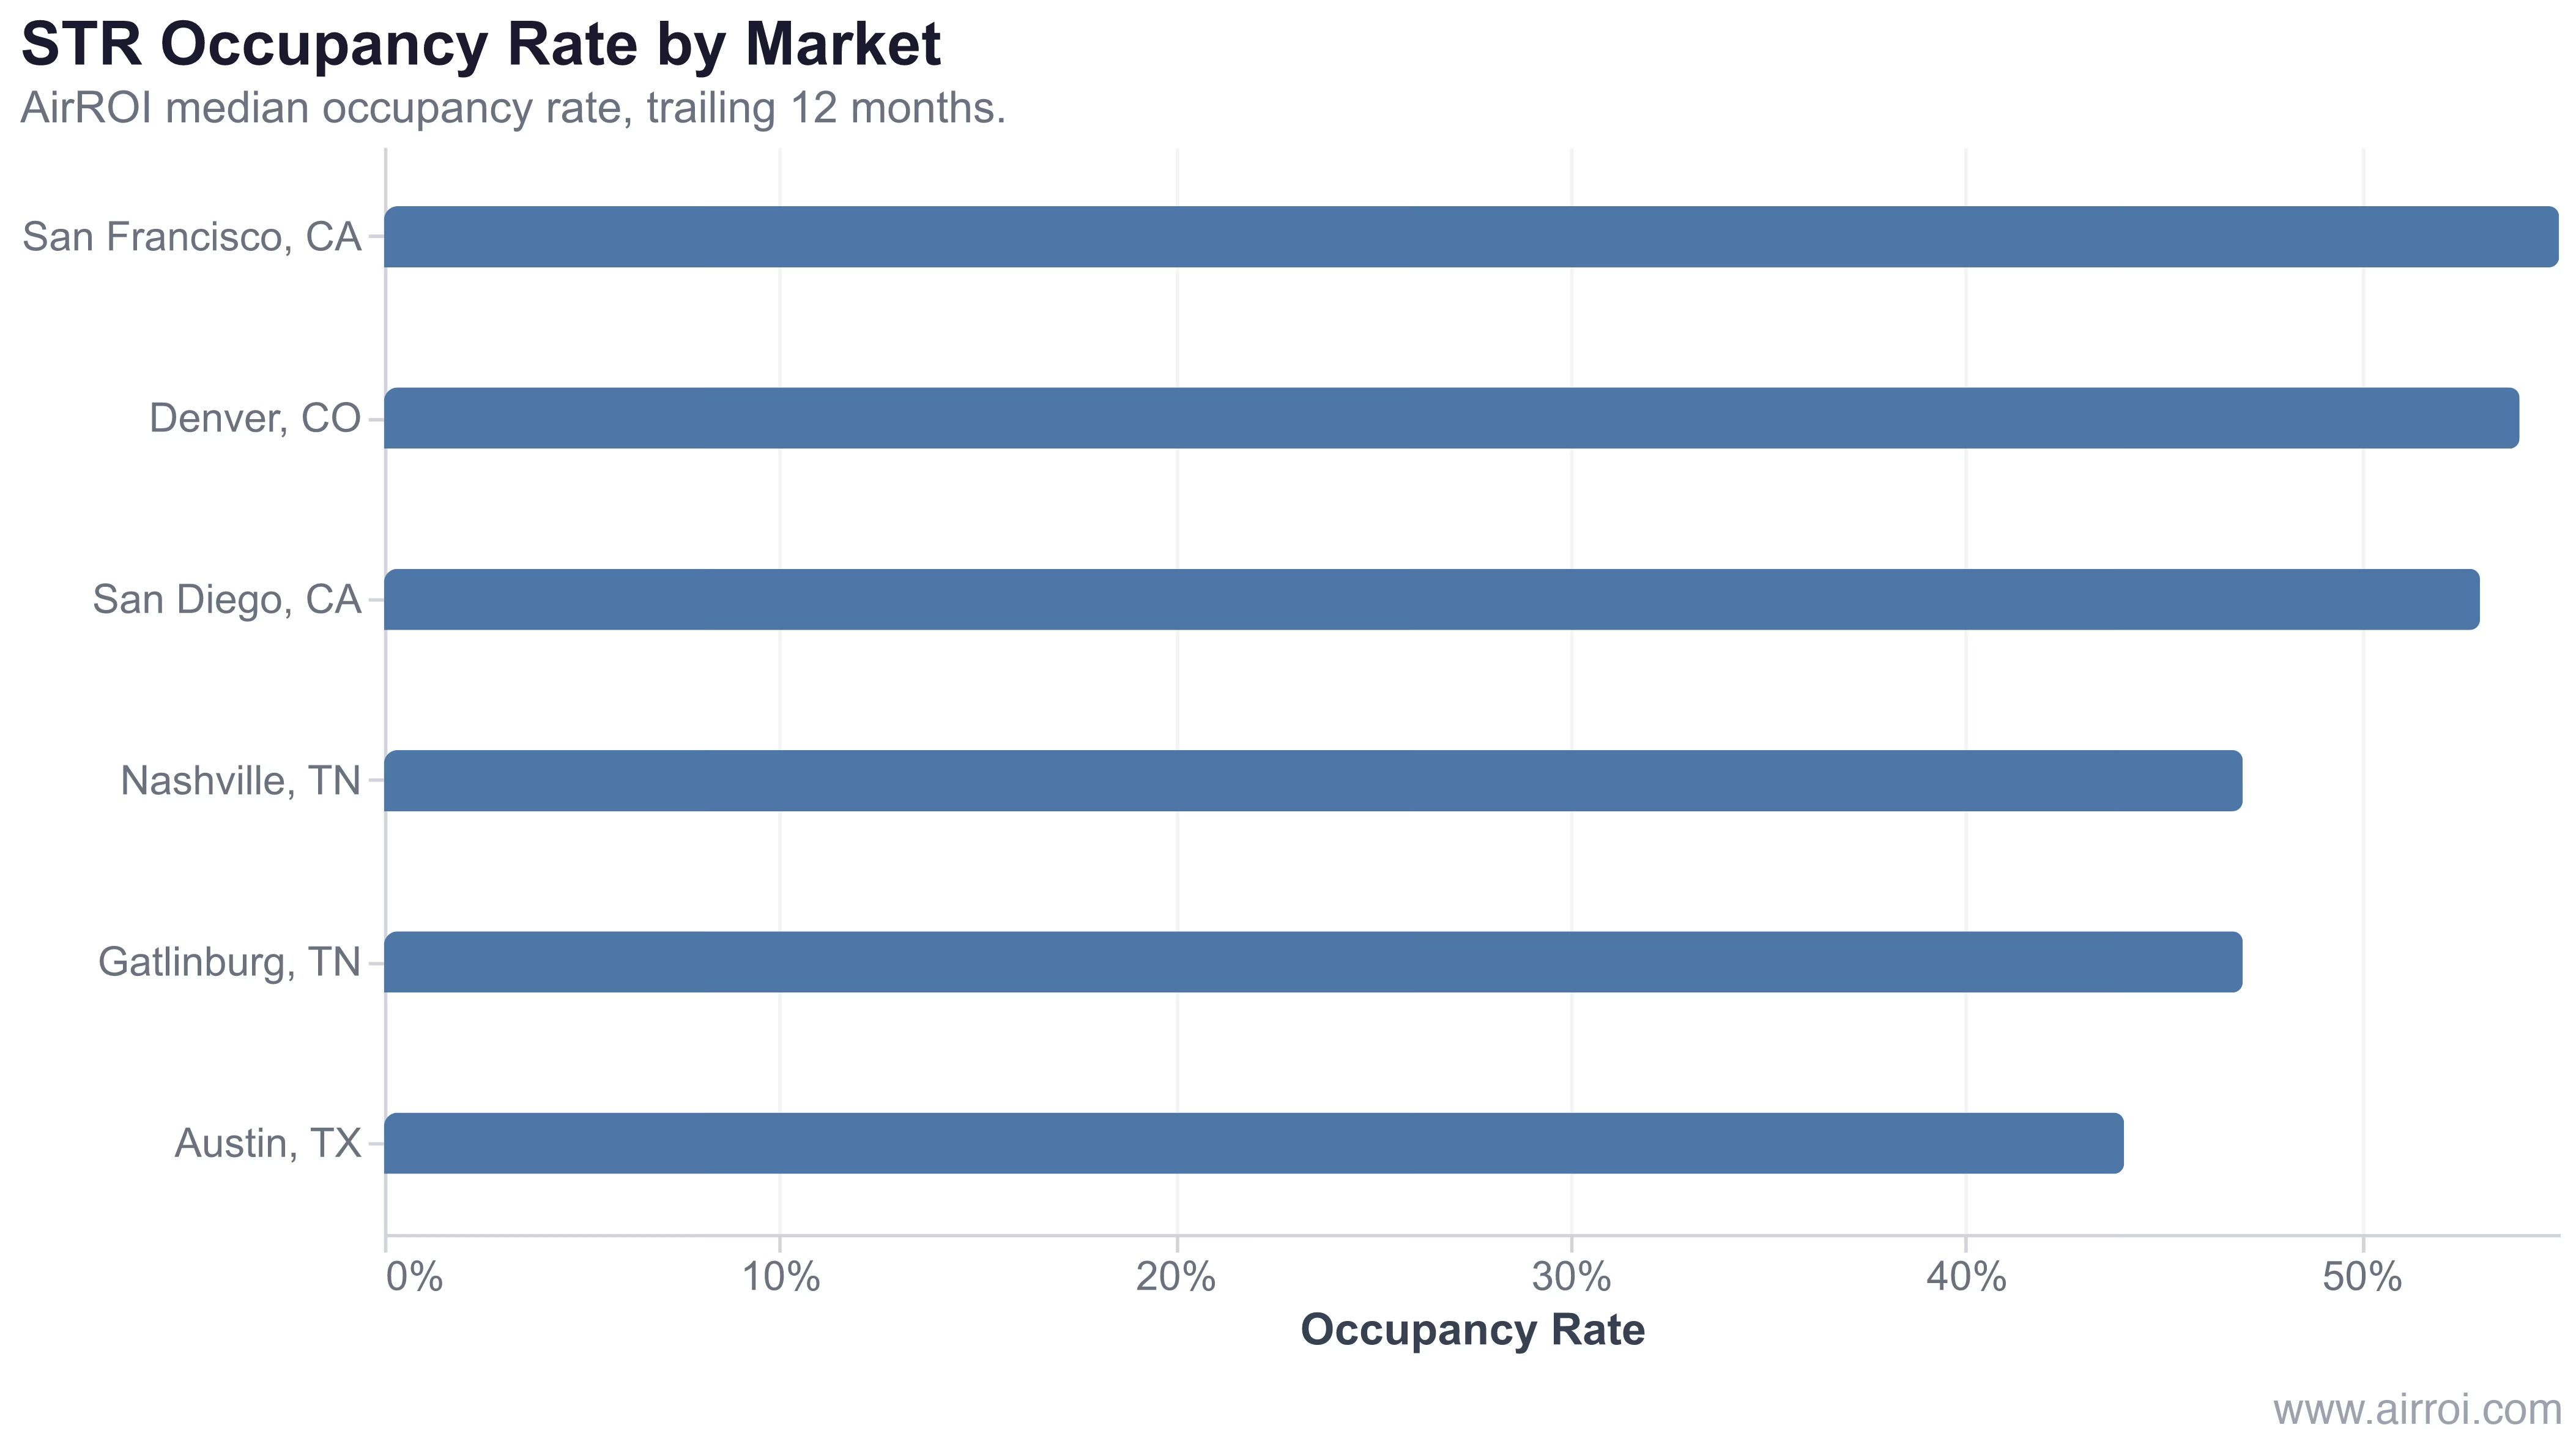
In AirROI's analysis of 36,215 active listings across San Francisco, Denver, San Diego, Nashville, Gatlinburg, and Austin, market-median occupancy spans from 44% in Austin to 55% in San Francisco — an 11-point range driven by local demand density, regulatory supply constraints, and seasonal booking patterns. San Francisco's regulatory cap on short-stay listings (Local Law 18's West Coast equivalent) has compressed active supply, pushing occupancy up; Austin's post-pandemic supply surge has done the opposite.
The most useful occupancy number is not the one your calendar shows — it is the one that reflects only the nights you actually offered to guests. Adjusted occupancy is the only metric that makes that distinction.
Why Adjusted Occupancy Rate Matters for STR Investors
Accurate self-assessment. A standard occupancy of 40% can mask an adjusted occupancy of 80%. If your goal is to maximize revenue on the nights you rent, the adjusted figure is the relevant performance indicator.
How to Improve Adjusted Occupancy Rate
Reduce minimum-stay restrictions on remaining bookable nights. Long minimums create dead-zone gaps that neither short nor long bookings can fill. The basket shows that Nashville's median minimum stay is 5.6 nights — markets with shorter minimums consistently absorb more last-minute demand.
Monitor booking lead time relative to your bookable calendar. If guests in your market book 47 days out on average (San Francisco's median) but your remaining availability opens in two weeks, early-bird pricing on those dates won't reach buyers in time.
Analyze pacing data by date range. Not all bookable nights underperform equally. Pacing tools show which specific windows are booking slowly so you can run targeted promotions before the window closes entirely.
Review your blocked-night patterns. Hosts who block predictably — the same two weeks every summer — can pre-set pricing and minimum stays for the weeks flanking those blocks to capture the compression demand those gaps create.
Frequently Asked Questions
Adjusted occupancy rate measures the percentage of bookable nights that are actually booked, excluding nights blocked by the owner for personal use or maintenance. It gives a more accurate picture of how well your listing converts available inventory into bookings.
Standard occupancy divides booked nights by all calendar nights. Adjusted occupancy removes owner-blocked nights from the denominator. If you block 10 nights for personal use out of 30, adjusted occupancy uses 20 as the denominator instead of 30, resulting in a higher and more representative rate.
Use adjusted occupancy when you want to evaluate your listing's booking performance independent of personal use decisions. It is especially useful for hosts who frequently block nights and want to know how effective their pricing and marketing are at filling the nights they actually make available.
A strong adjusted occupancy rate is typically 55–70% for most markets. AirROI data shows top performers like San Francisco reaching 55% on a market-median basis, while demand-constrained markets like Austin sit closer to 44%. Beating your market median by 10+ points usually signals an above-average listing.
Airbnb's host dashboard shows calendar-based occupancy, not adjusted occupancy. To calculate your adjusted rate, divide your total booked nights by your total bookable nights (excluding owner blocks) using your calendar data. Third-party STR analytics tools typically surface this figure automatically.