Ski Airbnb Market Revenue Winter 2026-2027: Rates Up, RevPAR Down

Ski Airbnb market revenue for winter 2026-2027 is being priced right now against a season in which the rate increase already failed. Across AirROI's panel of 14 US ski markets and more than 24,000 active listings, average daily rate rose last winter in all 14. Occupancy fell in all 14. And RevPAR — the number that actually pays the mortgage — still finished lower in 8 of them.
That is not a story about supply, and it is not a story about a few overpriced outliers. It is the same decision, made in the same direction, in every market on the panel, producing a worse result in most of them. Daniel Leifeld, director of business development at Key Data, described the mechanism to VailDaily in July:
"We're kind of ignoring the very obvious fact that there's low occupancy and pushing the rate somewhat to cover that lost occupancy, but it's not working. We're not making more money because of that. Let's not be quite so aggressive raising rates when occupancy or demand is this low."
The timing matters. In the longest-lead ski markets, the average winter booking arrives 86 to 104 days ahead of the stay, which means December's rate is effectively being set in August. The anchor most hosts are reaching for is last season's realized ADR — the one number on the record that already proved it does not clear.
Ski Markets Raised Rates Last Winter. It Did Not Work
The full 14-market panel shows a rate increase applied almost universally and a RevPAR outcome that ranged from +21.6% to −16.0%. Median occupancy fell 5.6 points, median ADR rose 18.1%, and median RevPAR landed at −2.2%. Winter is defined here as December through March, with winter 2024-25 measured from AirROI's July 2025 snapshot and winter 2025-26 from the June 2026 snapshot so that both seasons carry symmetric survivorship.
| Market | Occ 24-25 | Occ 25-26 | Δpp | ADR 24-25 | ADR 25-26 | ΔADR | RevPAR 24-25 | RevPAR 25-26 | ΔRevPAR | Supply Δ |
|---|---|---|---|---|---|---|---|---|---|---|
| Jackson, WY | 34.7% | 32.2% | −2.5 | $540 | $648 | +20.0% | $171 | $208 | +21.6% | +10.5% |
| Whitefish, MT | 23.0% | 21.4% | −1.6 | $425 | $502 | +18.1% | $107 | $125 | +16.8% | −1.7% |
| Big Sky, MT | 41.6% | 37.7% | −3.9 | $893 | $1,061 | +18.8% | $328 | $369 | +12.5% | +5.9% |
| Stowe, VT | 42.0% | 39.7% | −2.3 | $580 | $652 | +12.4% | $231 | $243 | +5.2% | +3.6% |
| Killington, VT | 39.2% | 34.5% | −4.7 | $640 | $708 | +10.6% | $249 | $260 | +4.4% | +4.1% |
| Breckenridge, CO | 48.1% | 40.7% | −7.4 | $648 | $774 | +19.4% | $302 | $315 | +4.3% | +1.5% |
| Mammoth Lakes, CA | 43.3% | 37.7% | −5.6 | $507 | $574 | +13.2% | $224 | $222 | −0.9% | +4.8% |
| Steamboat Springs, CO | 39.7% | 30.6% | −9.1 | $670 | $815 | +21.6% | $258 | $249 | −3.5% | −0.2% |
| South Lake Tahoe, CA | 31.4% | 25.2% | −6.2 | $462 | $526 | +13.9% | $157 | $150 | −4.5% | +7.4% |
| Winter Park, CO | 44.9% | 35.8% | −9.1 | $455 | $556 | +22.2% | $212 | $202 | −4.7% | +9.9% |
| Aspen, CO | 37.6% | 30.1% | −7.5 | $1,145 | $1,295 | +13.1% | $418 | $389 | −6.9% | +14.6% |
| Truckee, CA | 34.0% | 29.0% | −5.0 | $607 | $667 | +9.9% | $214 | $197 | −7.9% | +2.5% |
| Vail, CO | 35.1% | 27.8% | −7.3 | $930 | $1,102 | +18.5% | $306 | $277 | −9.5% | +0.5% |
| Park City, UT | 39.4% | 29.2% | −10.2 | $813 | $908 | +11.7% | $319 | $268 | −16.0% | +2.8% |
Read the columns against each other and the pattern is immediate: the size of the rate increase carries almost no information about the RevPAR result. Truckee raised 9.9% and lost 7.9% of RevPAR. Jackson raised 20.0% and gained 21.6%. The rate move was the constant; what varied was whether demand was there to absorb it.
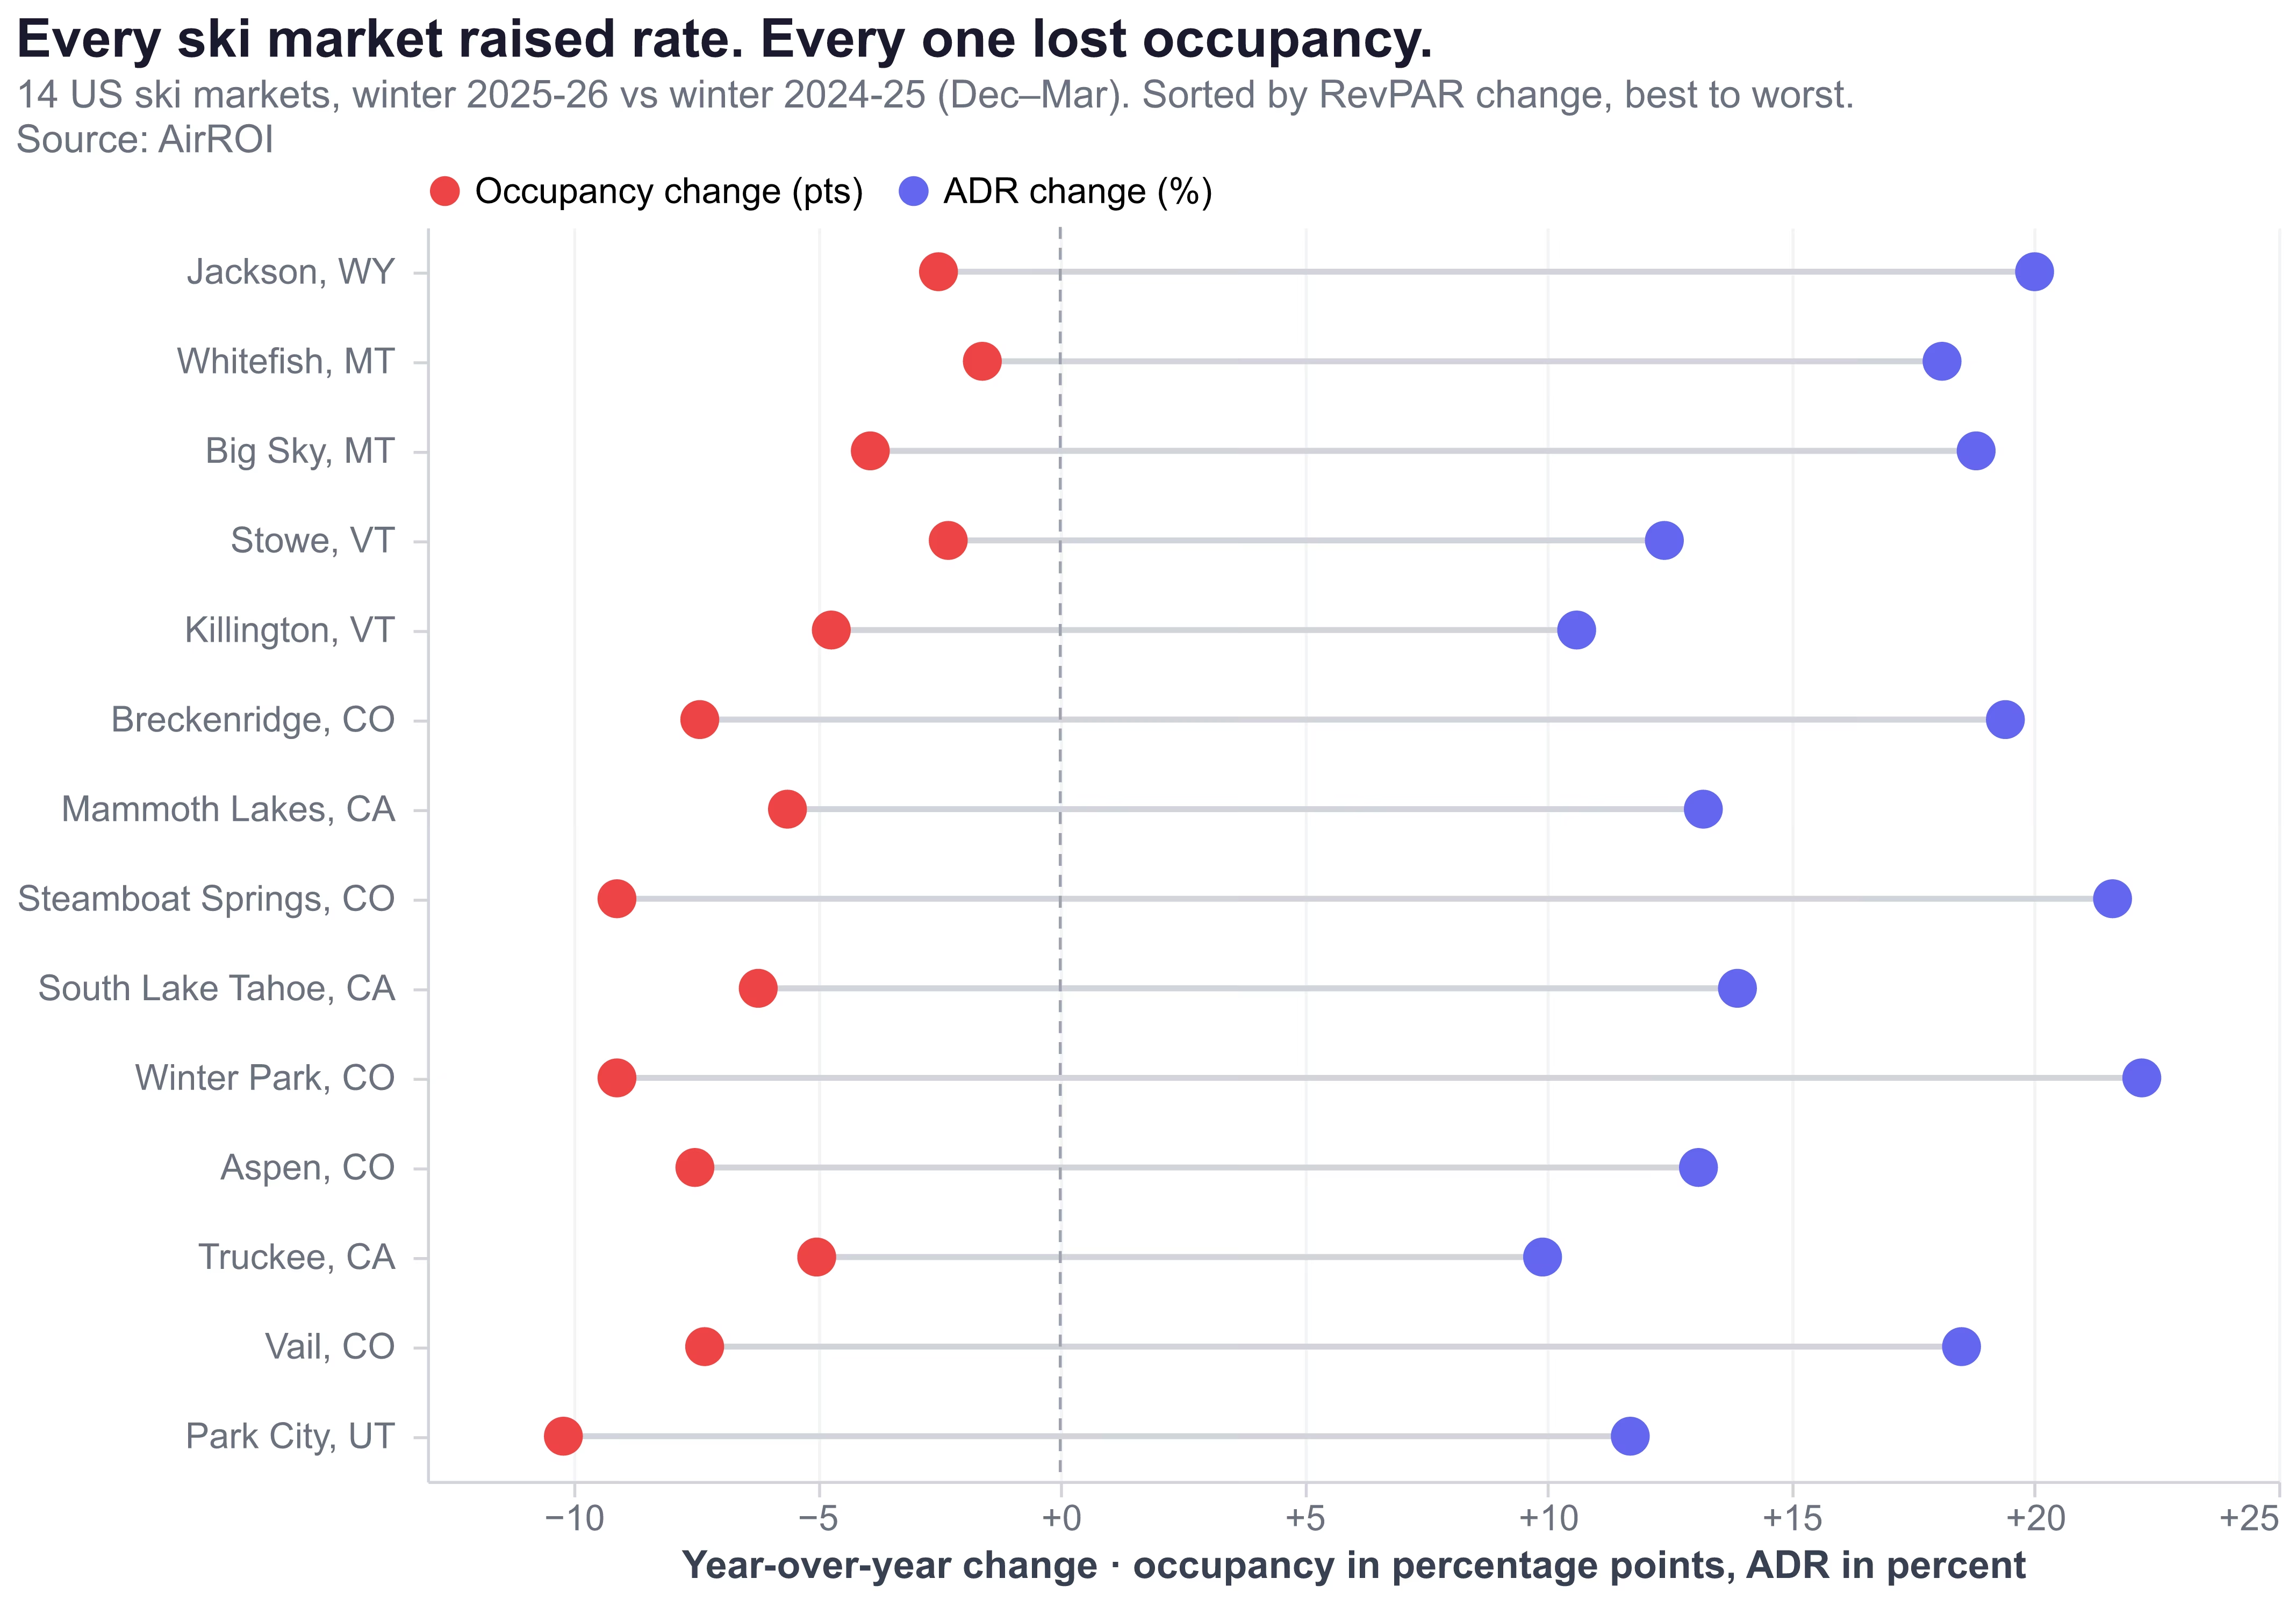
Park City is the sharpest illustration, and the reason it matters is that the usual explanation does not apply. It posted the panel's largest occupancy decline — 10.2 points, a 25.9% relative drop — on active-supply growth of just 2.8%. There were not meaningfully more listings competing for the guest. There were meaningfully fewer guests, and rate went up 11.7% into that gap. The result was a 16.0% RevPAR decline, the worst on the panel.
Ski vs non-ski STR market performance
Non-ski winter markets faced the same occupancy pressure and finished with better revenue, because they did not price as though demand were unchanged. Across a 10-market panel of warm-weather winter destinations measured on the identical method, median occupancy fell 4.1 points — real softness — while median ADR rose 13.6% and median RevPAR gained 5.0%.
| Ski (14 markets) | Non-ski (10 markets) | |
|---|---|---|
| Median occupancy change | −5.6 pts | −4.1 pts |
| Median ADR change | +18.1% | +13.6% |
| Median RevPAR change | −2.2% | +5.0% |
| Markets with RevPAR gain | 6 of 14 (43%) | 9 of 10 (90%) |
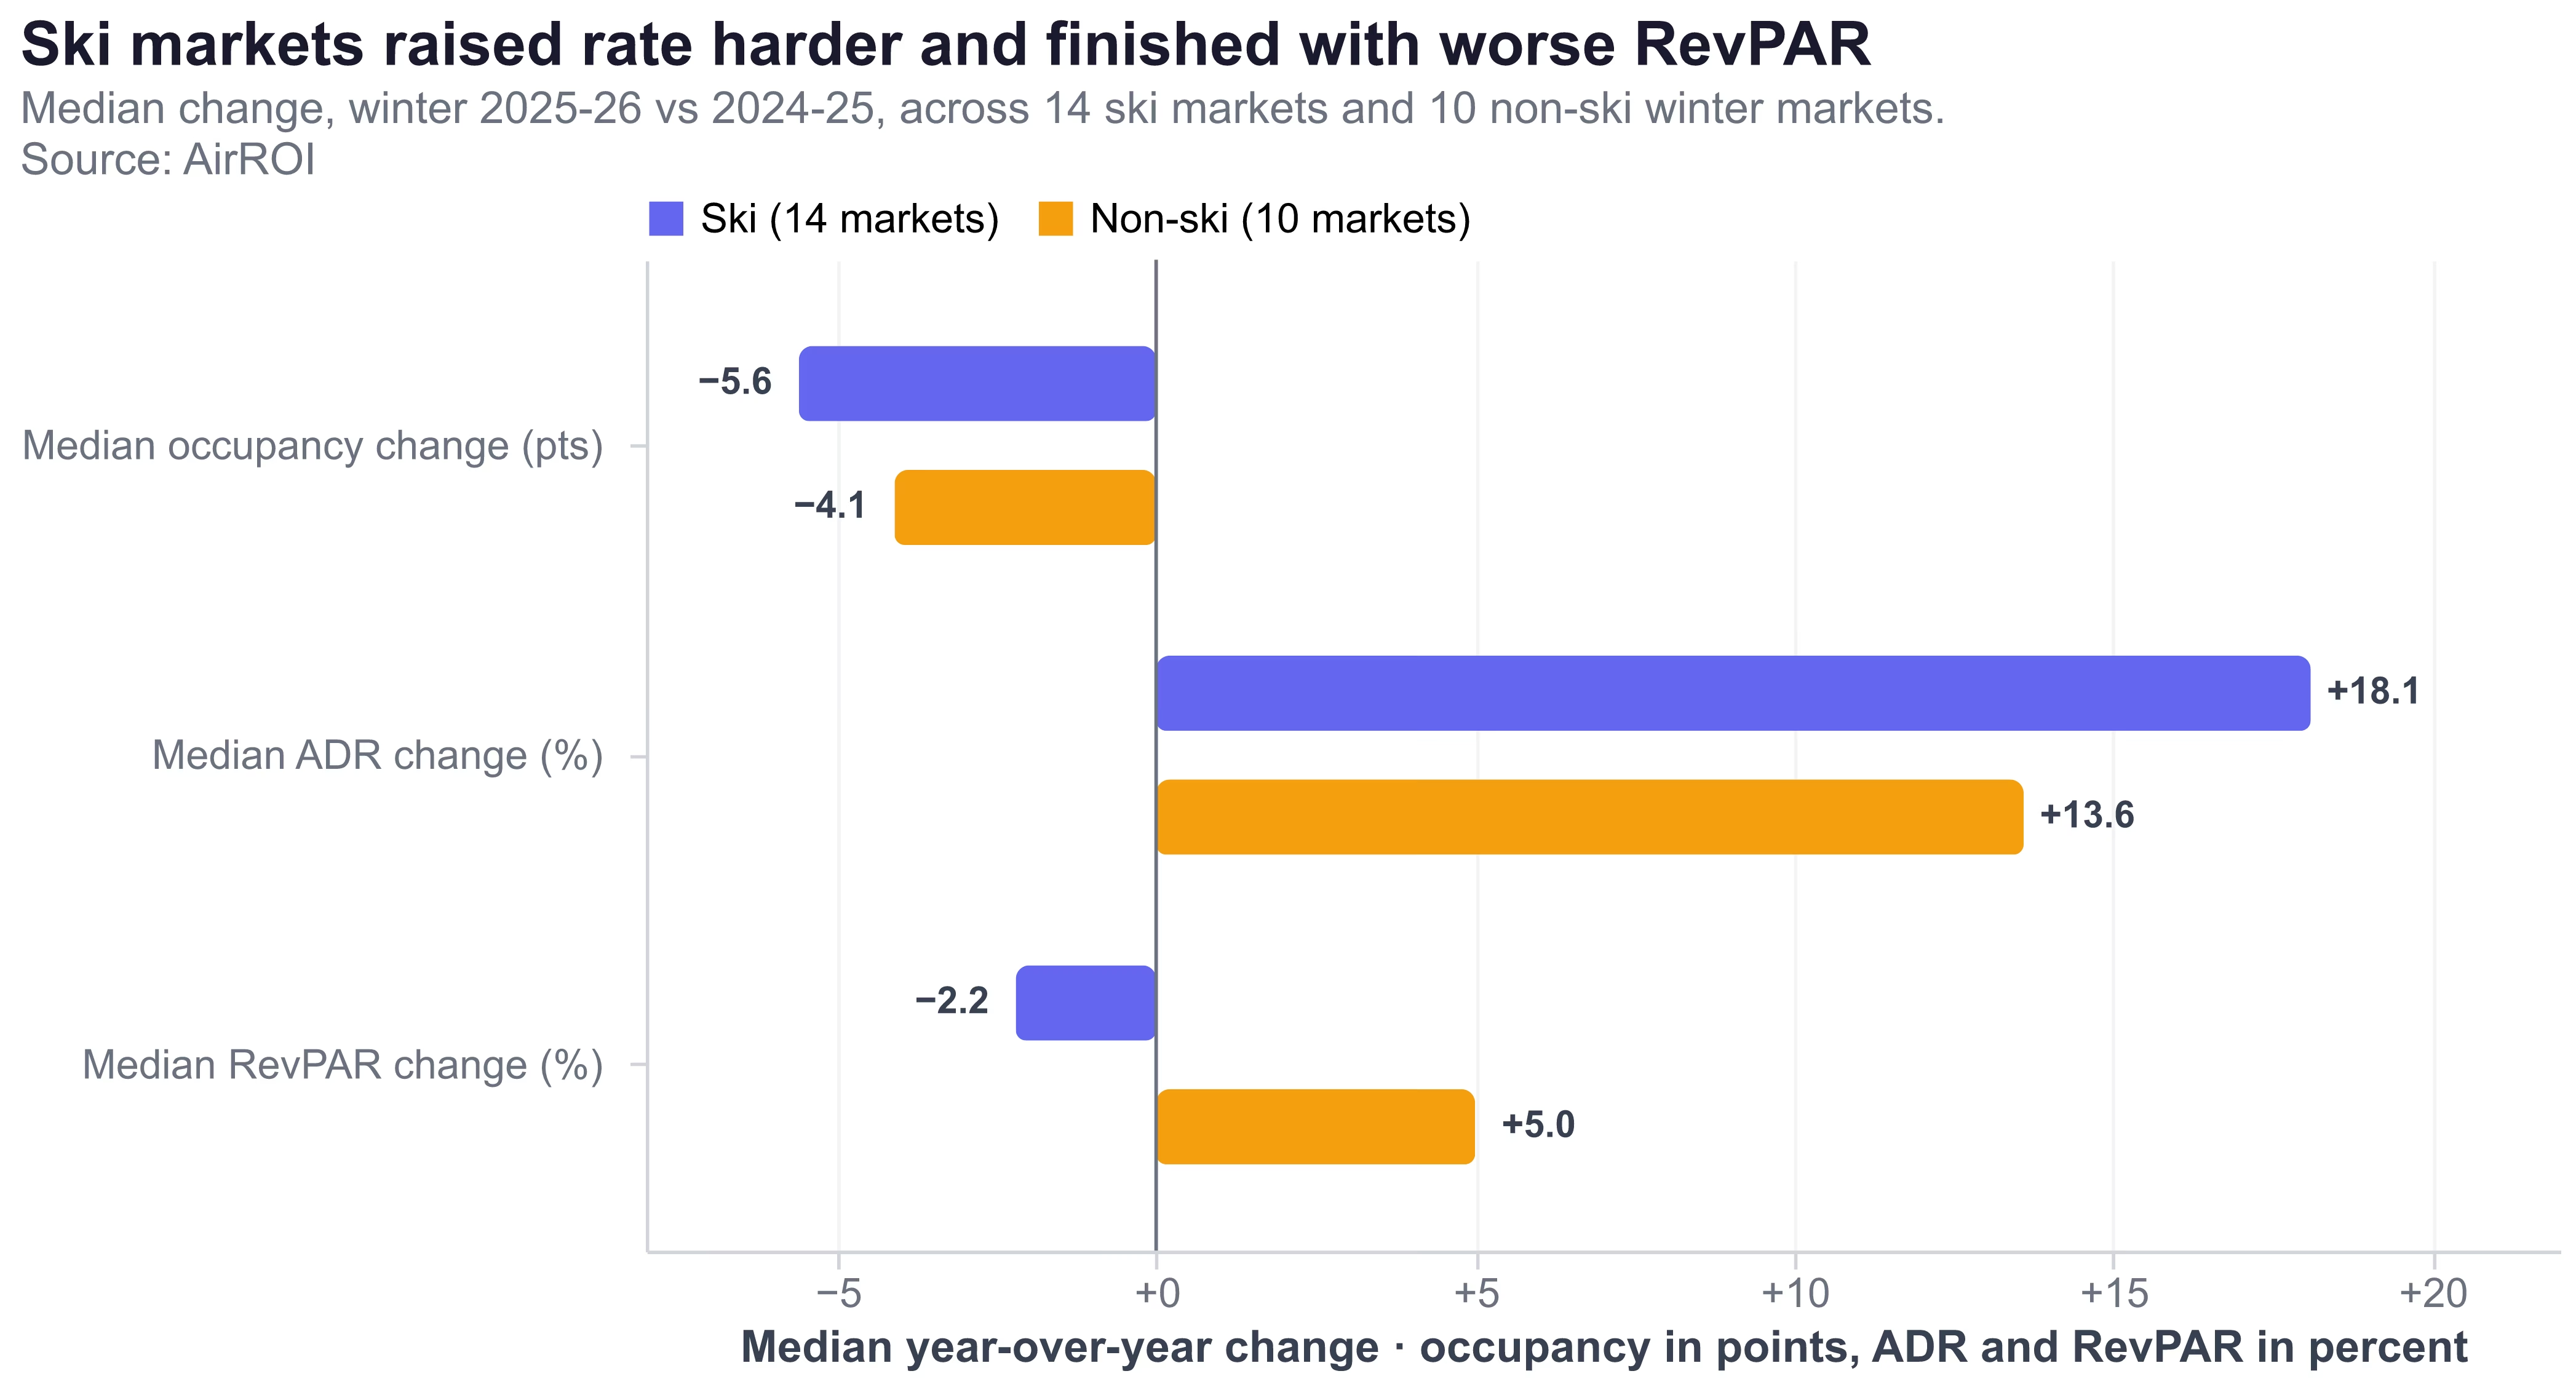
Nine of ten non-ski markets grew RevPAR against six of fourteen ski markets. Scottsdale raised 22.0% and gained 18.4% of RevPAR; Charleston raised 20.3% and gained 12.5%. The gap is not that non-ski markets escaped the occupancy decline. It is that a 13.6% median increase sat inside what demand would absorb and an 18.1% median increase did not.
This divergence is not only visible in AirROI's data. Key Data, reported by VailDaily on July 25, put 2026 ski-rental paid-occupancy pacing at 18% against 19% at the same point a year earlier, while ADR pacing rose to $454 from $441 — rate climbing as occupancy slipped. Two independent datasets, built from different listing populations, describe the same behavior.
Why Last Winter Is the Wrong Anchor for Winter 2026-27 Pricing
Last season's realized ADR was set into a collapse and did not hold, which makes it a distorted anchor in both directions depending on where you operate. In Jackson and Whitefish the realized rate understates what the market proved it would pay. In Park City and Vail it overstates it. Copying the number forward without asking which of those two situations you are in is the single most common error the data exposes.
Ski town short term rental occupancy did not fall because guests stopped valuing mountain trips. It fell because the product changed mid-season. Tom Foley, director of business intelligence at Inntopia, put the mechanism plainly in February: "People may be looking at poor conditions and saying, 'I've got a kind of subpar ski experience coming, I think I'm not going to spend as much money.'"
Hosts felt it as a calendar that stopped filling. One Colorado mountain-town host on r/airbnb_hosts wrote in April: "My place is in a Colorado Mountain town. We had a sad winter, so skier trips were down about 35% and I only have a single 3 night booking for all of April and May… everyone in our area is noticing the same BIG downturn in bookings." The thread's original poster had already tried the opposite lever — lowering prices significantly and layering on promotions — and reported that it changed nothing. Neither raising rate nor cutting it repairs a demand problem; both are the wrong instrument.
The balance beat matters here, because this was a regional divergence and not a uniform collapse. The Northeast gained last season, rising to 12.9 million visits from 12.5 million, while the Rocky Mountain region fell to 20.1 million from 26.5 million. Vermont's two markets on our panel, Stowe and Killington, both grew RevPAR. The national number hides two very different seasons.
Where in the Ski Season the Softness Actually Sits
The damage was not spread across the winter — it sat almost entirely in the last two weeks of March. Decomposing the panel by season period, on occupancy over bookable nights, shows peak weeks absorbing the largest rate increases of the season and gaining occupancy, while the late-season shoulder gave up 8.2 points on the smallest increase.
| Period | Occ W24-25 | Occ W25-26 | Δpp | Rate LY | Rate TY | ΔRate |
|---|---|---|---|---|---|---|
| Early Dec (Dec 1–19) | 15.8% | 15.5% | −0.3 | $492 | $570 | +15.9% |
| Holiday (Dec 20–Jan 3) | 41.4% | 43.3% | +1.9 | $731 | $861 | +17.7% |
| January (Jan 4–31) | 29.2% | 27.9% | −1.3 | $624 | $701 | +12.2% |
| Early Feb (Feb 1–13) | 32.9% | 31.0% | −1.9 | $640 | $794 | +24.2% |
| Presidents (Feb 14–23) | 42.7% | 43.0% | +0.3 | $685 | $848 | +23.8% |
| Early Mar (Feb 24–Mar 15) | 36.5% | 33.9% | −2.6 | $676 | $799 | +18.3% |
| Late Mar (Mar 16–31) | 35.9% | 27.7% | −8.2 | $635 | $736 | +15.8% |
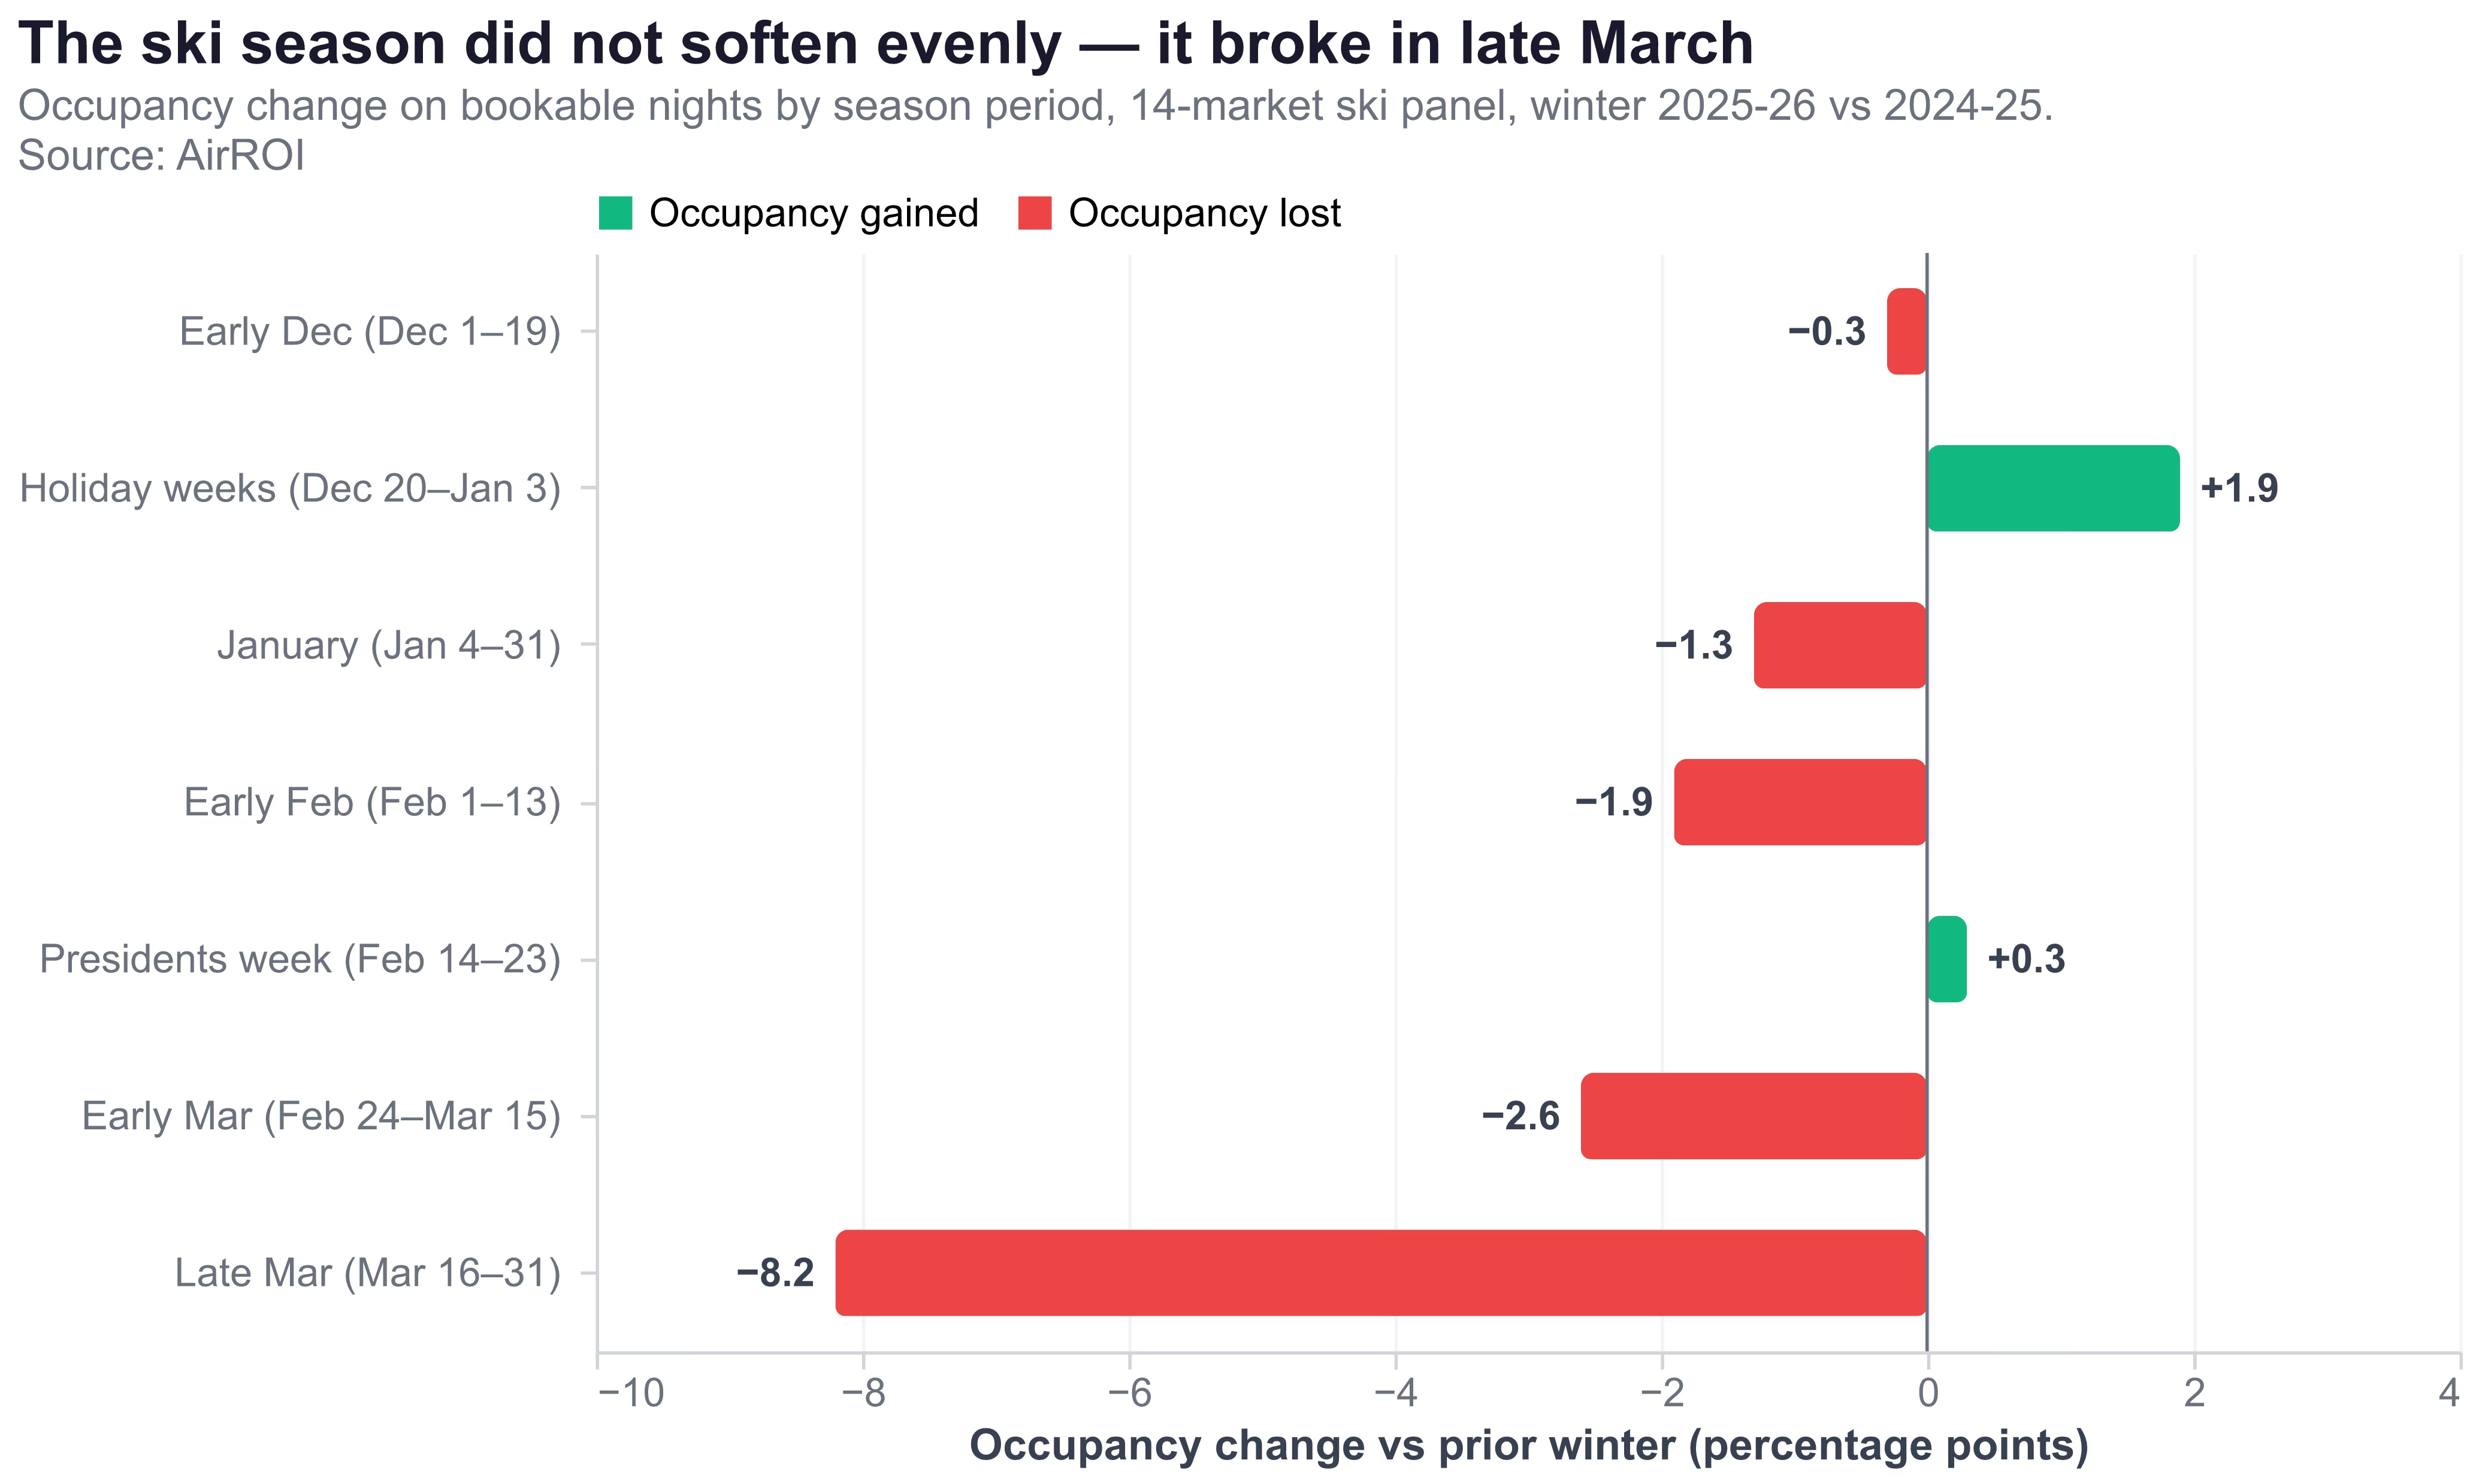
Christmas and New Year's took a 17.7% rate increase and gained 1.9 points of occupancy. Presidents' week took 23.8% — the second-largest increase in the season — and still gained 0.3 points. Those weeks have genuine, demonstrated pricing power, and they held it in the worst snow year in a generation. Early February absorbed the season's largest increase at 24.2% and gave back only 1.9 points.
Late March is where the season broke. It carried the smallest rate increase of any peak-adjacent window, 15.8%, and lost 8.2 points — more than four times the decline of any other period. This is also the most snow-condition-sensitive window on the calendar, the stretch where a thin base becomes visible from the parking lot and the trip stops being worth the drive.
The per-market March detail confirms it is structural rather than a panel artifact. March occupancy fell in all 14 markets, led by Winter Park at −15.2 points, Park City at −15.0, Breckenridge at −12.2, Steamboat at −11.8 and Aspen at −10.9. There is no market where a strong late March offset a weak one elsewhere.
The counterweight is equally specific, and it is the reason a blanket retreat on rate would be the wrong reading. February RevPAR rose in 13 of 14 markets, with Jackson up 48.2%, Whitefish up 47.0% and Big Sky up 34.6%. The mid-winter core of the season was not the problem.
How to price a ski rental for winter: differentiate the calendar
The actionable conclusion is that a uniform seasonal increase is the error, and the correction is not a smaller uniform increase. Christmas, New Year's, MLK week and Presidents' week earned the right to carry rate, and they earned it under the worst possible conditions. Late March needs a conservative number, shorter minimum stays, and a willingness to take a four-night booking rather than hold out for a Saturday-to-Saturday week that is not coming.
Which Ski Markets Have Pricing Power for Winter 2026-27
The 14 markets sort into three groups, and for anyone screening the best ski towns for airbnb investment, the split is geographic before it is anything else. RevPAR grew in Wyoming, Montana and Vermont, and fell across Colorado, Utah and Tahoe, with Breckenridge the single Colorado exception.
Group 1 — genuine pricing power. Jackson +21.6%, Whitefish +16.8%, Big Sky +12.5%, Stowe +5.2%, Killington +4.4%, Breckenridge +4.3%. Every one of these markets lost occupancy and still grew revenue, because the rate increase was smaller than what demand would carry. Whitefish is the cleanest case: a 1.6-point occupancy loss, the smallest on the panel, with supply actually contracting 1.7%.
Group 2 — hold rate, defend occupancy. Mammoth Lakes −0.9%, Steamboat Springs −3.5%, South Lake Tahoe −4.5%, Winter Park −4.7%. These are markets where the increase overshot by a modest margin. Winter Park is instructive — it took the panel's largest rate increase at 22.2% and gave back 9.1 points of occupancy to end 4.7% down.
Group 3 — priced into a demand pocket. Aspen −6.9%, Truckee −7.9%, Vail −9.5%, Park City −16.0%. Aspen is the one market where supply is a legitimate part of the explanation, having added 14.6% more active listings, the panel's largest increase. For anyone weighing the best ski towns for airbnb investment, the honest read is that Park City and Vail currently look overpriced relative to demand — not permanently impaired, but carrying rate levels their guest volume did not support last season.
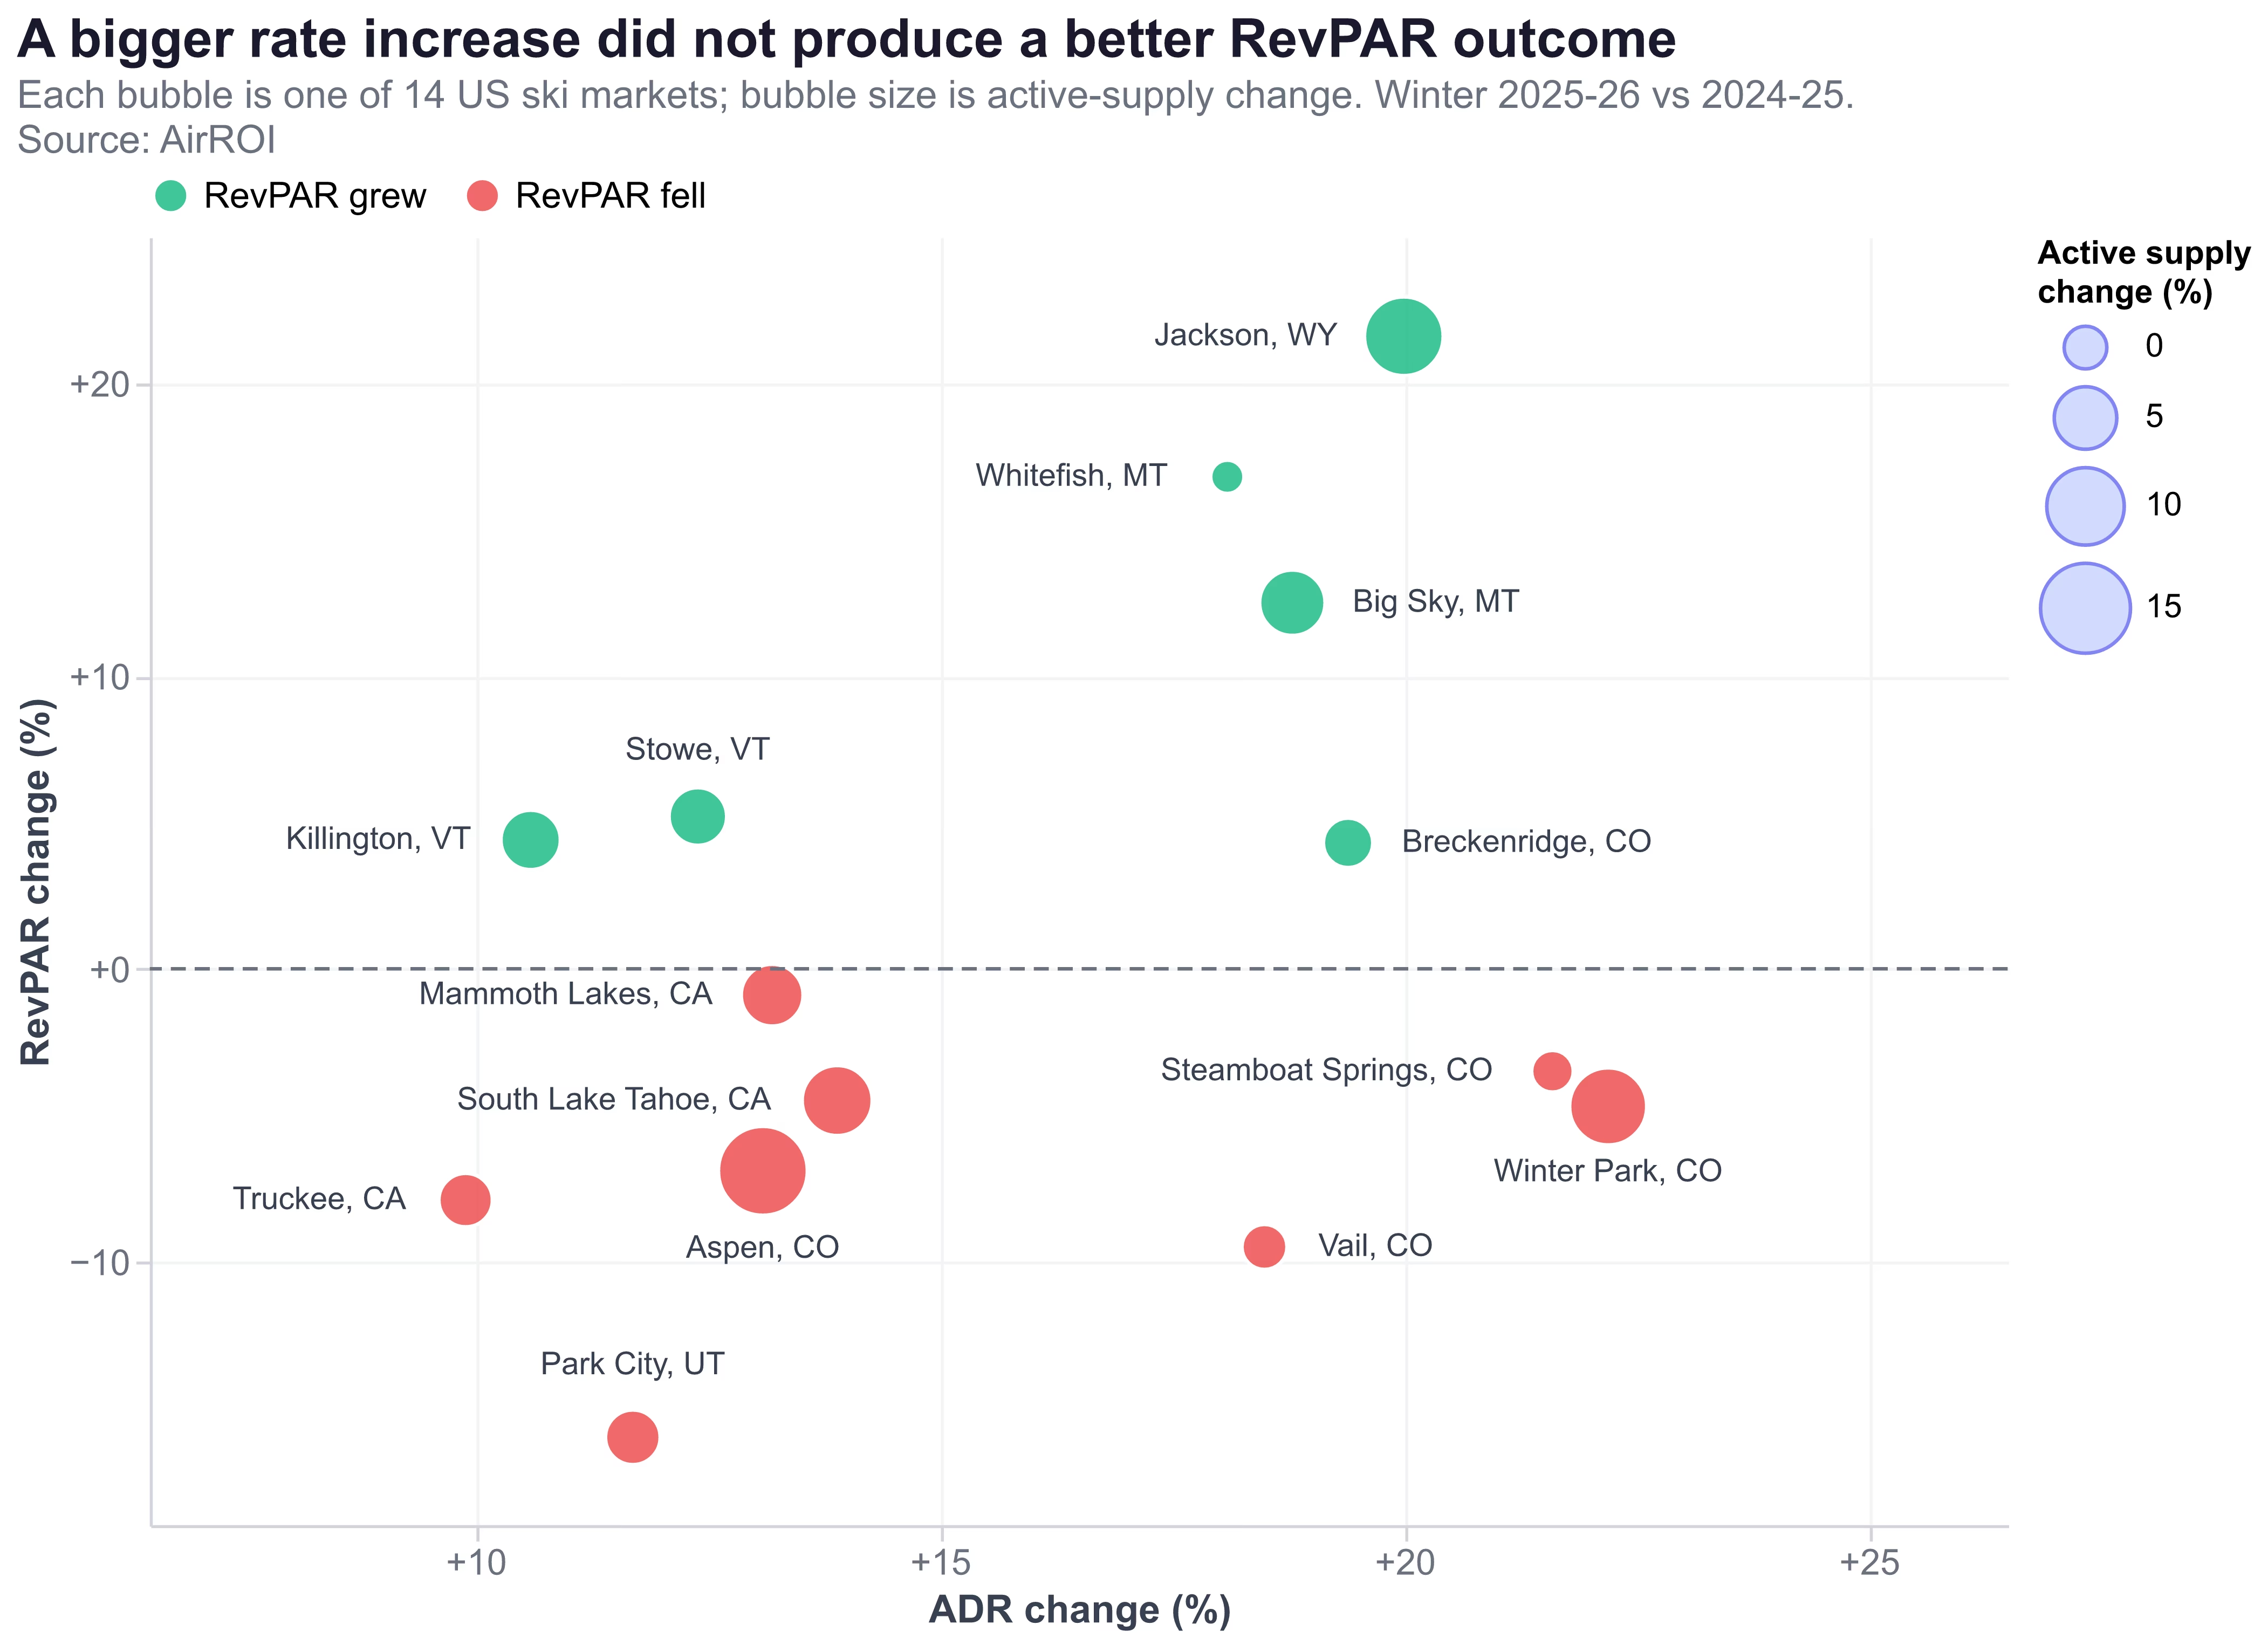
Plotted against each other, ADR change and RevPAR change form no usable relationship. The three largest rate increases on the panel — Winter Park 22.2%, Steamboat 21.6%, Jackson 20.0% — produced RevPAR of −4.7%, −3.5% and +21.6% respectively. The rate decision did not determine the outcome; the market did.
The pass data points at the same geography
"Pass performance to date has been driven by softer demand following the challenging conditions this season, evident in the fact that the weakness has been most pronounced in our more weather-impacted destination markets."
VailDaily subsequently reported that the declines run low double digits in Colorado, Utah and Tahoe against low single digits in the East and at Whistler. That is the AirROI RevPAR map, drawn from ski-pass unit sales rather than short-term rental performance. Because season passes now account for 49% of all US skier visits against 31% for daily and multi-day tickets, pass units function as a genuine leading indicator of who shows up.
You Are Pricing Tuesday Like Saturday
Saturday occupancy across the ski panel ran 37.5% against Tuesday's 24.4% — a 13.1-point gap — while the realized nightly rate on both nights was an identical $758. Demand varies 13 points across the week. Rate varies about 4%.
| Day | Occ W24-25 | Occ W25-26 | Δpp | Rate W24-25 | Rate W25-26 |
|---|---|---|---|---|---|
| Monday | 27.2% | 25.6% | −1.5 | $639 | $756 |
| Tuesday | 26.3% | 24.4% | −1.9 | $643 | $758 |
| Wednesday | 28.2% | 26.0% | −2.2 | $653 | $779 |
| Thursday | 32.8% | 31.1% | −1.7 | $664 | $787 |
| Friday | 38.6% | 36.8% | −1.8 | $659 | $770 |
| Saturday | 39.6% | 37.5% | −2.1 | $648 | $758 |
| Sunday | 31.5% | 30.8% | −0.6 | $640 | $758 |
The flatness is close to total. The highest realized rate in the week belongs to Thursday at $787, not Saturday. Wednesday, the second-weakest night by occupancy, is priced $21 above Saturday. Ski hosts are not differentiating midweek pricing at all, largely because the Saturday-to-Saturday ski week convention makes the week feel like a single unit even when the booking calendar shows it is not.
One precision note, because a related industry finding is easy to misread. Inntopia has documented a shift away from Saturday arrivals toward midweek arrivals, with Saturday falling to 15.2% of arrivals from 16.2%. That measurement is arrival day, ours is occupancy by night, and Inntopia's figures cover summer 2026 rather than the winter season. The two are complementary lenses on the same behavior, not competing claims — our night-level declines run fairly evenly across all seven days, between −0.6 and −2.2 points, which means the migration Inntopia describes surfaces in our data as trip-shortening rather than a weekday shift.
The traveler behavior underneath is visible and deliberate. A family on r/skiing bought a Winter Park "Flex Midweek Pack" rather than a weekend product. Skiers on r/icecoast describe planning Tuesday and Wednesday days over MLK weekend. When Jay Peak lodging rose 30% year over year, the top-voted replies in that thread were not "cancel the trip" — they were stay in the next town and drive in.
For pricing structure, the implication runs in two directions at once. Midweek nights need a discount deep enough to be visible in search, and weekend nights carry more rate than the current 4% spread reflects. It also changes the arithmetic on orphan nights: a single midweek gap between two bookings is worth filling at a real discount rather than blocking, because at 24.4% occupancy that night has no scarcity value to protect.
When Do Ski Season Bookings Peak — and Whose Rate Is Already Set
In the long-lead ski markets, the winter rate decision is effectively made in August. Average booking lead time for winter 2025-26 ranged from 104 days in Big Sky to 48 in Mammoth Lakes — a spread of more than 2x that splits the panel into two genuinely different decision calendars.
| Decide now (86–104 days) | Lead | Retain flexibility (48–66 days) | Lead |
|---|---|---|---|
| Big Sky, MT | 104 | Truckee, CA | 66 |
| Vail, CO | 97 | Stowe, VT | 62 |
| Aspen, CO | 91 | Killington, VT | 62 |
| Park City, UT | 90 | South Lake Tahoe, CA | 50 |
| Steamboat Springs, CO | 86 | Mammoth Lakes, CA | 48 |
Whitefish at 82 days, Breckenridge at 76, Winter Park at 72 and Jackson at 71 sit in the middle. Lead times also lengthened year over year in most of the panel — Big Sky from 81 days to 104, Vail from 83 to 97, Park City from 82 to 90 — which is consistent with guests locking peak weeks earlier while leaving shoulder weeks unbooked until conditions are known.
Guests understand the trade and resent it. The r/skiing family that booked Winter Park had lift tickets and six nights of lodging at $280 a night reserved and paid by August for a February trip; the top reply in that thread was blunt: "Planning in July for February trip does feel bit crazy though, basically paying them to hold your money for half the year." The booking curve is bifurcating into a deal-seeking July–August cohort and a late, price-insensitive holiday cohort, with a thin middle where the flexible traveler used to sit.
Here is the honest limit of what anyone can tell you about ski rental booking pace winter 2026 2027: no reliable on-the-books read exists yet. Inntopia's forward window currently stops at November 2026 arrivals, and its first meaningful winter picture lands in the September and October briefings. Any source telling you today that winter 2026-27 is pacing behind is extrapolating, not measuring. AirROI does not publish a year-over-year winter pace figure either, because our listings table begins in mid-2025 and the two seasons' pace curves do not overlap at comparable lead times — a limitation worth stating plainly rather than papering over with a number.
That absence is itself part of the decision. In Big Sky, Vail, Aspen and Park City, waiting for September data means waiting past the point where a third of the peak-week inventory is already committed.
El Niño Is a Tilt, Not a Forecast
Applied to this panel, the tilt runs in opposite directions across markets that just moved in the same direction. Central and southern Colorado lean mildly favorable. Northern Colorado, Wyoming and Montana — Jackson, Big Sky, Whitefish, the three strongest RevPAR performers last winter — lean unfavorable. Vermont's interior sits on the suppressed side too. A host who prices Jackson up because "El Niño means snow" has the sign backwards for that specific location.
The demand-side counterweight belongs here as well. Rob Katz, CEO of Vail Resorts, argued in June that the pass decline reflects hesitation rather than exit:
"We don't think this is about people saying that they're not going to ski next year. We think it's about people not willing to make that commitment today."
If he is right, demand is deferred rather than destroyed, and deferred demand arrives later in the booking curve — which is a lead-time argument, not a volume argument, and it favors holding inventory open over discounting early. Michael Reitzell, president and CEO of the National Ski Areas Association, framed the season's lesson at the industry level: "Few seasons demonstrate as clearly as this one how dependent our industry remains on regional weather patterns." Guests already price that dependence in; the test most hosts hear on a refund request is whether the lifts are turning.
The Asymmetry That Should Decide Your Rate
Uncertainty about snow does not argue for a directional bet in either direction. It argues from the shape of the two errors, which are not symmetric.
Price conservatively into a good snow year and the calendar fills early, the shoulder weeks convert, and the cost is the margin left on peak weeks that would have cleared higher. That is a real loss, and it is bounded — it shows up as forgone upside on a book of business that filled.
Price aggressively into a bad snow year and the failure compounds. Occupancy falls, the unsold nights are gone permanently, the discounting arrives too late in the curve to recover them, and the season ends where Park City ended: 11.7% more rate, 16.0% less RevPAR. The downside is not bounded by the size of the rate increase, because the occupancy loss runs well past it.
That asymmetry is the argument, and it does not require knowing what the weather will do. It requires noticing that the aggressive-rate experiment already ran, across 14 markets, under conditions that made the answer unusually legible: rate up in every market, occupancy down in every market, revenue down in most of them. The results are on the record. Winter 2026-27 pricing decisions made in the next several weeks are the first chance to price as though that record exists.
This analysis is provided for informational purposes and does not constitute investment advice. Short-term rental performance varies by property, regulation and season, and past market performance does not predict future results.
Frequently Asked Questions
In long-lead markets the decision is effectively made in August. AirROI data puts average booking lead time at 104 days in Big Sky, 97 in Vail, 91 in Aspen and 90 in Park City, so peak-week reservations are being made now and an August rate is the rate that clears December. Short-lead markets retain real flexibility: Mammoth Lakes averages 48 days and South Lake Tahoe 50, which leaves October and even November genuinely live.
Nobody knows yet, and any source claiming otherwise is overreaching. On-the-books winter 2026-27 pacing data does not publish until September and October 2026. What is known is that winter 2025-26 was a historically bad season — US skier visits fell to 52.6 million from 61.6 million — and that Vail Resorts' 2026-27 season pass units are down 10% through late May, the first decline in 14 years.
On RevPAR, Aspen led AirROI's 14-market panel last winter at $389, followed by Big Sky at $369 and Breckenridge at $315. But direction matters more than level for a rate decision: Jackson (+21.6%), Whitefish (+16.8%) and Big Sky (+12.5%) grew RevPAR year over year, while Park City fell 16.0% and Vail 9.5%.
Not uniformly across the season — that is the error the data most clearly identifies. Holiday weeks and Presidents week absorbed rate increases of 17.7% and 23.8% and still gained occupancy, so those weeks carry real pricing power. Late March lost 8.2 points of occupancy on a smaller 15.8% increase, so the late-season shoulder needs a conservative rate.
Not reliably, and not in the same direction everywhere. NOAA's Climate Prediction Center puts the chance El Niño persists through early spring 2027 at 97%, but its snowfall effect is regionally split — favoring the southern tier and high western elevations while tending to suppress snowfall in the northern Rockies, the Pacific Northwest, the Great Lakes and interior New England.