
Understanding Global Airbnb Seasonality: Data-Driven Insights for Peak Profits
The world of short-term rentals (STRs) is dynamic, exciting, and, as any seasoned host or investor knows, profoundly influenced by seasonality. Understanding these annual ebbs and flows isn't just academic; it's the bedrock of a successful Airbnb strategy, impacting everything from pricing and marketing to operational planning and revenue forecasting.
Seasonality in the short-term rental market refers to the predictable, cyclical variations in demand, occupancy, and pricing that occur throughout the year. These patterns are driven by a confluence of factors:
- Weather: The most obvious driver. Beach destinations boom in summer, ski resorts in winter.
- Holidays & School Breaks: Christmas, Easter, summer vacations, and national holidays create significant demand spikes.
- Major Events: Festivals, conferences, sporting events can temporarily transform a local market.
- Cultural Travel Habits: Different cultures have distinct travel periods.
Why is this crucial for your Airbnb business?
- Optimized Pricing: Charge premium rates during peak demand and attractive prices in the off-season to maintain occupancy.
- Targeted Marketing: Tailor your promotions to attract guests during shoulder or low seasons.
- Efficient Operations: Plan staffing, cleaning schedules, and maintenance around demand fluctuations.
- Revenue Forecasting: Predict income more accurately and manage cash flow effectively.
- Investment Decisions: Identify markets with year-round appeal versus those with extreme seasonal peaks and troughs.
Our Methodology: How We Measured Seasonality
To quantify seasonality, we analyzed anonymized, aggregated data from thousands of Airbnb listings across numerous countries over a 12-month period. We focused on three key metrics, looking at their standard deviation – a statistical measure of how much values fluctuate around their average. A higher standard deviation indicates greater volatility, and thus, higher seasonality.
- Occupancy Standard Deviation: How much do occupancy rates vary month-to-month?
- Normalized Revenue Standard Deviation: How much does the potential revenue (adjusted for market size and price changes) fluctuate? This helps compare seasonality across markets of different sizes.
- Normalized Booked Rate Average Standard Deviation: How much do the average daily rates (ADRs) for booked nights fluctuate?
All countries in our dataset had num_months = 12 and a varying avg_monthly_listings, ensuring a consistent observation period.
Global Snapshot: The Most & Least Seasonal Countries for Airbnb
Let's look at which countries experience the most dramatic seasonal swings and which offer more consistent year-round demand. The following bar chart displays countries with the highest and lowest Airbnb seasonality based on normalized revenue standard deviation, ranking them by the standard deviation of their normalized monthly revenue. This indicates overall Airbnb revenue seasonality, where higher values denote more pronounced seasonal shifts in revenue.
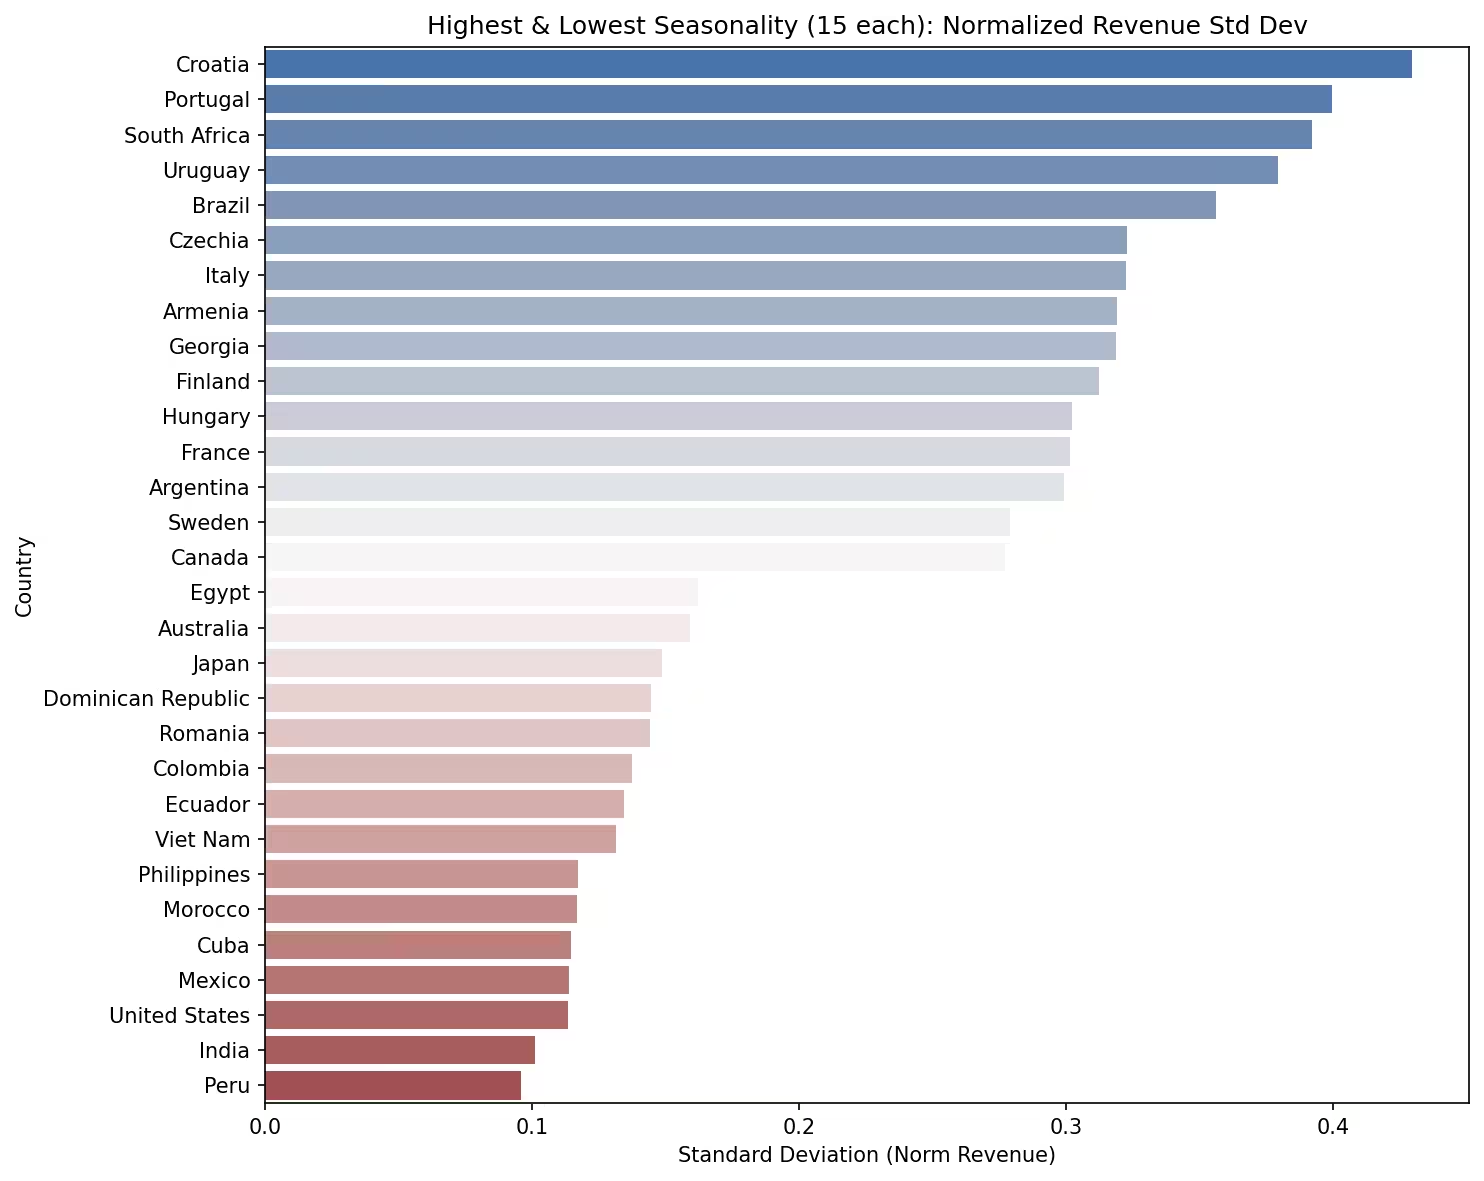
Key Takeaways from Normalized Revenue Seasonality:
- High Seasonality Hotspots: Countries like Croatia (0.429), Portugal (0.399), and South Africa (0.392) exhibit significant revenue seasonality. This is often driven by strong summer tourism (Croatia, Portugal) or distinct holiday seasons (South Africa). Hosts in these regions must master peak season pricing and find creative ways to attract off-season guests.
- Moderate Seasonality: Many European nations like Czechia (0.322), Italy (0.322), and North American markets like Brazil (0.356) and Canada (0.277) show moderate seasonality. While distinct peak periods exist, demand is often spread more evenly, supported by city tourism, business travel, or varied attractions.
- Low Seasonality Havens: Countries like Peru (0.095), India (0.101), United States (0.113), and Mexico (0.113) demonstrate remarkably low revenue seasonality. This can be due to diverse climates within the country, consistent business travel, year-round attractions, or a large domestic travel market that smooths out international tourism peaks. The United States, despite its size and varied climates, shows relatively low overall seasonality due to its massive and diverse internal market, though specific cities will vary wildly (e.g., a ski town vs. a business hub).
We see similar patterns when looking at Occupancy Standard Deviation and Normalized Booked Rate Average Standard Deviation. For instance, Croatia also tops the chart for Occupancy Std Dev (0.162), highlighting that its properties see significant swings in how full they are throughout the year. Portugal leads in Normalized Booked Rate Avg Std Dev (0.171), meaning its prices fluctuate the most, as illustrated in the subsequent chart which ranks countries by the standard deviation of their normalized average booked rates, showcasing seasonal price volatility in the Airbnb market.
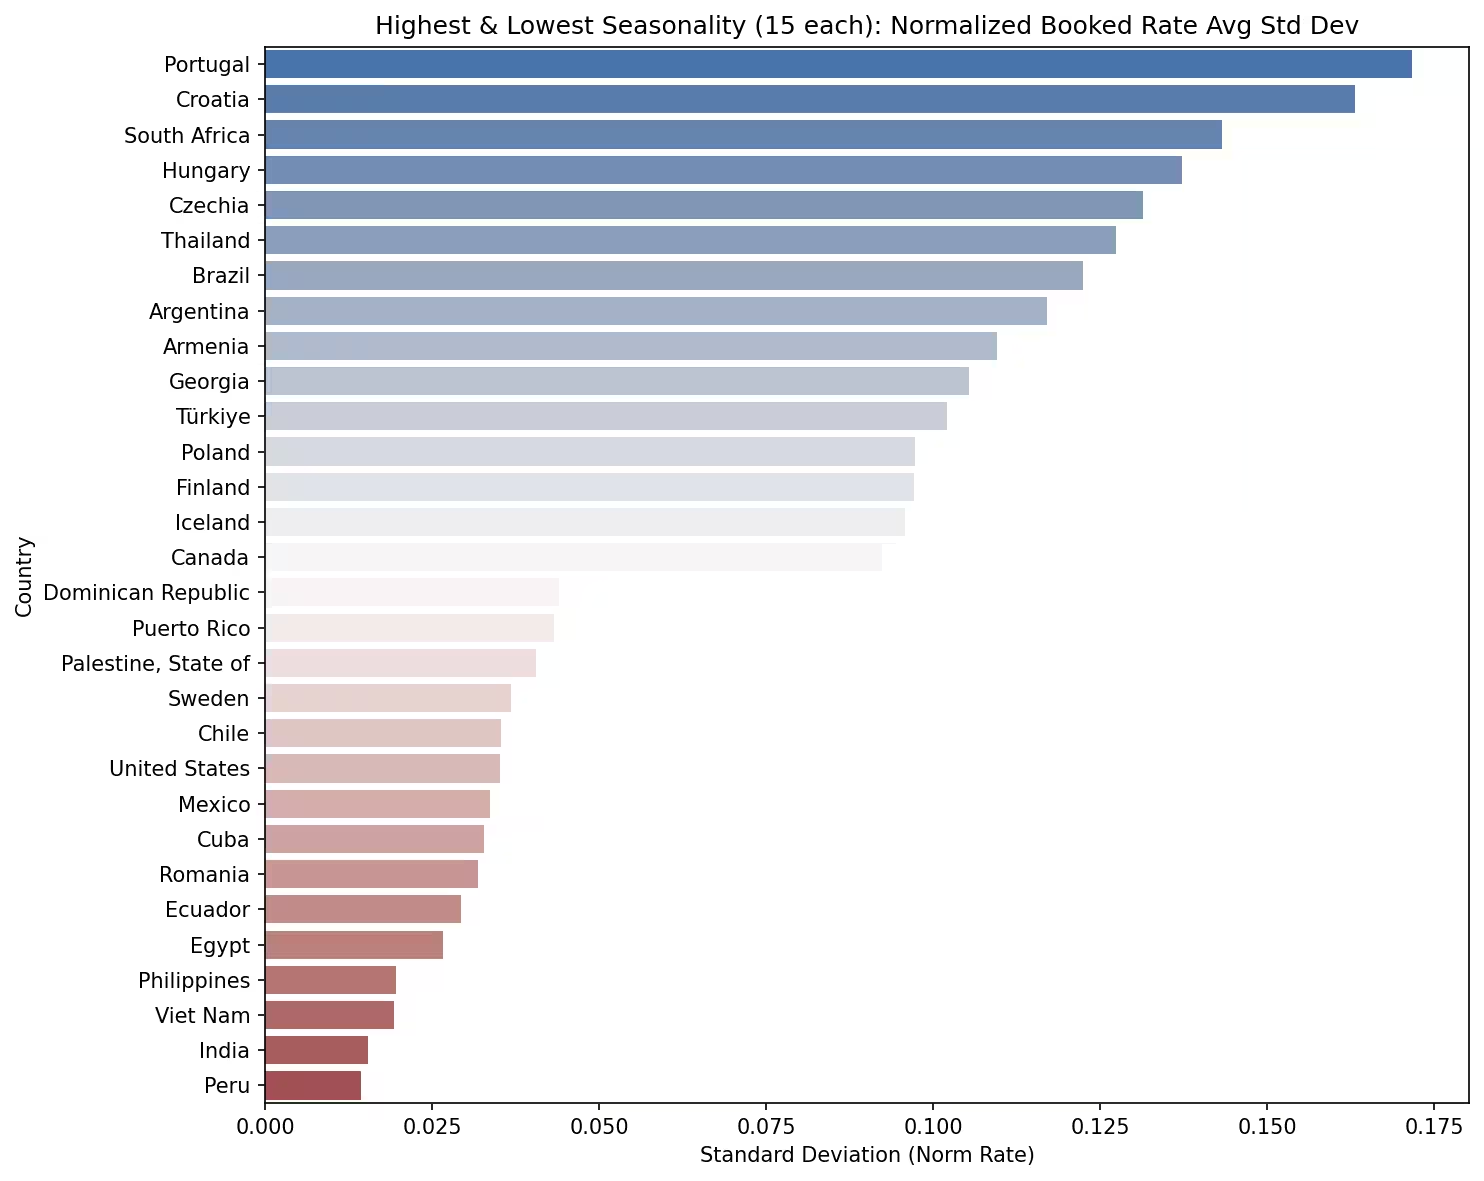
Interestingly, some countries might have high revenue seasonality but more stable occupancy, suggesting they rely heavily on price hikes during peak times. Others might keep prices relatively stable but see huge swings in how many guests they attract. Understanding these nuances is key.
A Tale of Two Hemispheres: Opposing Rhythms
One of the most visually striking demonstrations of seasonality is the contrast between the Northern and Southern Hemispheres, where peak seasons are inverted. The line graph below illustrates these opposing seasonal revenue trends for Airbnb markets, showing average normalized monthly revenue for selected markets in the Northern (e.g., USA, Spain) and Southern (e.g., Australia, Brazil) Hemispheres, clearly showcasing the inverse relationship of their peak travel seasons.
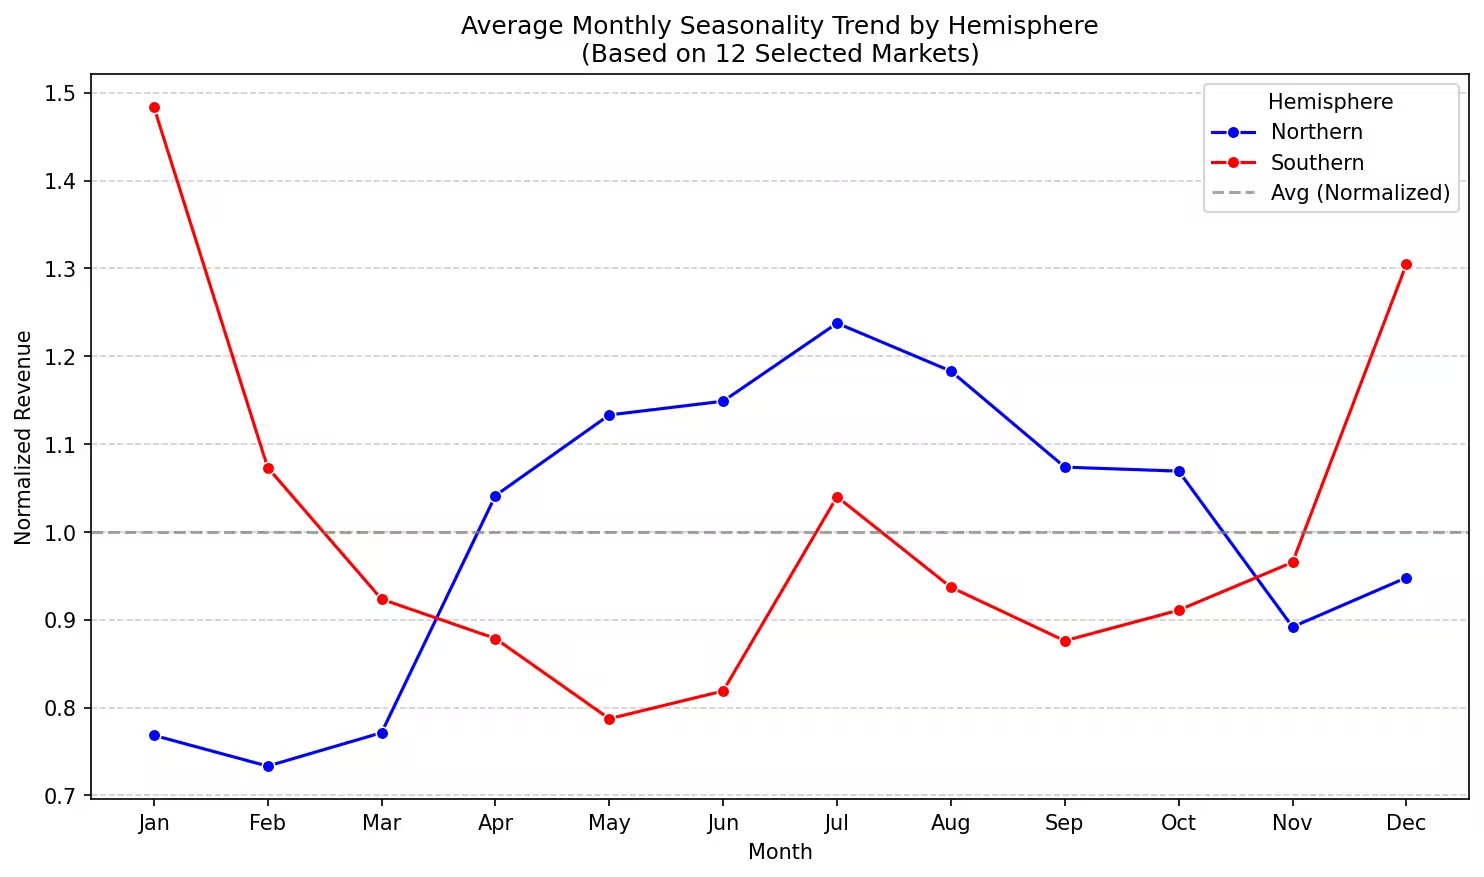
This chart clearly illustrates:
- Northern Hemisphere (Blue Line): Peaks typically in the summer months (June-August) and dips in the winter.
- Southern Hemisphere (Red Line): Experiences its peak during its summer (December-February) and a trough during its winter.
This has significant implications for global travel patterns and for investors looking to diversify portfolios across hemispheres to balance out seasonal income streams.
Deep Dive: Monthly Seasonality Trends in Top Markets
Let's zoom in on how normalized revenue fluctuates month-by-month in some of the world's largest Airbnb markets. The grid of 12 line charts below displays the monthly normalized revenue trend for a major Airbnb market, categorized by Northern and Southern Hemispheres. These charts cover 12 major markets (e.g., USA, UK, France, Australia, Brazil, Mexico), highlighting distinct peak, shoulder, and off-peak periods, with the dashed line in each chart representing the annual average (1.0) for that market.
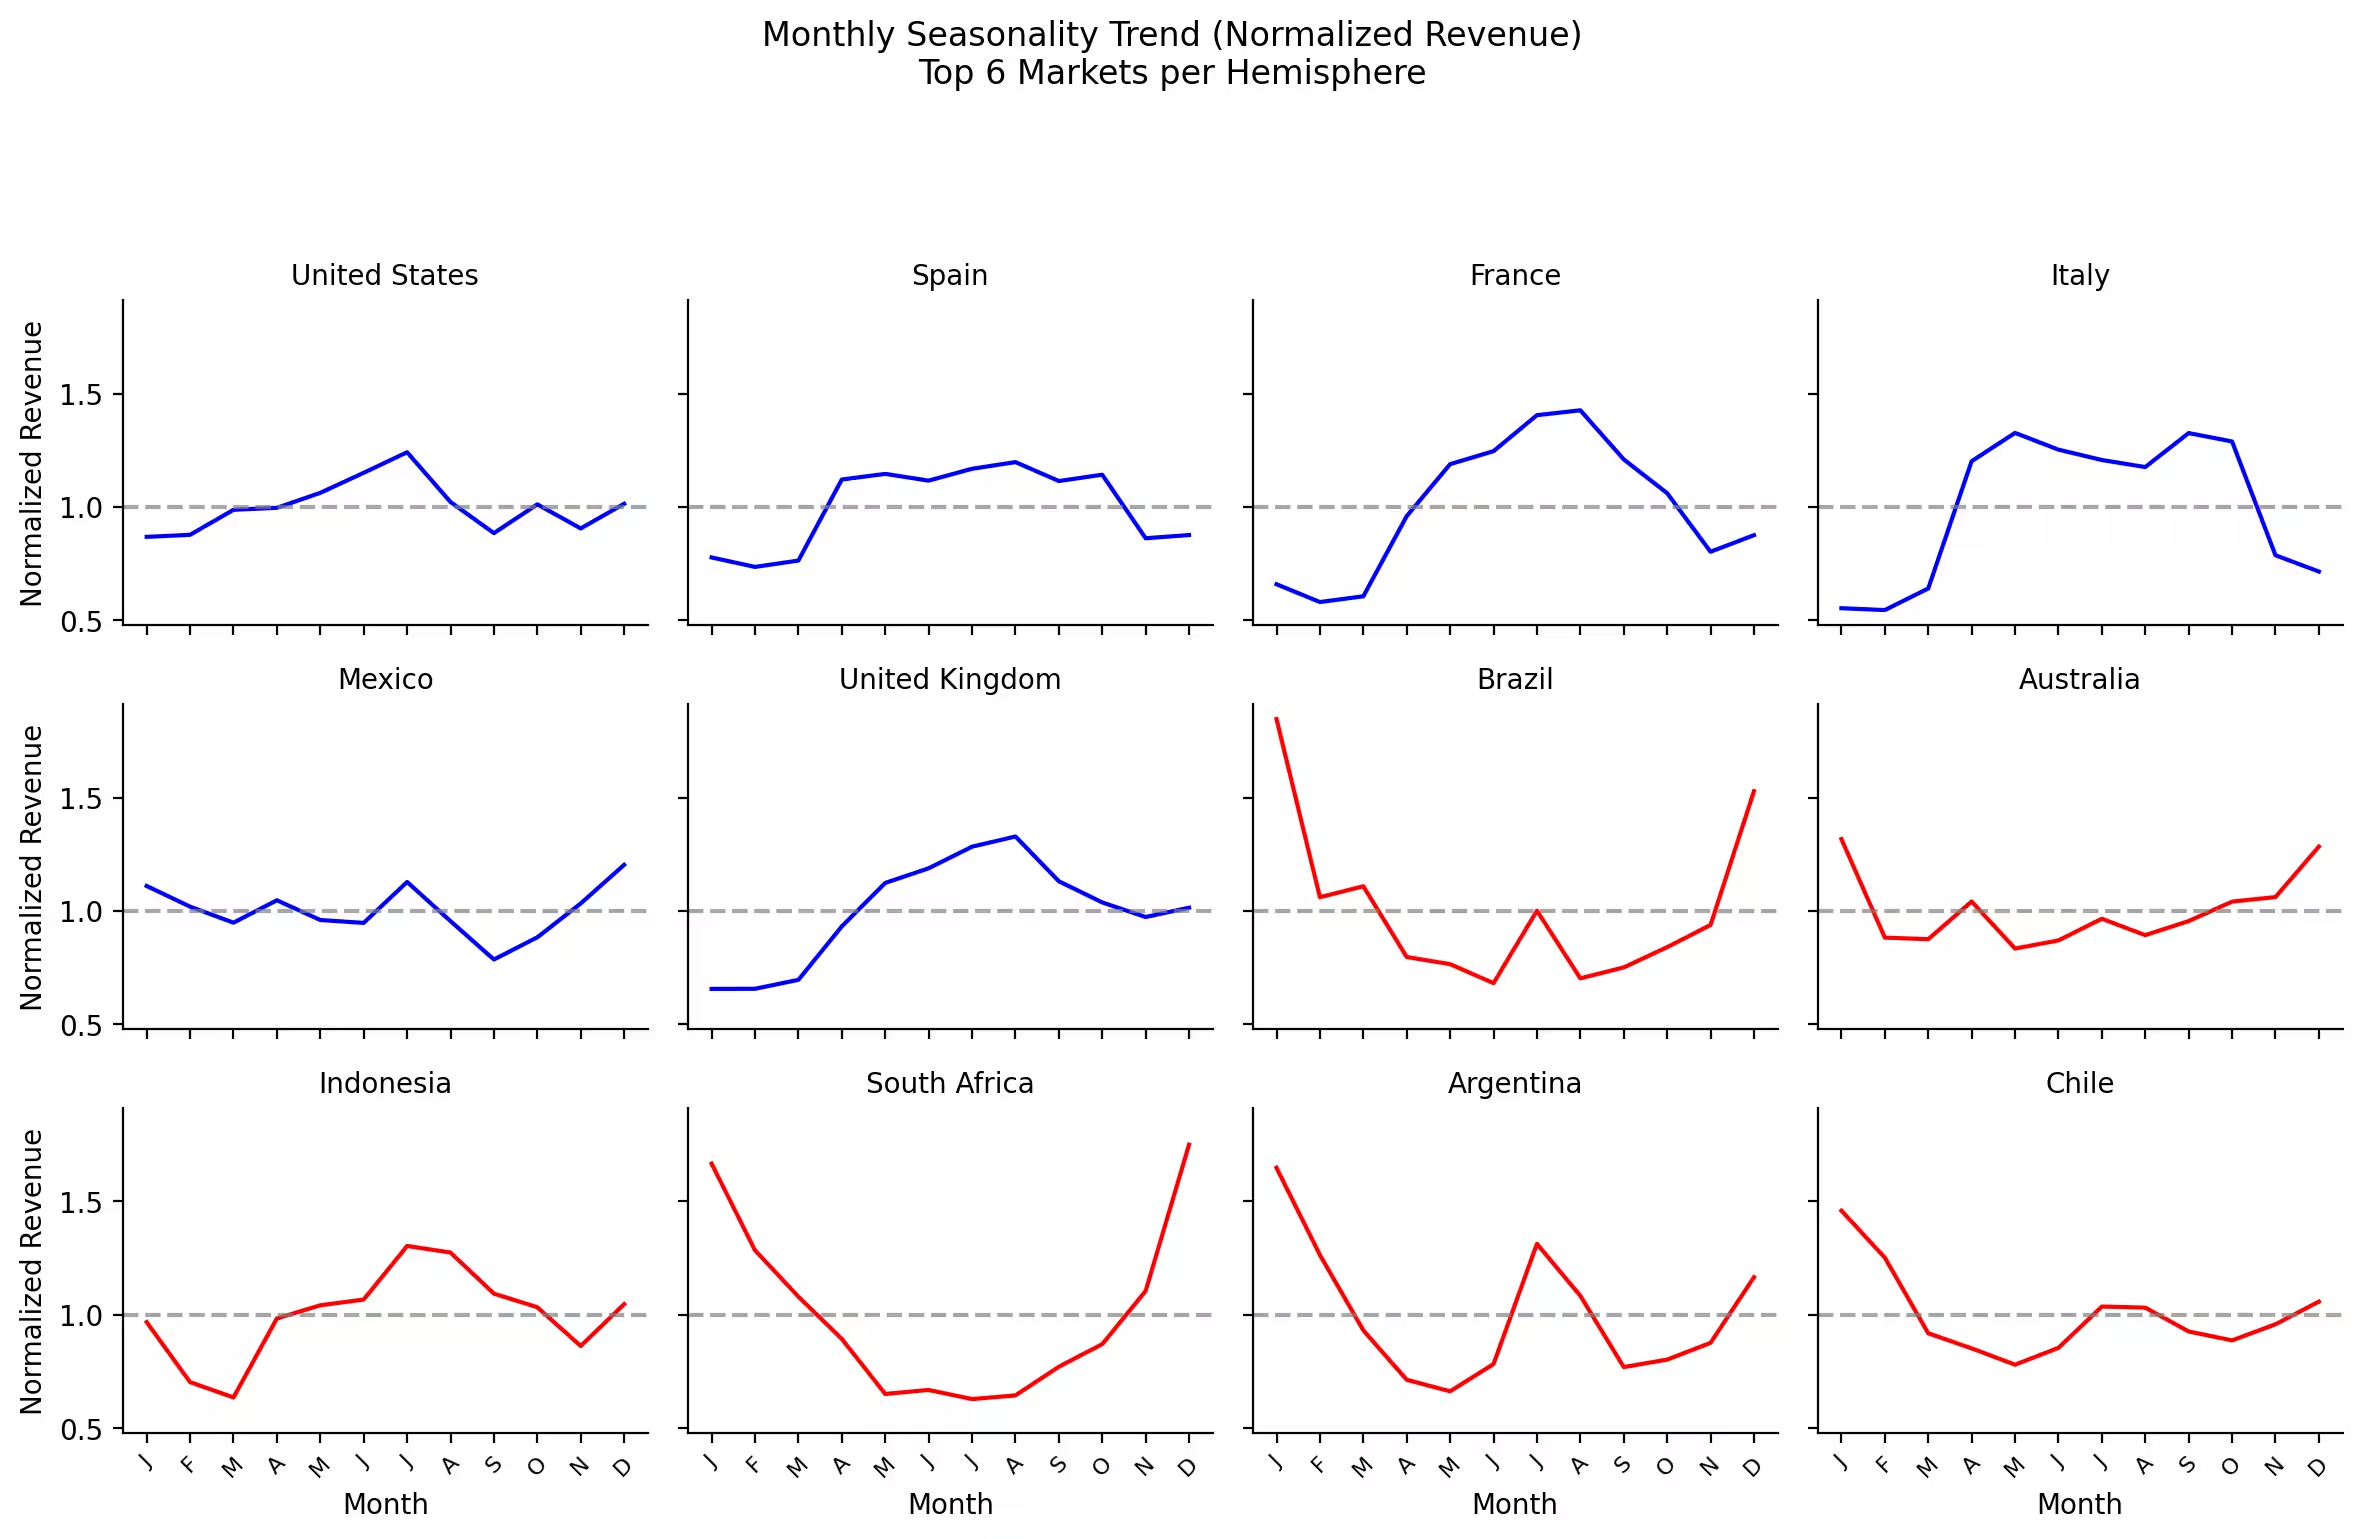
Observations from Top Markets:
- United States & European Majors (Spain, France, Italy): Clearly show a strong summer peak (June-August), with revenue often 15-25%+ above average. A secondary, smaller peak can sometimes be seen around Easter or Christmas/New Year, depending on the specific market.
- United Kingdom: Similar summer peak, but often less pronounced than Mediterranean destinations, with a steadier demand profile likely supported by city tourism (e.g., London).
- Mexico: Exhibits a more complex pattern with peaks often around December-January (winter sun seekers from the North) and another around Easter/Spring Break, and a smaller summer bump. Overall, it's one of the less seasonal large markets.
- Brazil & Argentina: Strong Southern Hemisphere summer peaks (December-February), often dramatically higher than the rest of the year, especially in coastal and tourist-heavy areas. Carnival can also create a significant spike in Brazil.
- Australia & South Africa: Classic Southern Hemisphere patterns with December-February highs. South Africa, in particular, shows a very sharp peak.
- Indonesia: While in the Southern Hemisphere, its tropical location and proximity to major Northern Hemisphere markets (like Australia for their winter escapes) gives it a more complex pattern, often with peaks around July-August and another around December-January.
- Chile: Shows a distinct summer peak (Dec-Feb), but also interesting shoulder season activity, potentially driven by diverse offerings from beaches to mountains.
These individual market charts underscore that even within the "low seasonality" United States, specific cities or regions (e.g., Miami vs. Aspen) will have drastically different seasonal curves. This is where localized data, like that provided by AirROI, becomes invaluable.
Leveraging Seasonality Insights: Actionable Tips for Hosts & Investors
Understanding these global and local seasonality trends isn't just interesting – it's actionable. Here's how you can use this knowledge:
-
Dynamic Pricing Strategy:
- Peak Season: Maximize Average Daily Rates (ADRs). Implement stricter cancellation policies and longer minimum stays.
- Shoulder Seasons: Offer slight discounts or value-added services (e.g., late checkout) to attract bookings.
- Off-Season: Consider significant discounts, longer-term stay options (e.g., monthly rentals for snowbirds or digital nomads), or promotions targeting specific niches.
-
Targeted Marketing:
- Identify your target audience for each season. Are they families in summer? Couples seeking a cozy winter getaway?
- Promote off-season attractions or events in your area.
- Offer early bird discounts for peak season or last-minute deals for low season.
-
Operational Planning:
- Schedule deep cleaning and maintenance during the slowest periods.
- Adjust staffing for cleaning and guest services based on anticipated occupancy.
- Stock up on seasonal amenities (e.g., extra blankets in winter, beach towels in summer).
-
Investment & Portfolio Management:
- When evaluating a new market, understand its seasonality profile. Are you prepared for significant income fluctuations, or do you prefer steadier returns?
- Consider diversifying your STR portfolio across different markets or even hemispheres to balance seasonal income.
The AirROI Advantage: Your Partner in Navigating Seasonality
- Hyper-Local Insights: Go beyond country-level trends to understand your city, neighborhood, and even comparable properties.
- Real-Time Data: Track occupancy, ADR, and revenue pacing to adjust your strategy on the fly.
- Competitive Analysis: See how your competitors are pricing and performing throughout the year.
- Smart Pricing Tools: Leverage data-driven recommendations to optimize your rates for every season.
Conclusion: Embrace the Rhythm of the Market
Seasonality is an inherent feature of the travel and short-term rental industry. By understanding its drivers and patterns – from global trends to the nuances of your local market – you can transform these fluctuations from a challenge into a strategic advantage. The data clearly shows that while some markets offer year-round consistency, others present opportunities for highly profitable peak seasons, provided hosts are prepared.