
Playcation Airbnb Markets 2026: AirROI Data on Which Hobby Destinations Actually Pay
Moab's 1,014 listings generate $46,171 in average annual revenue. Myrtle Beach's 7,561 listings generate $23,554. That single comparison captures what Airbnb's new playcation narrative gets right -- and what it leaves out. On May 8, 2026, Airbnb released its summer travel trends report coining "playcation" for the surge in short-haul, hobby-centered trips to surfing towns, climbing hubs, and lakefront retreats. A third of summer travelers are choosing to stay closer to home, and the platform reports that listings near golf courses, lakefronts, and surf spots are seeing some of the highest booking growth this season. But the report mentions destinations without mentioning revenue. AirROI ran the numbers across six hobby-driven playcation airbnb 2026 markets and four traditional beach markets. The results challenge the assumption that beach equals better.
What Airbnb's Playcation Report Gets Right -- and What It Leaves Out
Airbnb's May 2026 report identifies three forces shaping summer travel: playcations, nostalgia, and the pull of what is close to home. The company highlights specific destinations for each hobby -- Holden Beach and Nags Head for surfers, Ann Arbor for golfers, Saugatuck and Chelan for boaters, Cheyenne and Victor for golfers seeking mountain backdrops. According to Airbnb, "listings near golf courses, lakefronts, and surf spots have seen some of the highest booking growth" this summer.
The behavioral data backing the trend is substantial. An estimated 86% of travelers express interest in rural getaways, 64% of US Airbnb guests traveled less than 300 miles in 2025, and rural destinations saw 23% year-over-year supply growth while urban centers experienced a 4% decline in listings. The domestic, short-haul, activity-first pattern is real.
What the report omits is everything an investor needs: ADR, RevPAR, occupancy rates, seasonality curves, and supply density. Airbnb's playcation picks are curated for press appeal, not revenue validation. AirROI fills that gap by testing six hobby-driven markets against four traditional beach markets on the metrics that determine whether a listing actually cash-flows.
Six Hobby Markets vs Four Beach Markets: The Revenue Breakdown
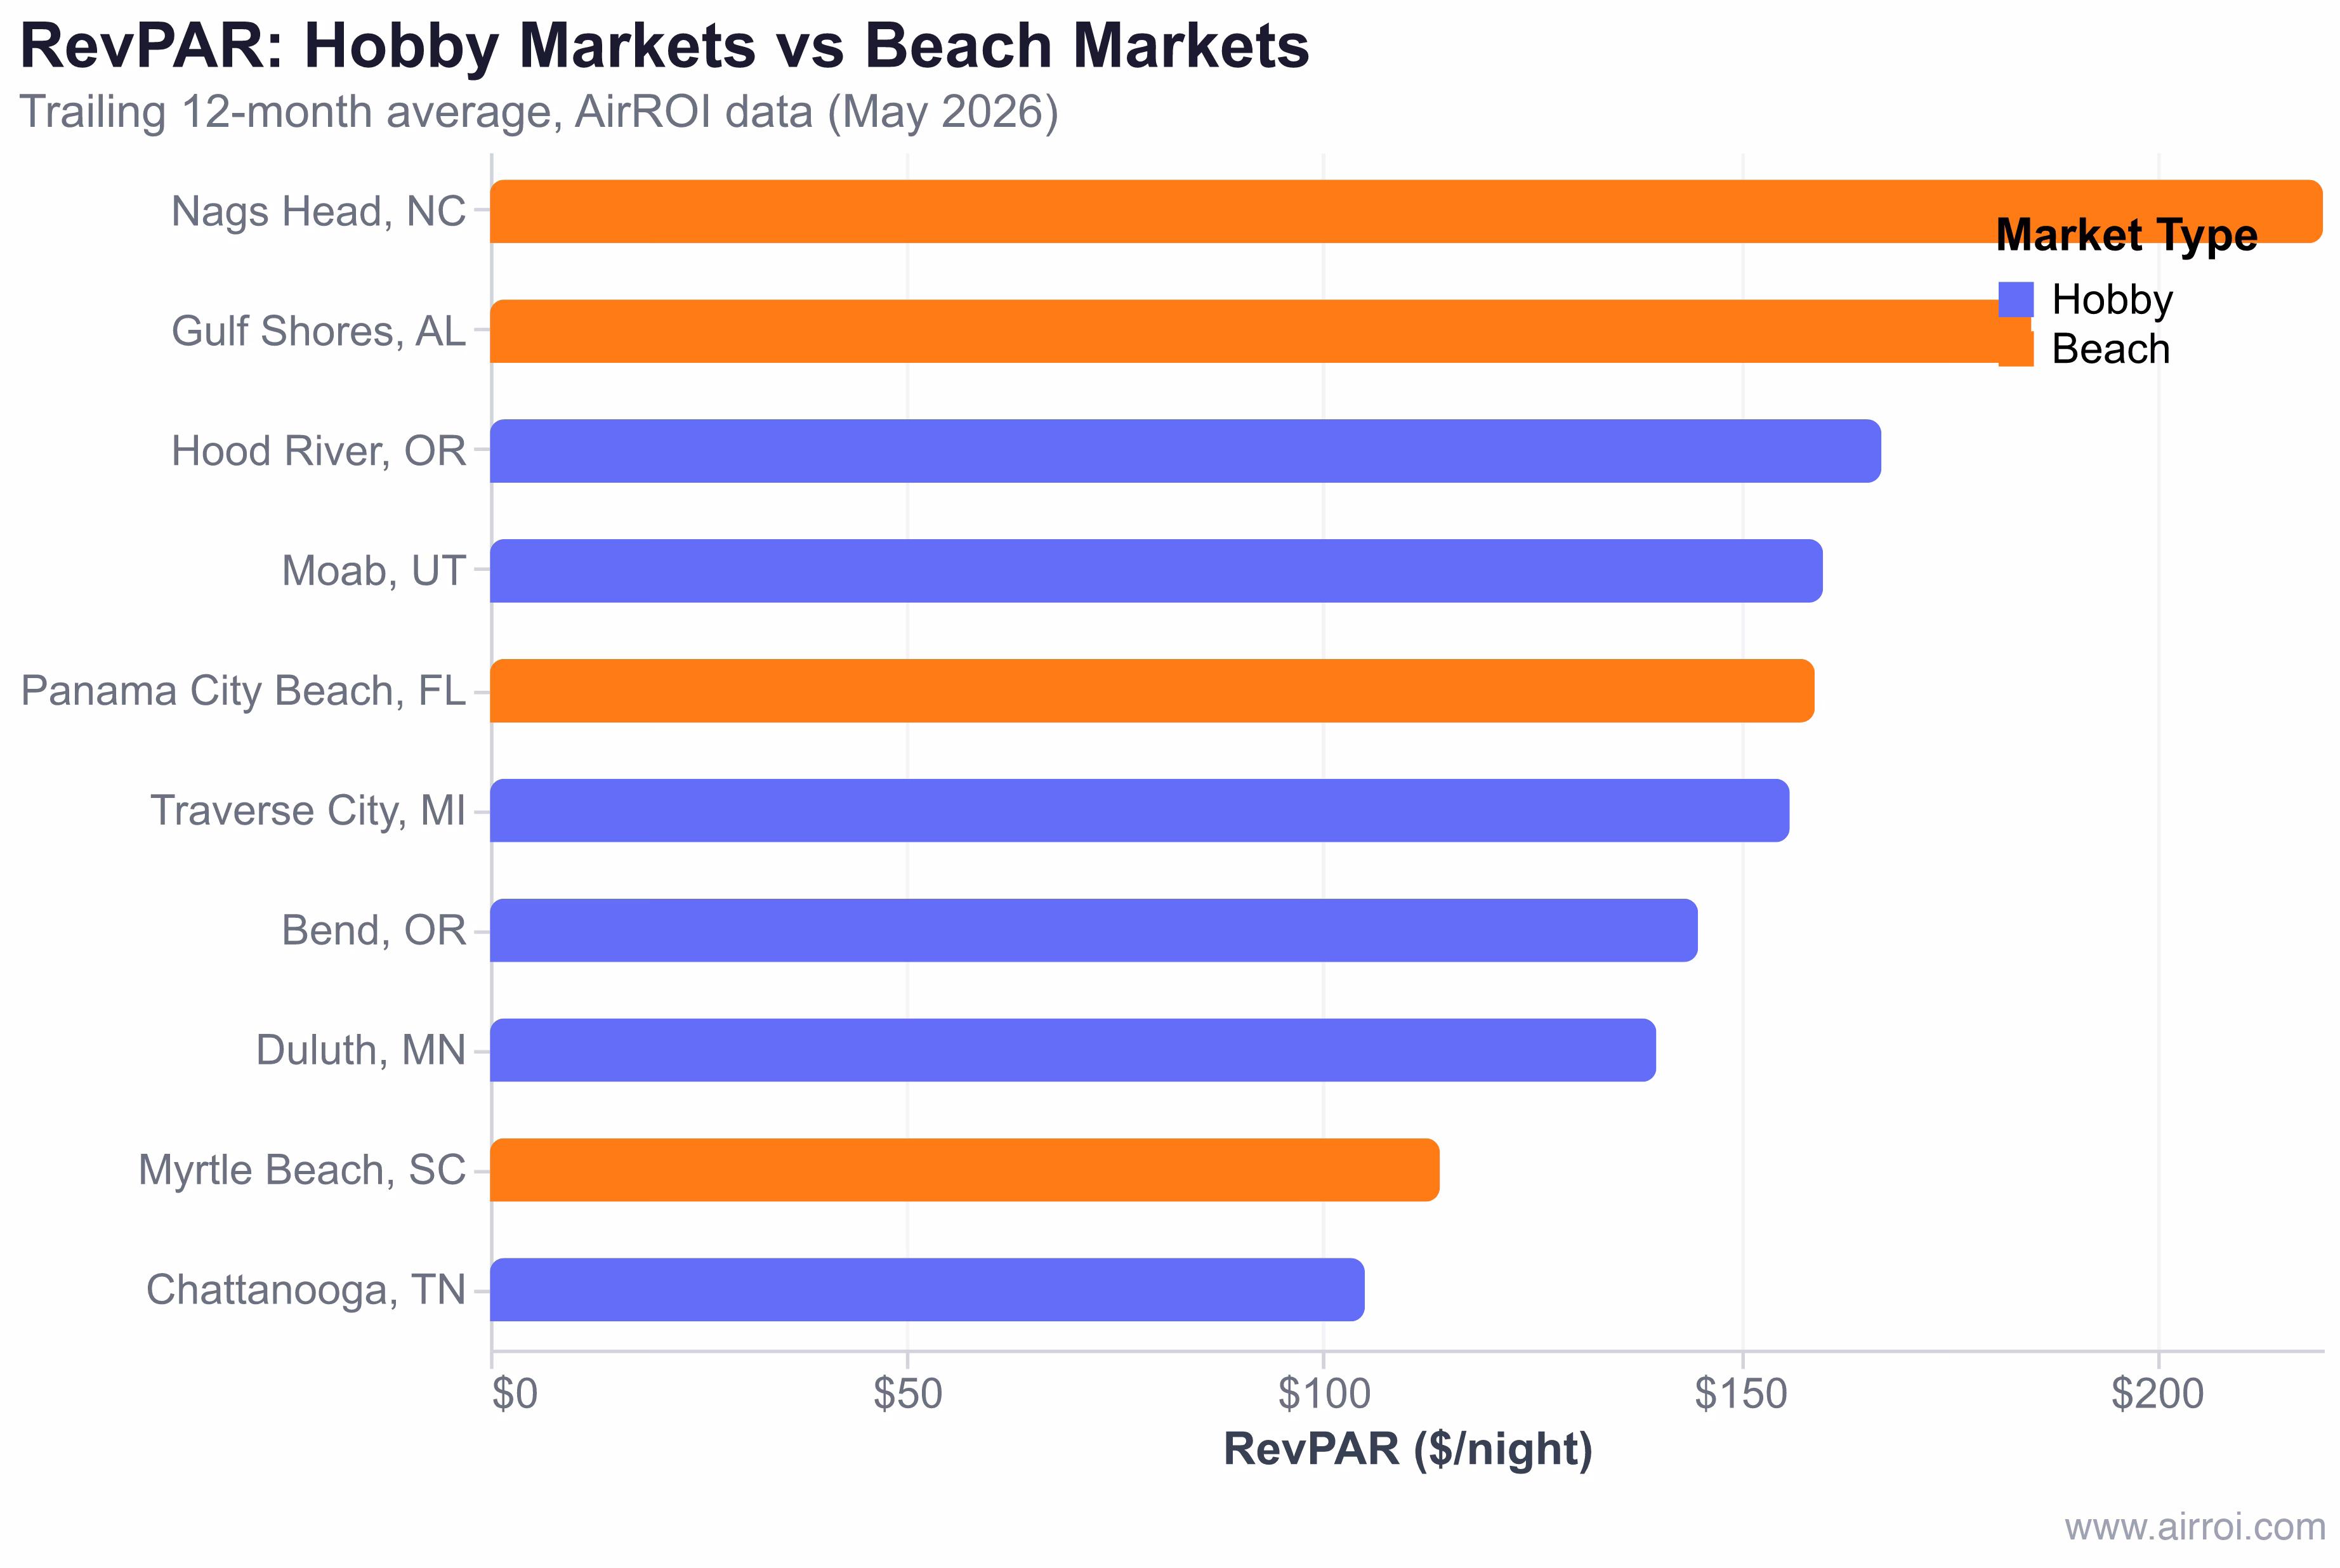
AirROI analyzed trailing-twelve-month performance data across 10 markets -- six defined by a specific outdoor hobby or activity cluster, and four traditional beach destinations that represent the default summer STR playbook. The results reveal a market structure that favors hobby destinations in ways the Airbnb report does not surface.
| Market | Type | Hobby/Draw | ADR | Occ% | RevPAR | Revenue | Listings |
|---|---|---|---|---|---|---|---|
| Nags Head, NC | Beach | Surfing/Fishing | $457 | 42% | $220 | $47,136 | 846 |
| Gulf Shores, AL | Beach | Beach/Gulf | $420 | 42% | $185 | $42,026 | 4,958 |
| Hood River, OR | Hobby | Windsurfing/Kiting | $373 | 44% | $167 | $37,703 | 216 |
| Moab, UT | Hobby | Climbing/MTB | $330 | 48% | $160 | $46,171 | 1,014 |
| Panama City Bch, FL | Beach | Spring Break/Beach | $354 | 43% | $159 | $35,304 | 9,952 |
| Traverse City, MI | Hobby | Cycling/Wine | $323 | 45% | $156 | $37,472 | 702 |
| Bend, OR | Hobby | Multi-Sport | $307 | 48% | $145 | $35,926 | 1,874 |
| Duluth, MN | Hobby | Hiking/Paddling | $294 | 46% | $140 | $34,862 | 356 |
| Myrtle Beach, SC | Beach | Beach | $261 | 40% | $114 | $23,554 | 7,561 |
| Chattanooga, TN | Hobby | Climbing/River | $210 | 49% | $105 | $28,520 | 1,034 |
The aggregate comparison tells the story. Across the six hobby markets, average annual revenue is $36,776. Across the four beach markets, it is $37,005. The difference is less than 1%.
Beach markets hold an ADR advantage ($373 average versus $306 for hobby markets), but hobby markets offset that with higher occupancy (46% versus 42%). The metric that synthesizes both -- RevPAR -- lands at $149 for hobby markets and $169 for beach markets. But that $20 gap is deceptive when viewed against the supply landscape.
The Seasonality Edge: Why Multi-Hobby Markets Flatten the Revenue Curve
Occupancy data tells the story beach-market-averages hide. Monthly occupancy curves across the trailing twelve months reveal fundamentally different demand patterns between hobby and beach markets -- and the difference has direct implications for mortgage-payment predictability.
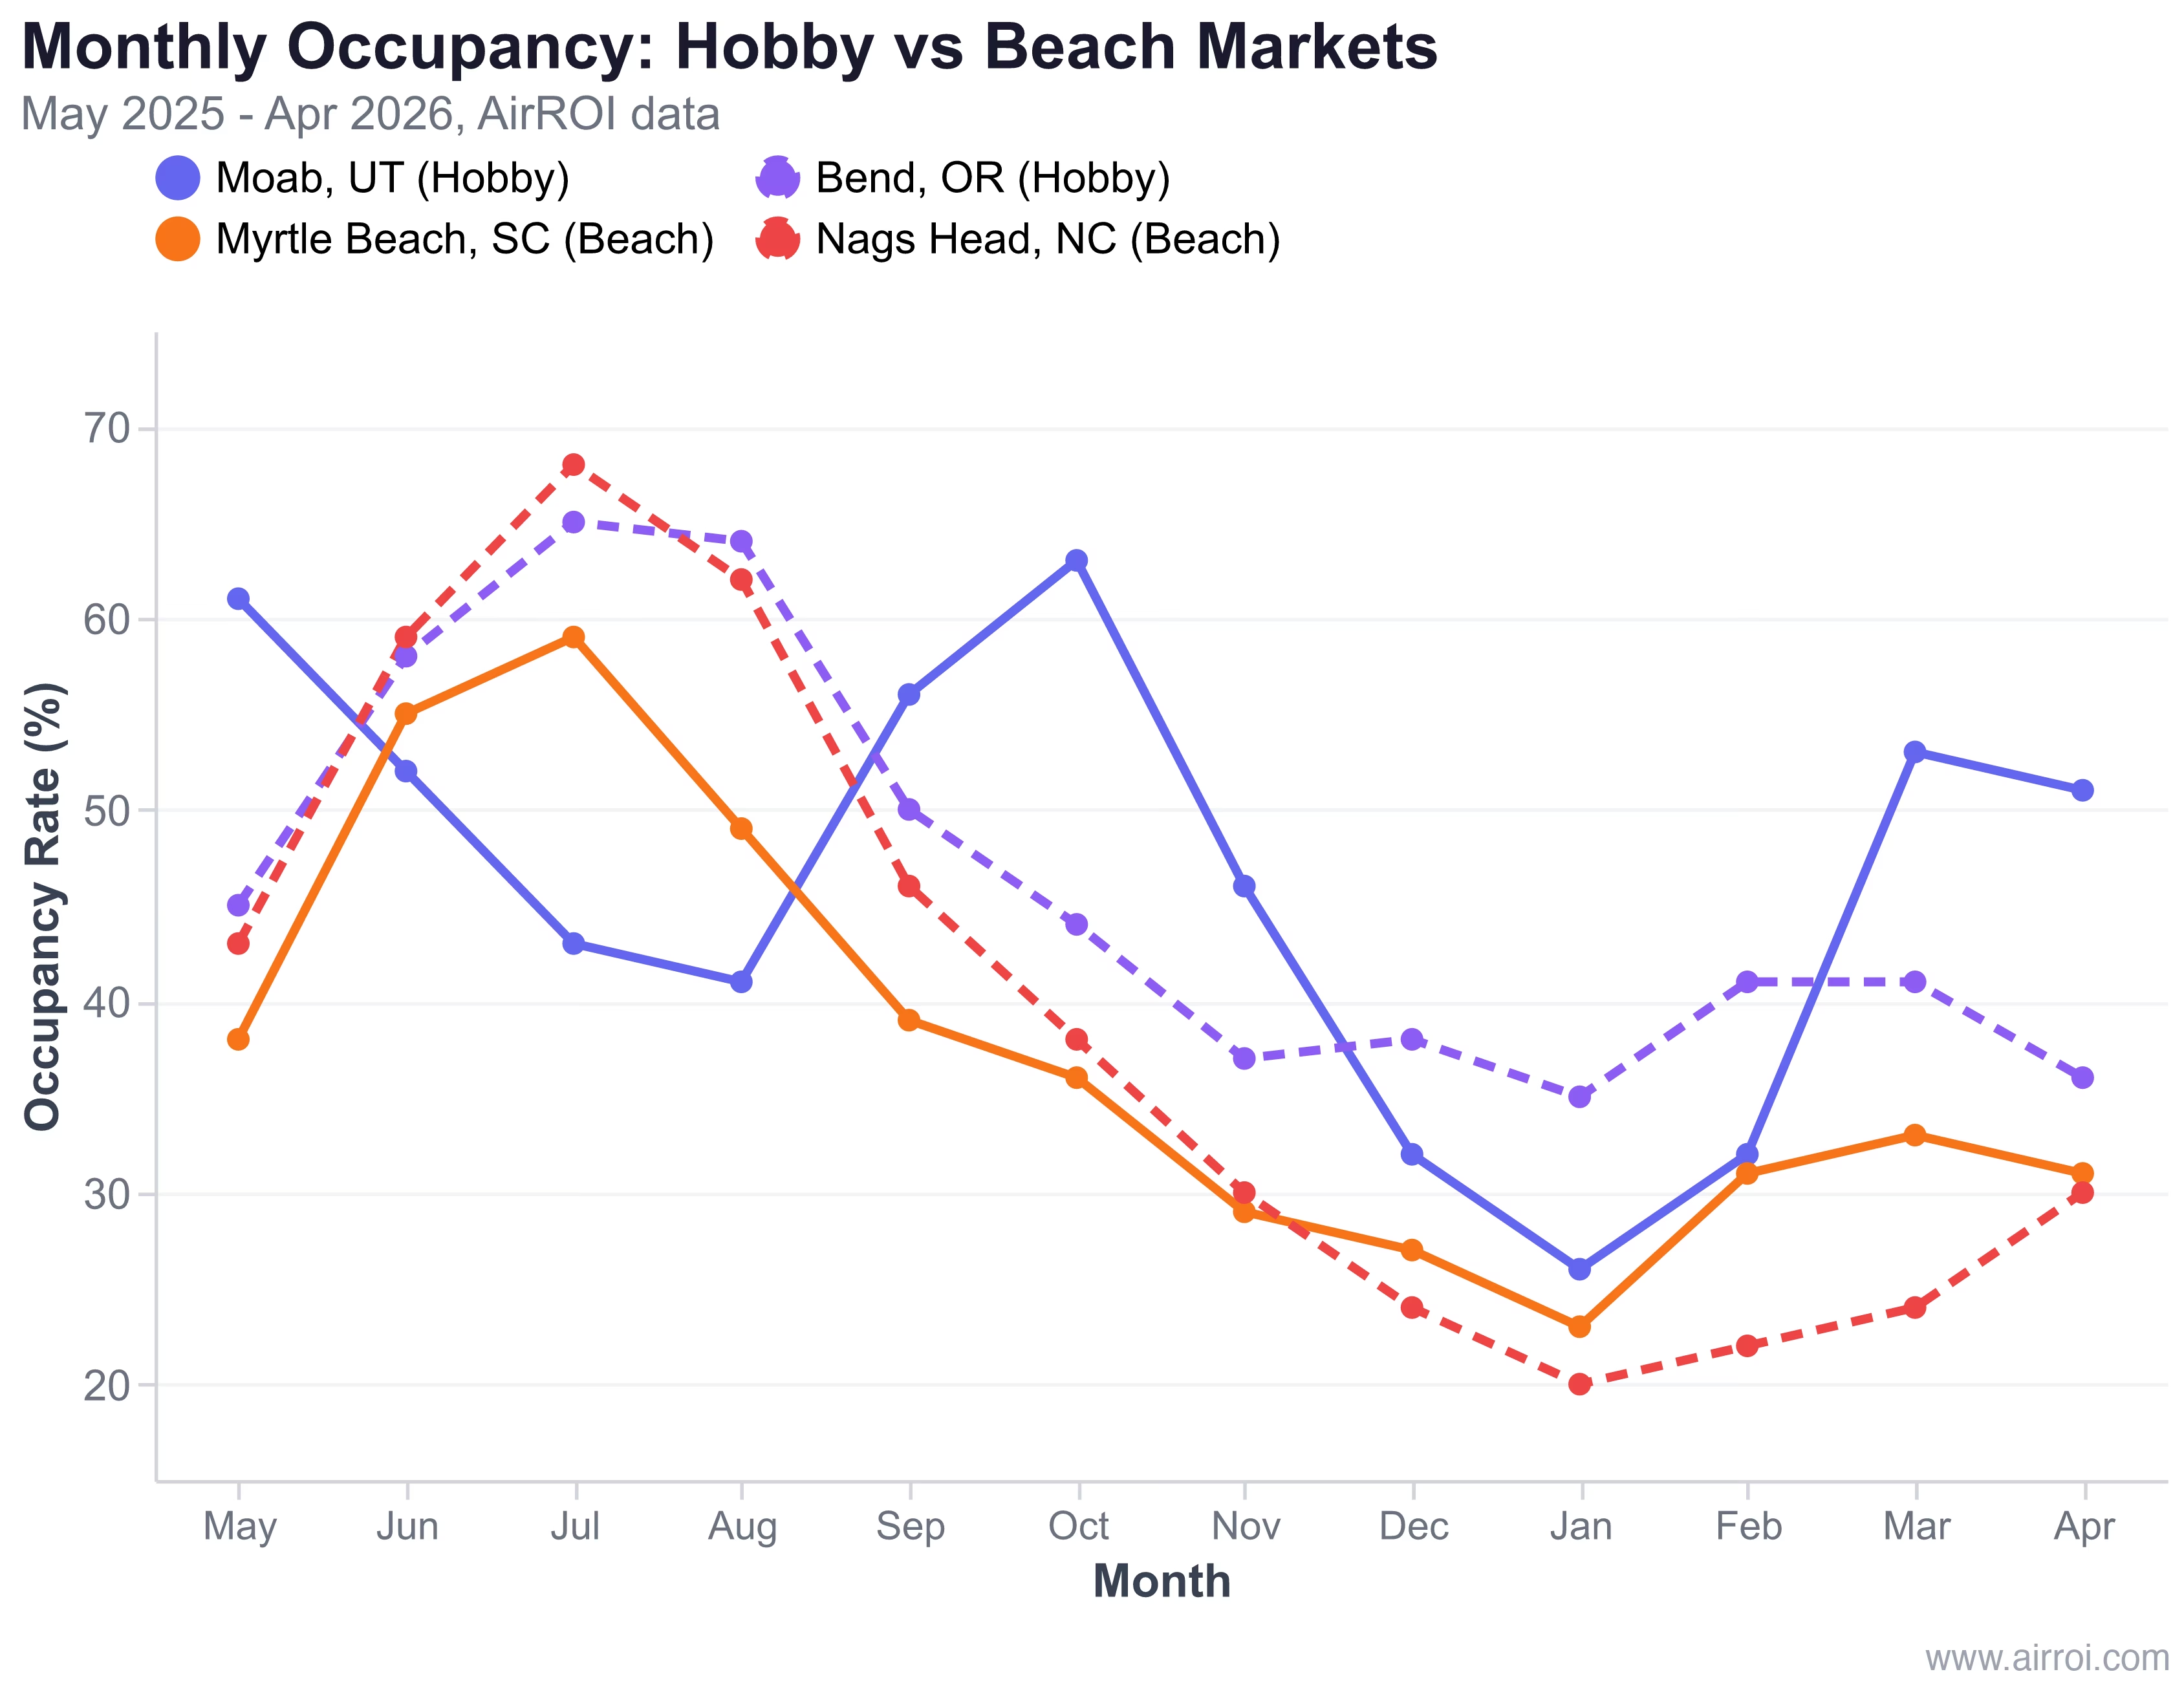
Bend, OR has the flattest seasonality curve of any market in the analysis. Its peak-to-trough spread is just 30 percentage points (65% in July, 35% in January), driven by overlapping demand seasons: skiing and snowboarding in winter, mountain biking and hiking in summer, fly fishing and paddleboarding in spring and fall. No single month carries the annual revenue burden.
Moab, UT demonstrates the power of dual-peak seasonality. Unlike beach markets that spike in summer, Moab peaks in spring (53-61% occupancy in March-May) and fall (56-63% in September-October), with its highest occupancy in October at 63%. Summer is actually Moab's shoulder season (41-43% in July-August) because desert heat suppresses demand. This inverted pattern means Moab generates strong revenue in 8 months rather than concentrating it in 4.
| Market | Peak Occ% | Trough Occ% | Spread | Pattern |
|---|---|---|---|---|
| Bend, OR | 65% (Jul) | 35% (Jan) | 30 pts | Multi-season (ski + summer) |
| Moab, UT | 63% (Oct) | 26% (Jan) | 37 pts | Dual-peak (spring + fall) |
| Myrtle Beach, SC | 59% (Jul) | 23% (Jan) | 36 pts | Single summer spike |
| Nags Head, NC | 68% (Jul) | 20% (Jan) | 48 pts | Extreme summer concentration |
The investment implication is straightforward: multi-activity hobby markets produce flatter revenue curves. Flatter curves mean more months where rental income exceeds mortgage payments, reducing the financial stress of carrying a vacation property through the off-season.
The Supply Advantage Hiding in Plain Sight
The most consequential difference between hobby and beach markets is not ADR, occupancy, or even seasonality. It is supply density. The average hobby market has 701 active listings. The average beach market has 5,829. That is an 88% supply advantage for hobby markets.
| Market | Type | Active Listings | Revenue/Listing |
|---|---|---|---|
| Hood River, OR | Hobby | 216 | $37,703 |
| Duluth, MN | Hobby | 356 | $34,862 |
| Traverse City, MI | Hobby | 702 | $37,472 |
| Moab, UT | Hobby | 1,014 | $46,171 |
| Chattanooga, TN | Hobby | 1,034 | $28,520 |
| Bend, OR | Hobby | 1,874 | $35,926 |
| Nags Head, NC | Beach | 846 | $47,136 |
| Gulf Shores, AL | Beach | 4,958 | $42,026 |
| Myrtle Beach, SC | Beach | 7,561 | $23,554 |
| Panama City Beach, FL | Beach | 9,952 | $35,304 |
Hood River, OR is the extreme case: 216 listings serving a premium windsurfing and kiteboarding market that commands a $373 ADR -- the highest among all hobby markets. With its position at the nexus of the Columbia River Gorge and Mount Hood, Hood River has a natural supply ceiling that beach markets lack. You cannot build another beach, but you also cannot replicate the conditions that make Hood River the windsurfing capital of the US.
The supply problem in beach markets is structural. One host on r/airbnb_hosts described stepping down after their city went from 57 listings to over 1,000: "We were booked near constantly for years. This past year the bookings dropped, our rating went down, and then we simply stopped getting bookings altogether. There we were, on page 22 of about 68 pages."
That scenario plays out at scale in beach markets. Panama City Beach has 9,952 active listings. Myrtle Beach has 7,561. Even Gulf Shores -- a market with $420 ADR and $42,026 annual revenue -- has 4,958 listings fighting for the same guests.
The Playcation Scorecard: Where Revenue, Supply, and Seasonality Align
Not all hobby markets are equal. To identify which playcation destinations offer the strongest combination of investment fundamentals, AirROI scored each hobby market across four dimensions: annual revenue, supply competition (inverse of listing count), seasonality flatness (inverse of peak-to-trough spread), and occupancy rate.
| Market | Revenue Rank | Supply Advantage | Seasonality | Occupancy | Overall |
|---|---|---|---|---|---|
| Moab, UT | 1st ($46K) | Moderate (1,014) | Dual-peak | 48% | Best revenue |
| Hood River, OR | 3rd ($38K) | Highest (216) | Moderate | 44% | Best supply position |
| Bend, OR | 4th ($36K) | Low (1,874) | Flattest (30 pts) | 48% | Best seasonality |
| Traverse City, MI | 3rd ($37K) | Moderate (702) | Moderate | 45% | Best balance |
| Duluth, MN | 5th ($35K) | High (356) | Moderate | 46% | Affordable entry |
| Chattanooga, TN | 6th ($29K) | Low (1,034) | Moderate | 49% | Highest occupancy |
Moab leads on absolute revenue and benefits from a dual-peak seasonality pattern that most beach markets cannot replicate. Its 1,014-listing supply is manageable but growing -- investors who enter now will have a first-mover advantage as the playcation trend accelerates demand.
Hood River offers the most defensible supply position at just 216 listings, paired with the highest ADR ($373) of any hobby market. The trade-off is lower occupancy (44%) and geographic constraint -- the market is small enough that a handful of new listings could shift the competitive dynamics.
Bend delivers the flattest seasonality of any market in the analysis (30-point spread), making it the strongest choice for investors who prioritize cash-flow predictability over peak revenue. Its four-season appeal -- skiing, mountain biking, fly fishing, rock climbing, paddling -- creates overlapping demand windows that no single-activity market can match.
Chattanooga is the value entry point. At $28,520 average annual revenue, it trails the other hobby markets, but its 49% occupancy -- the highest in the entire 10-market analysis -- signals consistent demand. Rock climbing at Tennessee Wall, whitewater on the Ocoee River, and Ruby Falls tourism create a steady baseline that rewards hosts willing to operate at a lower ADR.
For investors evaluating these markets, the data supports a clear thesis: hobby-driven STR markets deliver comparable revenue to beach markets while competing against dramatically fewer listings, with flatter seasonality curves that reduce cash-flow risk. The playcation trend is real. The question is whether you enter the market before supply catches up to demand.
Frequently Asked Questions
A playcation is Airbnb's term for a short-haul trip centered on an active hobby like surfing, climbing, cycling, or golf. Unlike traditional beach vacations focused on relaxation, playcations are purpose-driven -- the activity is the reason for the trip. Airbnb's 2026 summer data shows listings near golf courses, lakefronts, and surf spots have some of the highest booking growth this season.
AirROI data shows Moab, UT ($46,171 annual revenue, $160 RevPAR), Hood River, OR ($37,703, $167 RevPAR), and Traverse City, MI ($37,472, $156 RevPAR) lead hobby-driven markets on revenue. These markets outperform oversaturated beach destinations like Myrtle Beach ($23,554 annual revenue) while competing against 86-97% fewer active listings.
Many do. Moab's dual-peak pattern (spring climbing, fall foliage) produces a 37-point occupancy spread versus Nags Head's 48-point summer spike. Bend's combined ski-and-summer seasons create a 30-point spread, the flattest among all 10 markets analyzed. Flatter seasonality means more predictable monthly cash flow for hosts.
Not yet. The average hobby market has 701 active listings versus 5,829 in beach markets -- an 88% supply advantage. Hood River has just 216 listings serving a premium windsurfing market with $373 ADR. However, rural supply is growing at 23% year-over-year, so early entry matters for investors targeting these destinations.
Both. The underlying behavioral shift is real: 33% of summer travelers are choosing closer-to-home trips, 86% express interest in rural getaways, and 64% of US Airbnb guests traveled under 300 miles in 2025. But Airbnb's specific market picks are curated for press value, not revenue validation. AirROI data confirms the revenue case for some hobby markets while showing others perform modestly.