
World Cup 2026 Hotels vs. Airbnb: AirROI Data Shows Where Demand Is Actually Going
Nearly 80% of hotels across the 11 US World Cup 2026 host cities report bookings tracking below initial forecasts. In the same cities, AirROI pacing data shows STR fill rates surging 100-187% above baseline during match weeks. The accommodation battle between hotels and Airbnb is not a demand story -- it is a structural realignment. Kansas City STRs hit 62% fill rates while hotel operators there call the tournament a "non-event." Dallas STRs are booking at 43% fill rates with average daily rates of $363. The $30.5 billion event FIFA promised is delivering -- but the dollars are landing in different rooms than the hotel industry expected.
Hotels Call the World Cup a "Non-Event" -- Here Is What the Numbers Say
The underperformance is not uniform. Boston, Philadelphia, San Francisco, and Seattle saw nearly 80% of respondents report booking pace below expectations and behind a typical summer -- meaning the World Cup is not just underdelivering against inflated projections, but actually dragging behind normal seasonal demand. In New York, approximately two-thirds of respondents reported softer-than-expected bookings. Dallas and Houston saw about 70% below-forecast sentiment.
"Many respondents describe the tournament as a 'non-event' in these cities." -- AHLA Survey Report, May 2026
Two cities bucked the trend. Miami reported approximately 55% of respondents with booking pace ahead of expectations and typical summer benchmarks. Atlanta saw roughly 50% of respondents in-line or ahead.
Airbnb's Counter-Narrative: Biggest Hosting Event in Company History
The numbers behind that claim are substantial. Over 382,000 Airbnb guests are expected to travel for the tournament, including more than 150,000 from the United States. Airbnb stays during the World Cup are projected to contribute $3.6 billion to host city economies, with hosts across 16 cities earning up to $210 million collectively.
The demand signals are clear: Airbnb searches in host cities increased 80% year-over-year, and more than 100,000 new homes have listed on the platform since October 2025. Families and groups account for more than half of World Cup Airbnb travel -- a critical detail that explains the structural split with hotels.
Airbnb also holds three advantages that hotels cannot replicate at this stage:
- Geographic coverage: Airbnb listings are present in 67% of host city zip codes, compared to 38% for hotels. Fans staying in stadium-adjacent residential neighborhoods -- not just downtown hotel districts -- have more options on Airbnb.
- Reserve Now Pay Later: RNPL represented 20% of Airbnb's global gross booking value in Q1 2026, with 70%+ adoption among eligible US bookings. Fans could lock in rates months ago with zero upfront cost, a booking mechanism hotels rarely match. For more on RNPL's market impact, see our Airbnb Q1 2026 earnings recap.
- Supply elasticity: Unlike hotels with fixed room counts, Airbnb's supply expands for events. Those 100,000 new listings are primary residences entering the market temporarily -- capacity that did not exist six months ago.
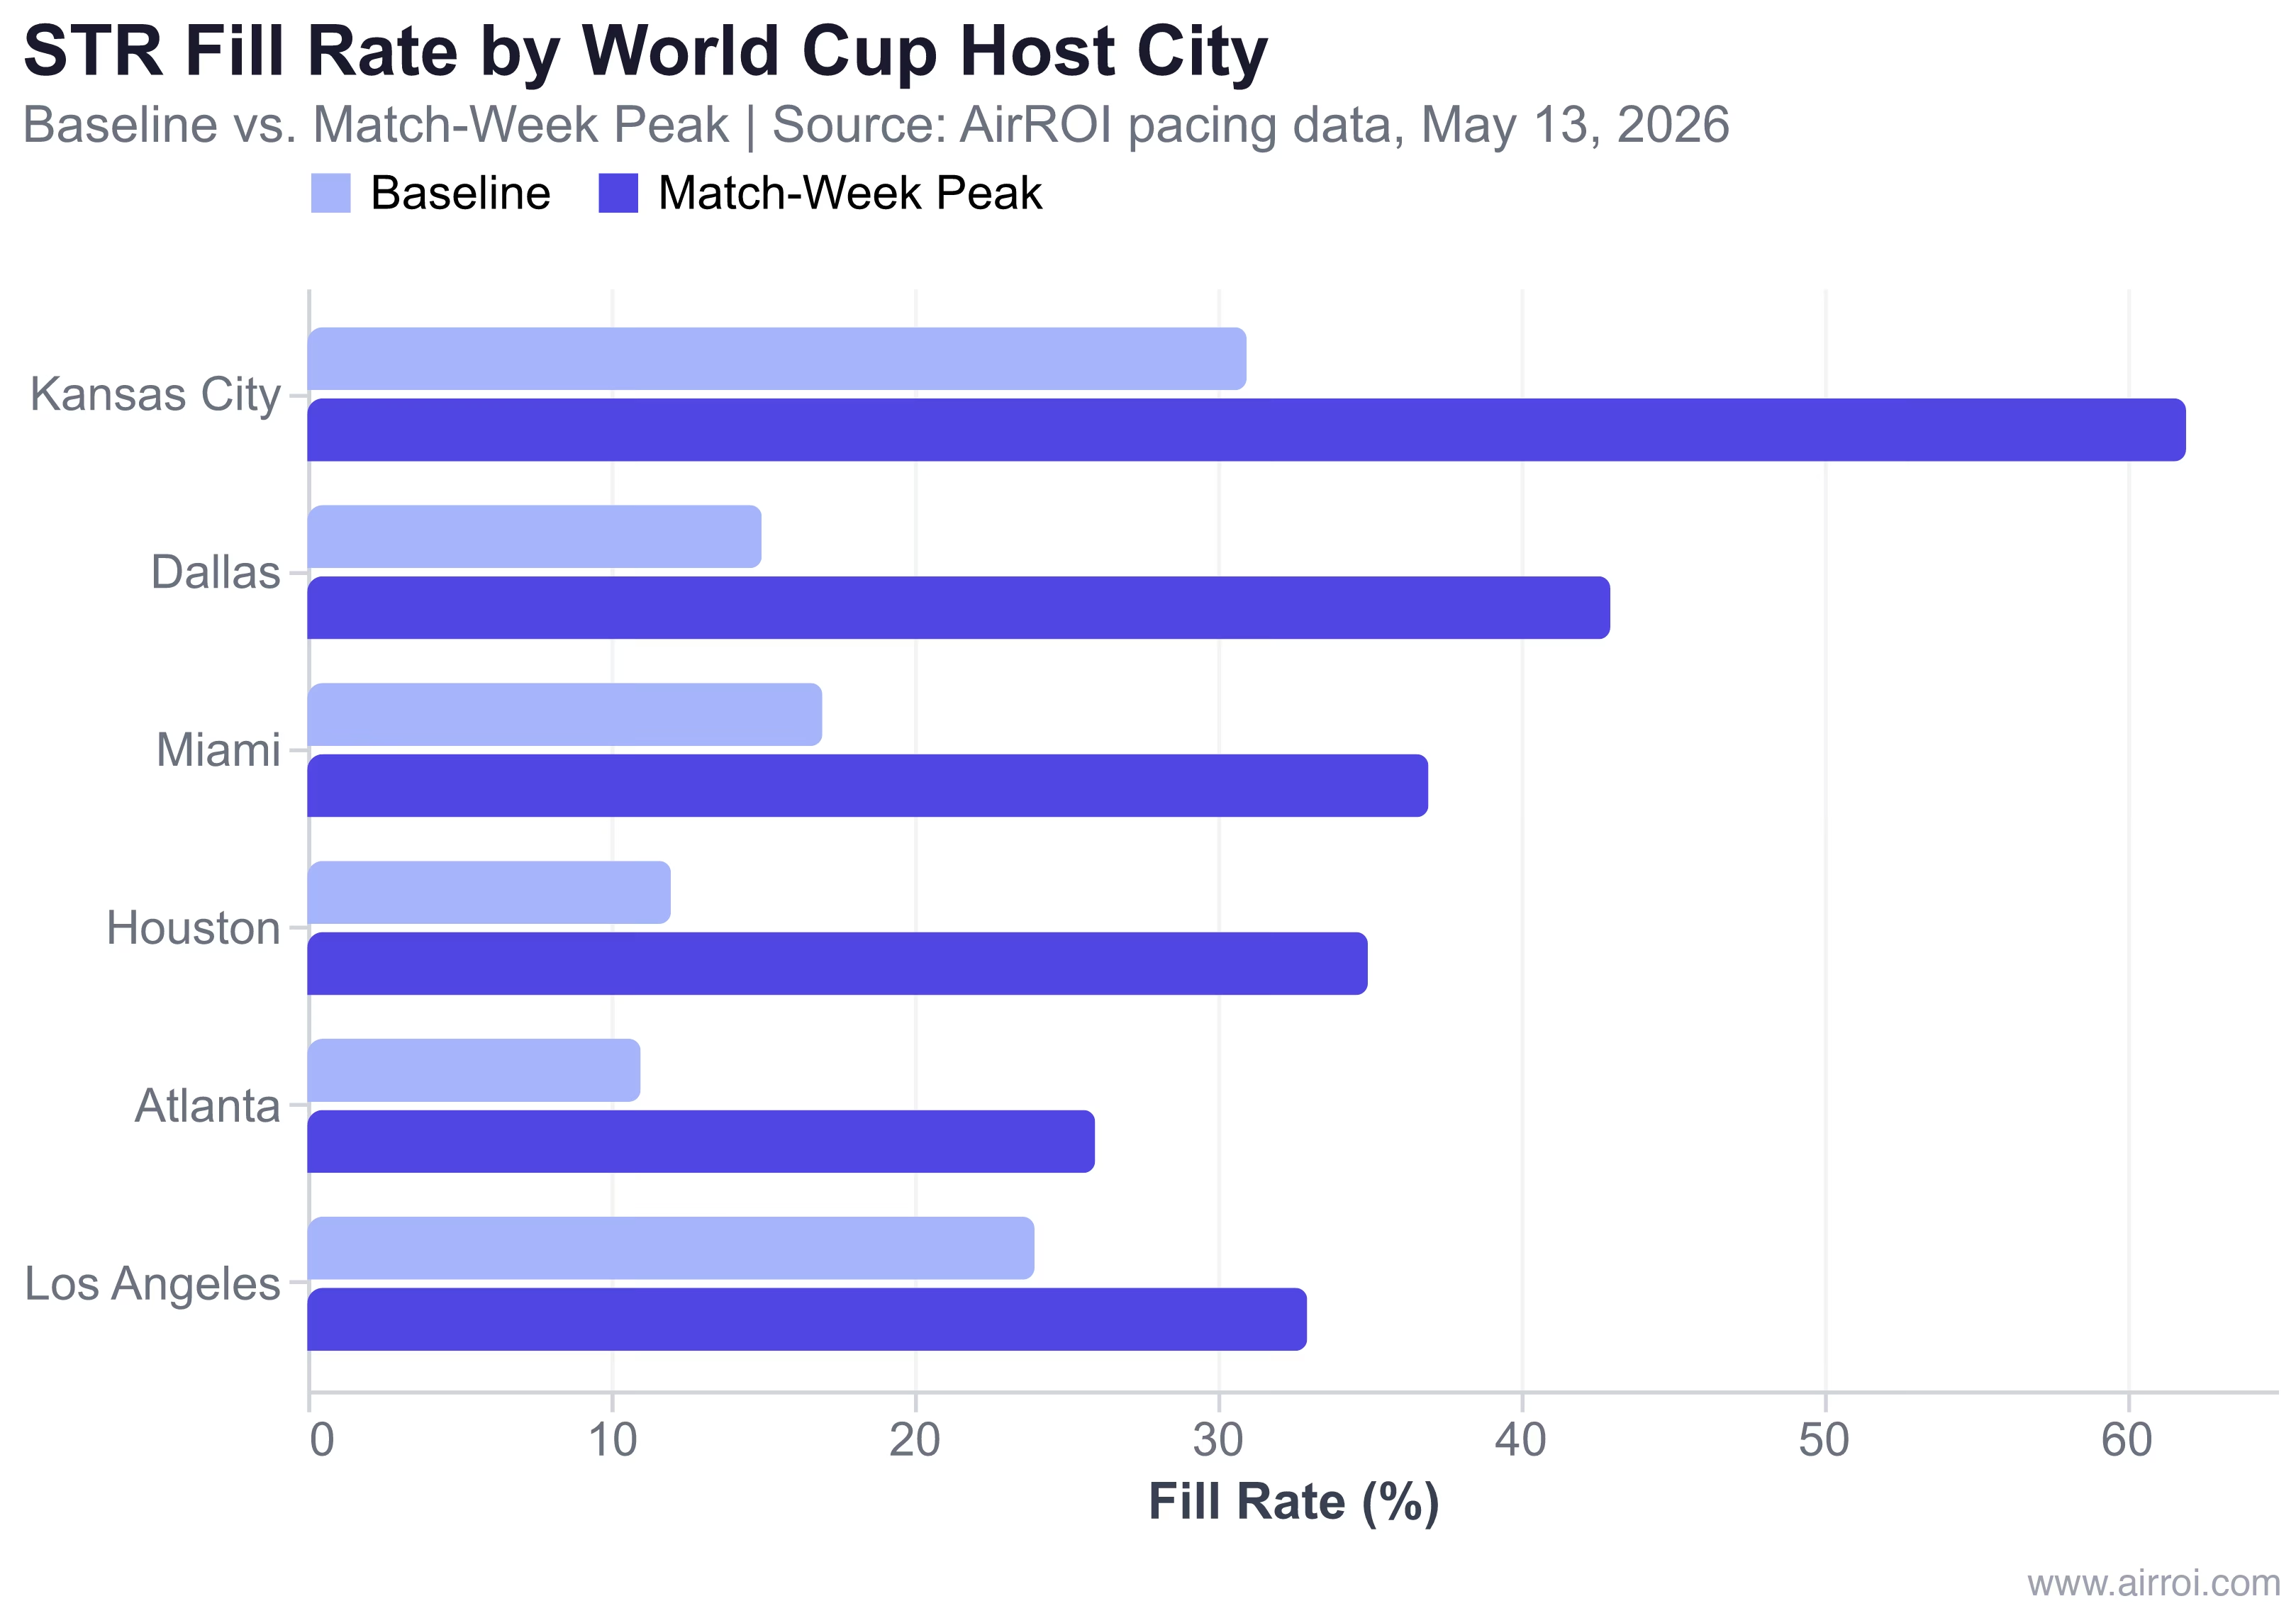
AirROI Pacing Data: Where World Cup STR Demand Is Concentrating
The headline-level split between hotel disappointment and Airbnb optimism obscures what is happening at the city level. AirROI's forward-looking pacing data -- pulled on May 13, 2026 -- reveals which markets are actually filling and at what rates.
| City | Total STR Listings | Baseline Fill Rate | Match-Week Peak Fill Rate | Change | Booked ADR (Match Week) | Available ADR (Match Week) |
|---|---|---|---|---|---|---|
| Kansas City | ~1,800 | 31% | 62% | +100% | $430-$508 | $687-$729 |
| Dallas | ~6,200 | 15% | 43% | +187% | $336-$363 | $573-$647 |
| Houston | ~12,700 | 12% | 35% | +192% | $263-$307 | $419-$444 |
| Miami | ~11,800 | 17% | 37% | +118% | $378-$404 | $509-$534 |
| Atlanta | ~8,600 | 11% | 26% | +136% | $343-$358 | $441-$481 |
| Los Angeles | ~15,400 | 24% | 33% | +38% | $345-$359 | $354-$375 |
Source: AirROI pacing data, May 13, 2026. Fill rates represent percentage of total STR inventory booked for tournament match dates (June 11 - July 19).
Kansas City is the standout. With only 1,800 total listings and a concentrated match schedule that includes group stage games on June 15-16 (60-62% fill rate) and June 24-25 (50-62% fill rate), it is the most supply-constrained host city. Booked ADRs of $430-$508 during match weeks represent a premium that reflects genuine scarcity.
Dallas shows the largest relative fill rate jump at +187%, with peak match-week dates hitting 40-43% fill rates. AT&T Stadium's massive 94,000-seat capacity -- hosting semifinal matches -- is driving demand. Available ADRs of $573-$647 suggest remaining inventory is priced aggressively, but with over 6,200 listings in the market, there is still room for late bookers.
Houston tells the most nuanced story. Despite being the city where the AHLA survey found hotel sentiment weakest (70% below expectations), STR fill rates surge from a 12% baseline to 35% during peak match periods. Houston has the second-largest STR supply in this analysis (12,700 listings), so a 35% fill rate still represents significant booking volume in absolute terms -- roughly 4,400 listings booked on peak nights.
Los Angeles shows the most muted STR response, with fill rates climbing only from 24% to 33%. This is not weakness -- it is depth. LA's 15,400-listing market is large enough to absorb event-driven demand without dramatic fill rate spikes, and its ADR spread between booked ($345-$359) and available ($354-$375) rates is the tightest of any city, indicating rational pricing rather than speculation.
Why the Split Is Happening: Per-Person Economics
The divergence between hotel disappointment and STR demand is not random. It follows the math of group travel, which dominates World Cup accommodation.
According to Deloitte's analysis for Airbnb, the average anticipated price for Airbnb accommodation during the World Cup is $122 per night per person. Compare that to individual hotel rooms averaging $300+ per night in host cities, and the per-person gap becomes the story:
| Metric | Hotels (4 individual rooms) | Airbnb (4-bedroom listing) |
|---|---|---|
| Nightly cost (Dallas, match week) | $2,200+ (4 x $550+) | ~$340 total |
| Per-person cost (group of 4) | $550/person | $85/person |
| Per-person cost (group of 8) | $275/person | $43/person |
| Kitchen access | No | Yes (saves $50-100/day for groups) |
For a group of eight friends traveling from Mexico City to watch Mexico's group stage matches in Dallas -- a common World Cup travel pattern -- the hotel bill for 8 nights at 4 rooms would exceed $17,600. A 4-bedroom Airbnb at AirROI's tracked booked rate of ~$340/night costs $2,720 total. That is $340 per person versus $2,200 per person -- an 85% savings that makes the accommodation choice obvious.
This per-person math explains why families and groups account for more than half of World Cup Airbnb bookings. Add three structural accelerants:
- FIFA's hotel block cancellations released thousands of rooms back into a market that had already shifted to STRs, widening the accommodation gap hotels need to fill.
- Reserve Now Pay Later let fans commit to STR bookings months ago with no upfront cost -- a frictionless booking path hotels rarely offer for group stays.
- Geographic distribution gives STRs a proximity advantage. With listings in 67% of host city zip codes versus 38% for hotels, fans can stay in stadium-adjacent neighborhoods rather than commuting from downtown hotel clusters.
What Hosts Should Do Now: City-Tier Pricing Strategy
Not all host cities present the same opportunity. AirROI pacing data reveals three distinct tiers, each with a different pricing playbook.
Tier 1 -- Hold Rates: Kansas City. With 62% fill rates, ~1,800 total listings, and the widest booked-to-available ADR spread ($508 booked vs. $729 available), Kansas City's supply constraint is real. Hosts with remaining availability can maintain premium pricing. Demand exceeds supply -- the fill rate math proves it.
Tier 2 -- Monitor and Adjust: Dallas, Miami. Dallas (43% fill rate, 6,200 listings) and Miami (37% fill rate, 11,800 listings) show strong demand but wider ADR spreads that signal some overpricing in remaining inventory. Dallas available ADR of $573-$647 versus booked ADR of $336-$363 suggests a 60-90% premium on unsold nights. Hosts should monitor pacing weekly and consider 10-15% rate reductions on nights that remain unbooked 14 days before match dates.
Tier 3 -- Reduce and Capture: Houston, Los Angeles. Houston (35% fill rate, 12,700 listings) and Los Angeles (33% fill rate, 15,400 listings) have deep supply that absorbs event demand without scarcity. The remaining available ADR premium over booked ADR is substantial -- Houston's available inventory asks $419-$444 versus $263-$307 for booked nights. Hosts with open match-week nights should lower rates toward the booked ADR range to capture last-minute demand before it leaks to hotels offering late discounts.
The signal is in the spread. When booked ADR and available ADR converge (as in Los Angeles at $345 vs. $354), the market has priced rationally. When they diverge sharply (Kansas City at $508 vs. $729), either scarcity justifies the premium or remaining inventory is speculative. AirROI pacing data lets hosts distinguish the two in real time.
Frequently Asked Questions
Nearly 80% of hotels across the 11 US host cities report bookings tracking below initial forecasts, according to the AHLA's survey of 200+ properties. Contributing factors include visa difficulties for international visitors, a strong US dollar, geopolitical headwinds depressing inbound tourism, and FIFA's March cancellation of thousands of pre-committed hotel room blocks -- including 2,000 rooms in Philadelphia and 15,000 room-nights in Vancouver.
AirROI pacing data shows Kansas City leads all host cities with 55-62% STR fill rates during match weeks, the highest of any market. Dallas follows at 37-43%, Miami at 28-37%, and Houston at 27-35%. Kansas City's outsized fill rate stems from its small STR market of approximately 1,800 total listings combined with a concentrated match schedule.
Airbnb projects hosts across 16 cities will earn up to $210 million collectively during the tournament. Per-host earnings vary by city and match proximity. In Kansas City, booked ADRs during match weeks range from $430 to $508, representing a 100-140% premium over baseline. Dallas hosts are locking in $336-$363 ADRs, and Houston hosts see $263-$307 during peak match periods.
It depends on the city. In constrained markets like Kansas City with 1,800 listings and 62% fill rates, hosts can hold elevated rates. In oversupplied markets like Houston with 12,700 listings and 35% peak fill rates, hosts with remaining availability should lower rates to capture last-minute demand. The gap between booked ADR and available ADR signals whether a market is overpriced.
Airbnb's Reserve Now Pay Later program lets guests book with no upfront payment. In Q1 2026, RNPL represented 20% of global gross booking value, with 70%+ adoption among eligible US bookings. For World Cup travel, this removes the financial commitment barrier and lets fans lock in rates months ahead without immediate outlay.