Airbnb Night Caps: What Salt Lake City's 200 Actually Costs

The median entire-home Airbnb listing in Salt Lake City booked 105.5 nights in the twelve months to June 30, 2026. The city's new annual night cap, in force since July 1, is 200. The number regulating this market sits 94.5 nights above the middle of it.
That gap is the economics of a night cap, and it cuts both ways. Across 2,050 Salt Lake City entire-home listings with a full year of calendar history, 418 — 20.4% — booked more than 200 nights. The nights beyond their 200th are worth $2.37M to $3.33M: 5.60% to 7.85% of the market's booked-night revenue, depending on whether a host can steer which nights to give up. Four listings in five never touch the rule. The fifth that does loses a median 17.1% of its revenue.
The reason to price this now is that the city has not. FOX 13 Utah reported that at a July 14 council work session, members asked how staff picked the two-night minimum and the 200-night maximum, and that "Staff were unable to immediately provide the research behind the numbers and said they would return with comparisons from other communities." Council member Sarah Young was blunter: "The one that jumps out at me is the 200 days," she said. "How does that even translate into something that can be enforceable?" The council left the ordinance in force while staff study amendments to the minimum stay, the multifamily rule and the cap itself.
Disclaimer: This is analysis, not legal or investment advice. Salt Lake City's ordinance is under active amendment; verify current requirements with the city before acting.
At a glance
| Statistic | Value | Basis |
|---|---|---|
| Median booked nights, SLC entire-home listing | 105.5 | 2,050-listing full-year panel, 12 months to 2026-06-30 |
| Listings above 200 booked nights | 418 of 2,050 (20.4%) | Same panel; strictly more than 200 |
| Market booked-night revenue above night 200 | 5.60%–7.85% ($2.37M–$3.33M) | Cheapest-first vs chronological allocation |
| Spread across 14 markets on the same 200 cap | 0.55% to 13.49% (24.5×) | Park City, UT vs San Francisco, CA |
Where the 200-night line falls in Salt Lake City
Salt Lake City's booked-night distribution is nowhere near its cap. Across 2,050 entire-home listings carrying a full twelve months of calendar between July 1, 2025 and June 30, 2026, the median listing booked 105.5 nights, the 75th percentile 186, and the 90th percentile 240.1. 79.3% of the panel sits at or below 199 booked nights, and the market's largest revenue band — listings booking 151 to 200 nights, worth $10.82M or 25.5% of panel booked-night revenue — sits entirely under the cap.
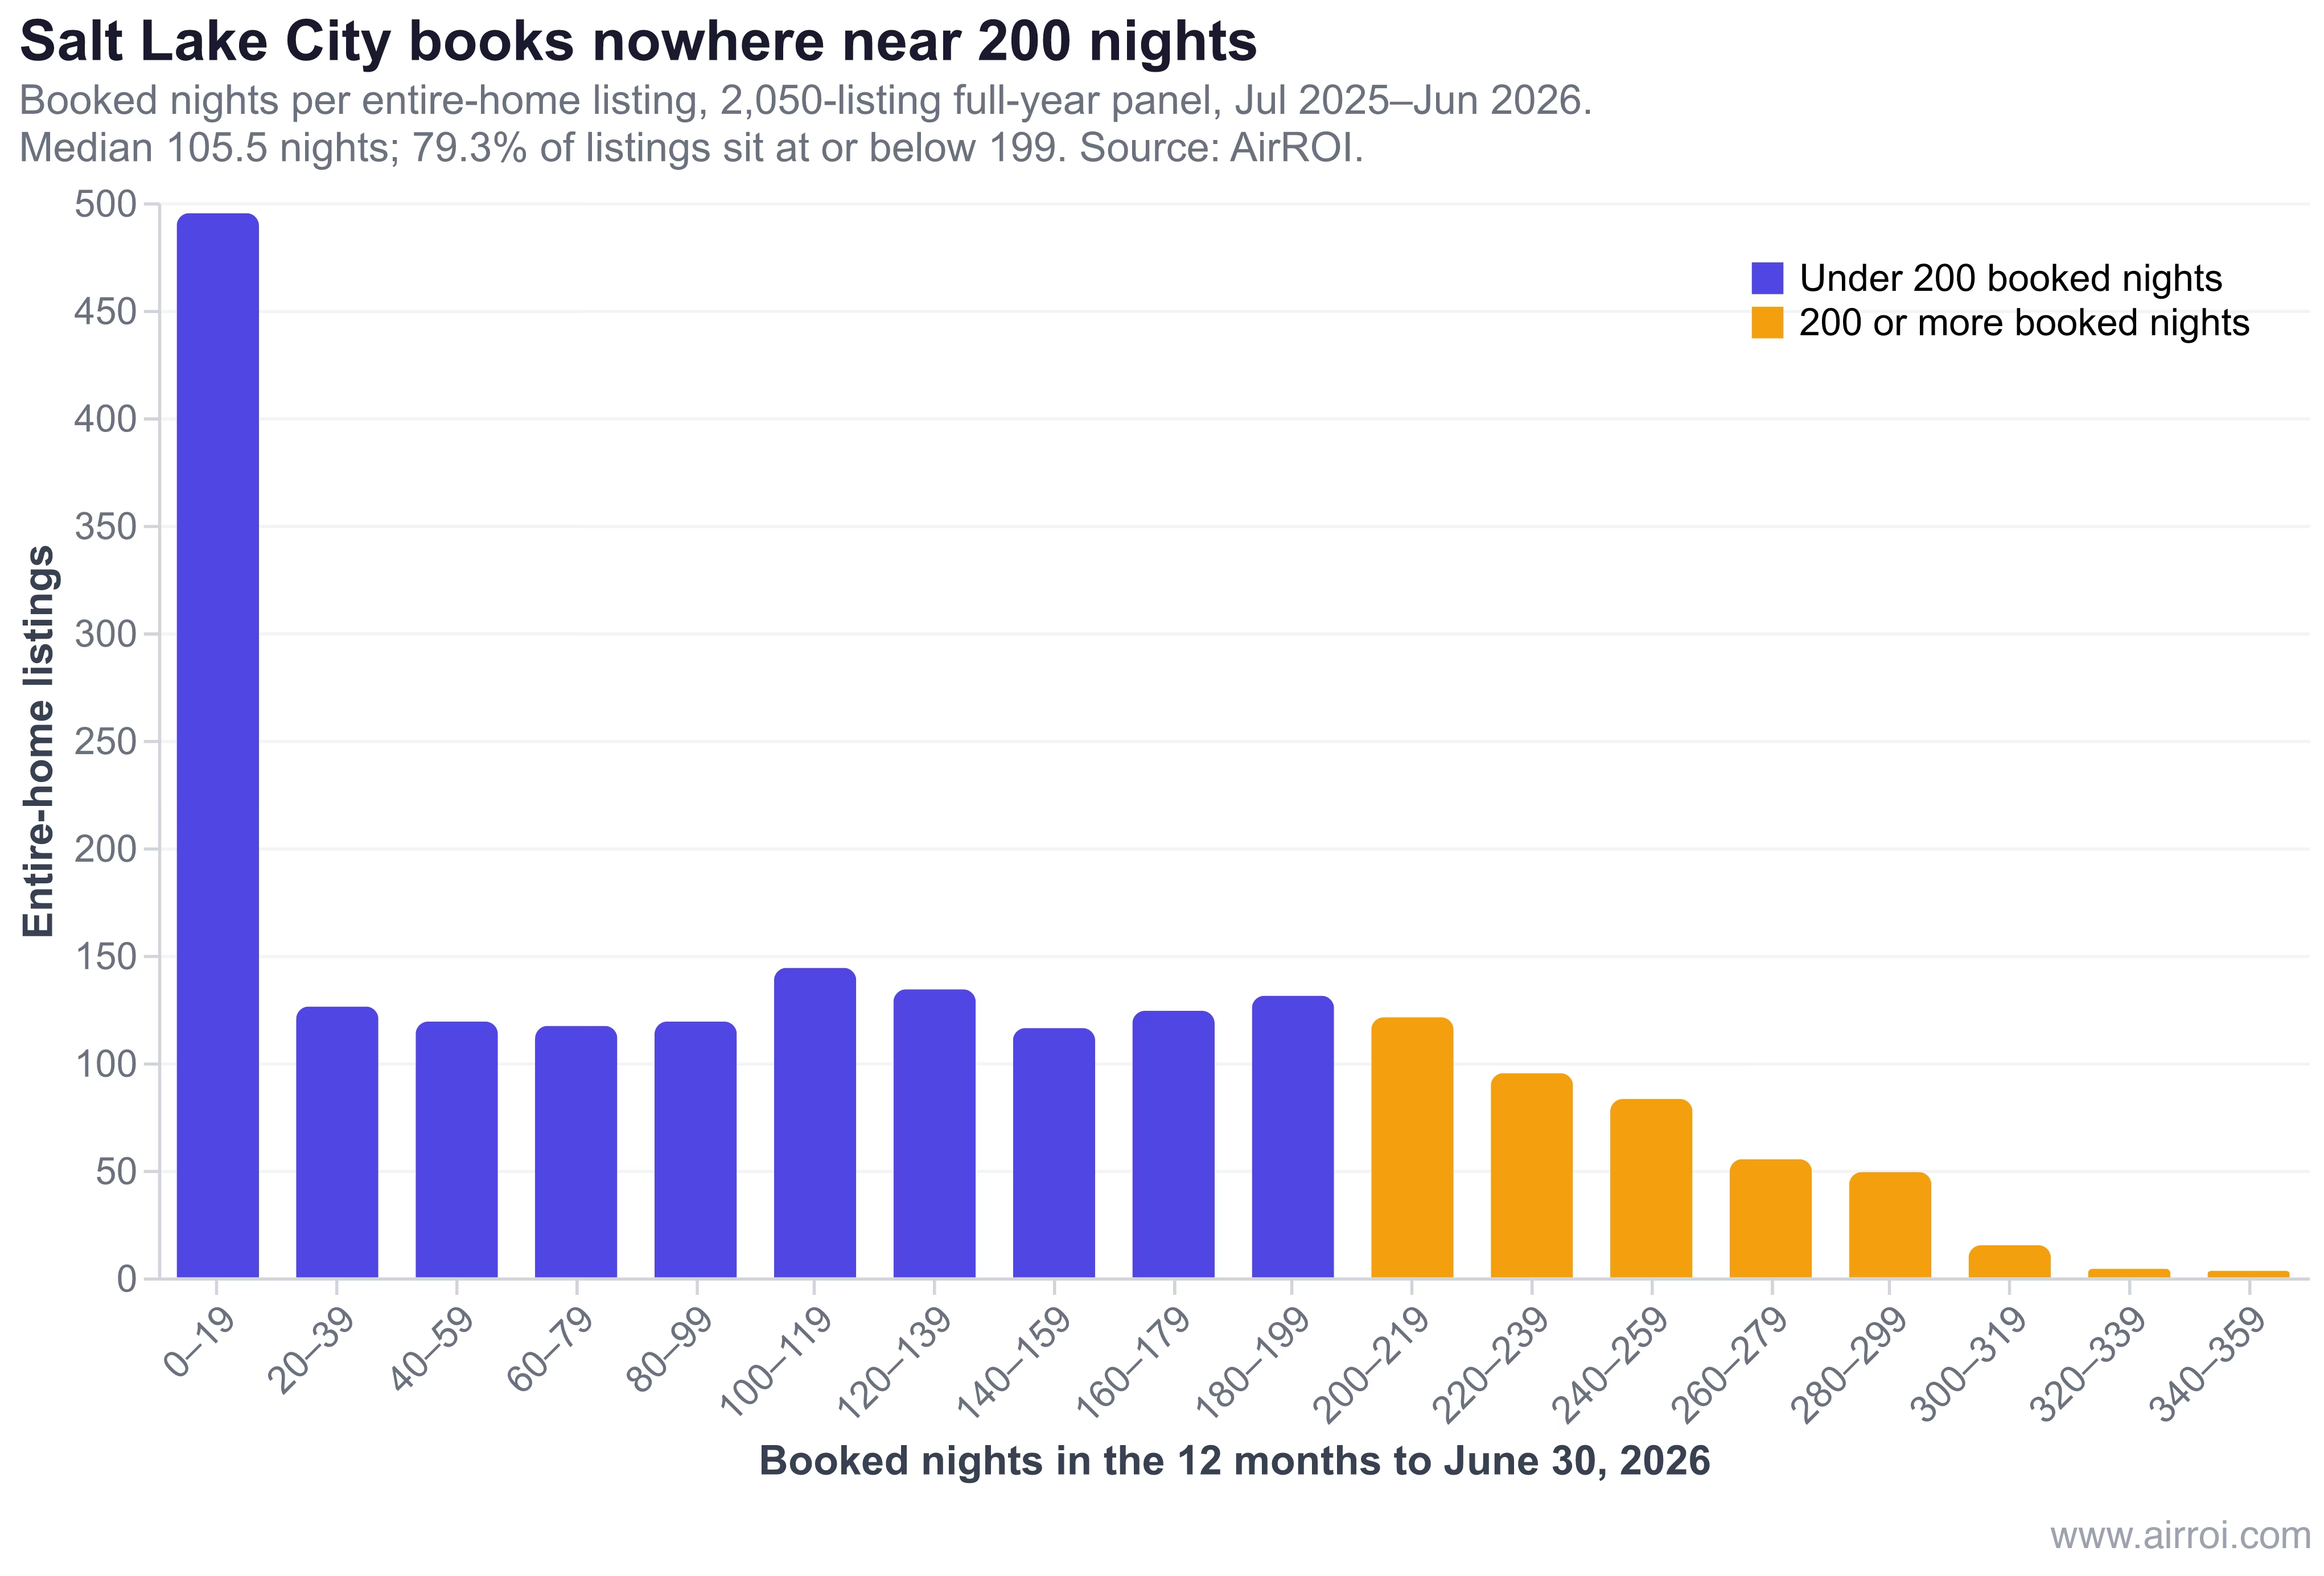
Two details keep that median honest. The panel includes 307 listings (15.0%) that booked zero nights; restricted to the 1,743 that booked at least once, the median rises to 127 booked nights and the share above 200 rises to 23.98%. Strip the never-booked listings out and the argument is unchanged — the working median still sits 73 nights below the cap. And a listing at exactly 200 is unaffected — the 418 count is strictly greater.
The cap reads as harsh because of arithmetic unrelated to the data:
"Max 200 nights a year is interesting. That's 54% occupancy rate. Really prevents a full time Airbnb no?" — one host on r/SaltLakeCity, the day the council action was reported (8 points)
Who pays, and what the escape would cost them
The 418 listings above 200 nights lose 19.06% of their own booked-night revenue in aggregate — $3,329,906 of $17,468,409 — if the cap bites in date order. Per listing, the median loss is 17.1%, or $6,344, on 40 forgone nights; the 90th percentile loses 32.7% ($16,510). There is an arithmetic escape, priced in the last column below: to hold revenue flat on 200 nights, the median affected host needs +20.6% on every retained night.
| Percentile of the 418 bound listings | Revenue lost | Dollars lost | Rate rise to hold revenue flat |
|---|---|---|---|
| p25 | 8.6% | $2,694 | +9.4% |
| p50 (median) | 17.1% | $6,344 | +20.6% |
| p75 | 26.3% | $11,093 | +35.6% |
| p90 | 32.7% | $16,510 | +48.7% |
That column is an accounting identity, not a forecast; it says nothing about whether demand would pay, and the rate data suggests it usually would not. Realized nightly rate falls as booked nights rise: $206.06 for listings booking 1–100 nights (n=678), $191.69 at 101–200 (n=647), $175.53 at 201–250 (n=251), $164.91 at 251–400 (n=167) — monotone across four bands, a 20.0% decline end to end. A 200-night cap binds the cheapest listings in the market, then asks the cohort with the least pricing power to do the most repricing. Read that as correlation rather than mechanism: part of it is size mix, with studios and one-bedrooms most exposed (22.9% of 814) and 4+ bedroom homes least (15.7% of 229).
What the cap number costs: 200 vs 120 vs 90 vs 30
Hold the market, the listings and the year fixed; move only the threshold. A 200-night cap reaches 7.85% of Salt Lake City's booked-night revenue. A 120-night cap reaches 31.65%. Ninety nights reaches 45.00%. Thirty nights reaches 79.19%. Halving 200 to 90 multiplies the revenue at risk 5.7× (45.00 ÷ 7.85) and lifts the share of listings bound from 20.4% to 55.0%.
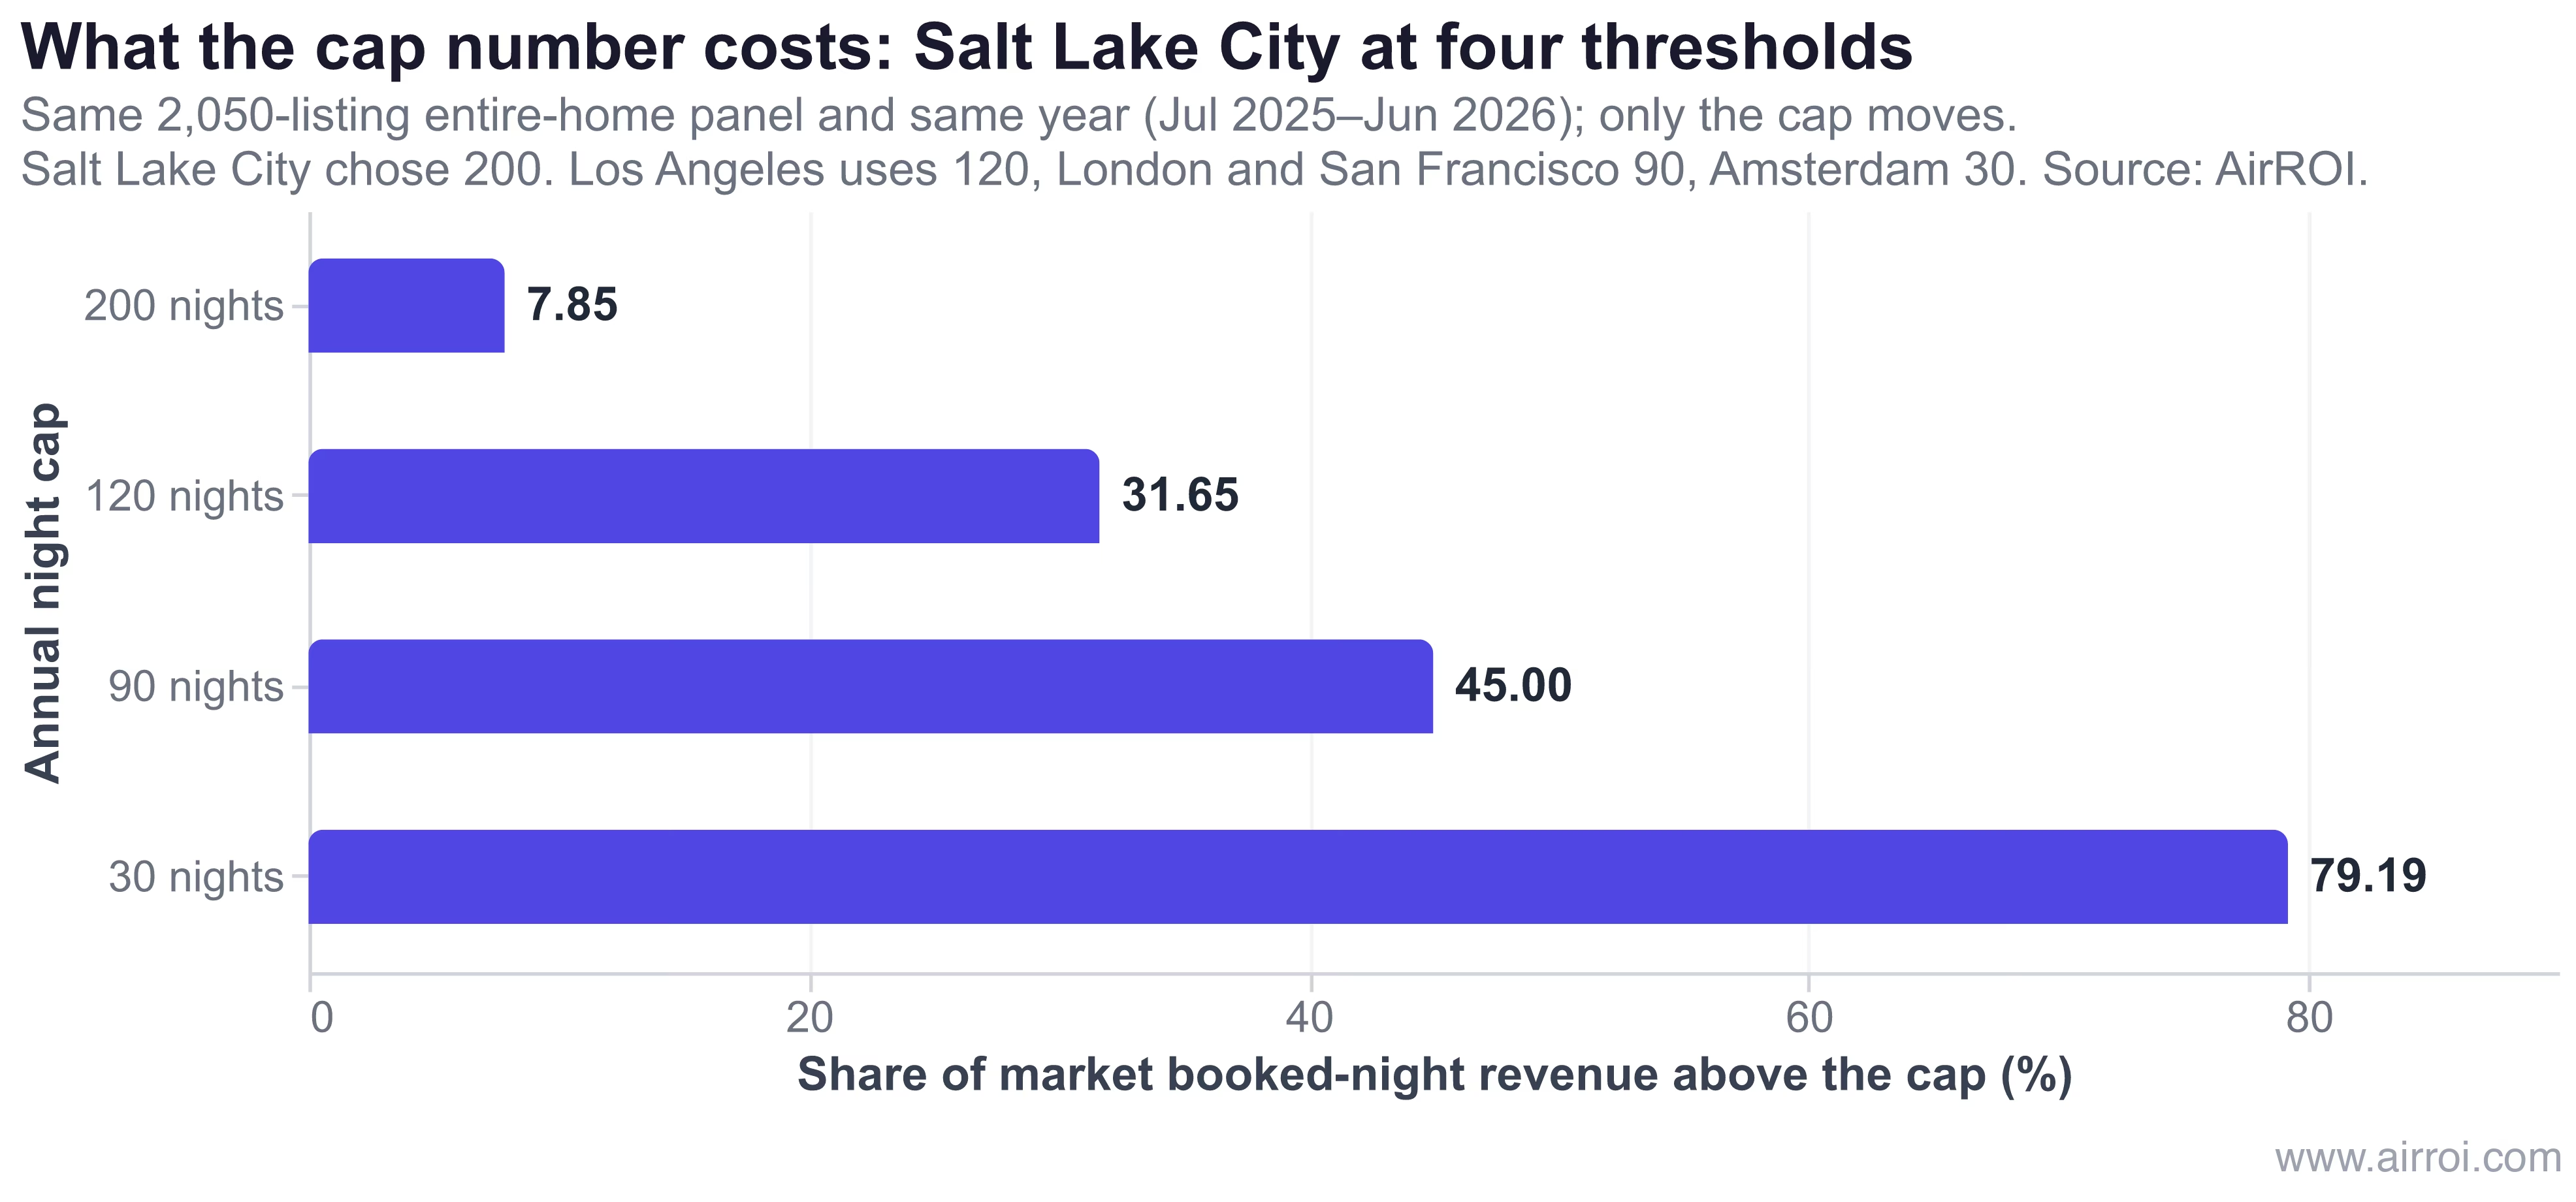
Per FOX 13, the two-night minimum was meant to discourage one-night party rentals, and the 200-night limit was meant to preserve homes primarily for residential use rather than allowing them to function as full-time lodging businesses. Against that second purpose, 200 is a weak lever: it leaves 92.15% of the market's booked-night revenue untouched and every listing under 200 nights exactly as it was. A threshold of 120 or below is where the ladder starts taking real money: 31.65%, four times the cost of 200. Whether pulling that revenue off short-term rental would return housing to residential use is an inference, not a measurement — the ladder prices the revenue at risk at each threshold and observes nothing about what hosts do next or what becomes of the units. The trade-off is still the kind a council should see before the vote.
The same 200 nights, fourteen markets, 24.5× apart
A uniform night number is not a uniform policy. Applying the identical 200-night threshold to fourteen markets — 162,000-plus entire-home listings, same method, same window — the share of booked-night revenue above night 200 runs from 0.55% in Park City, Utah to 13.49% in San Francisco, a 24.5× spread. Share of listings bound ranges 15-fold, 1.7% to 25.5%.
| Market | Panel listings | Median nights | Listings >200 | % listings | % revenue above 200 |
|---|---|---|---|---|---|
| San Francisco, CA | 4,002 | 68 | 862 | 21.5% | 13.49% |
| Paris, FR | 55,572 | 51 | 8,322 | 15.0% | 12.95% |
| San Diego, CA | 10,682 | 109 | 2,726 | 25.5% | 10.33% |
| Los Angeles, CA | 12,323 | 36 | 1,498 | 12.2% | 9.56% |
| Kissimmee, FL | 11,172 | 103 | 2,422 | 21.7% | 9.39% |
| London, GB | 33,986 | 36 | 3,780 | 11.1% | 8.69% |
| Salt Lake City, UT | 2,050 | 106 | 418 | 20.4% | 7.85% |
| Amsterdam, NL | 7,317 | 21 | 454 | 6.2% | 7.55% |
| Moab, UT | 1,021 | 141 | 242 | 23.7% | 6.82% |
| Austin, TX | 10,478 | 67 | 1,261 | 12.0% | 6.26% |
| Destin, FL | 4,624 | 64 | 394 | 8.5% | 4.94% |
| Nashville, TN | 3,249 | 83 | 321 | 9.9% | 4.74% |
| Nags Head, NC | 1,009 | 67 | 60 | 5.9% | 3.01% |
| Park City, UT | 5,022 | 39 | 84 | 1.7% | 0.55% |
The pattern is a market taxonomy. In seasonal alpine and coastal markets the season is already the cap — Park City, Nags Head and Destin barely register the rule — while year-round sun-belt urban markets are where it does work: San Diego binds a quarter of its listings. Moab is the instructive case. It carries the highest median booked nights of the fourteen at 141 and the second-highest share of listings bound at 23.7%, yet ranks ninth of fourteen on revenue above night 200 at 6.82%. A cap can catch a lot of listings and still take little, because what it removes is each listing's tail past its own 200th night, not the listing.
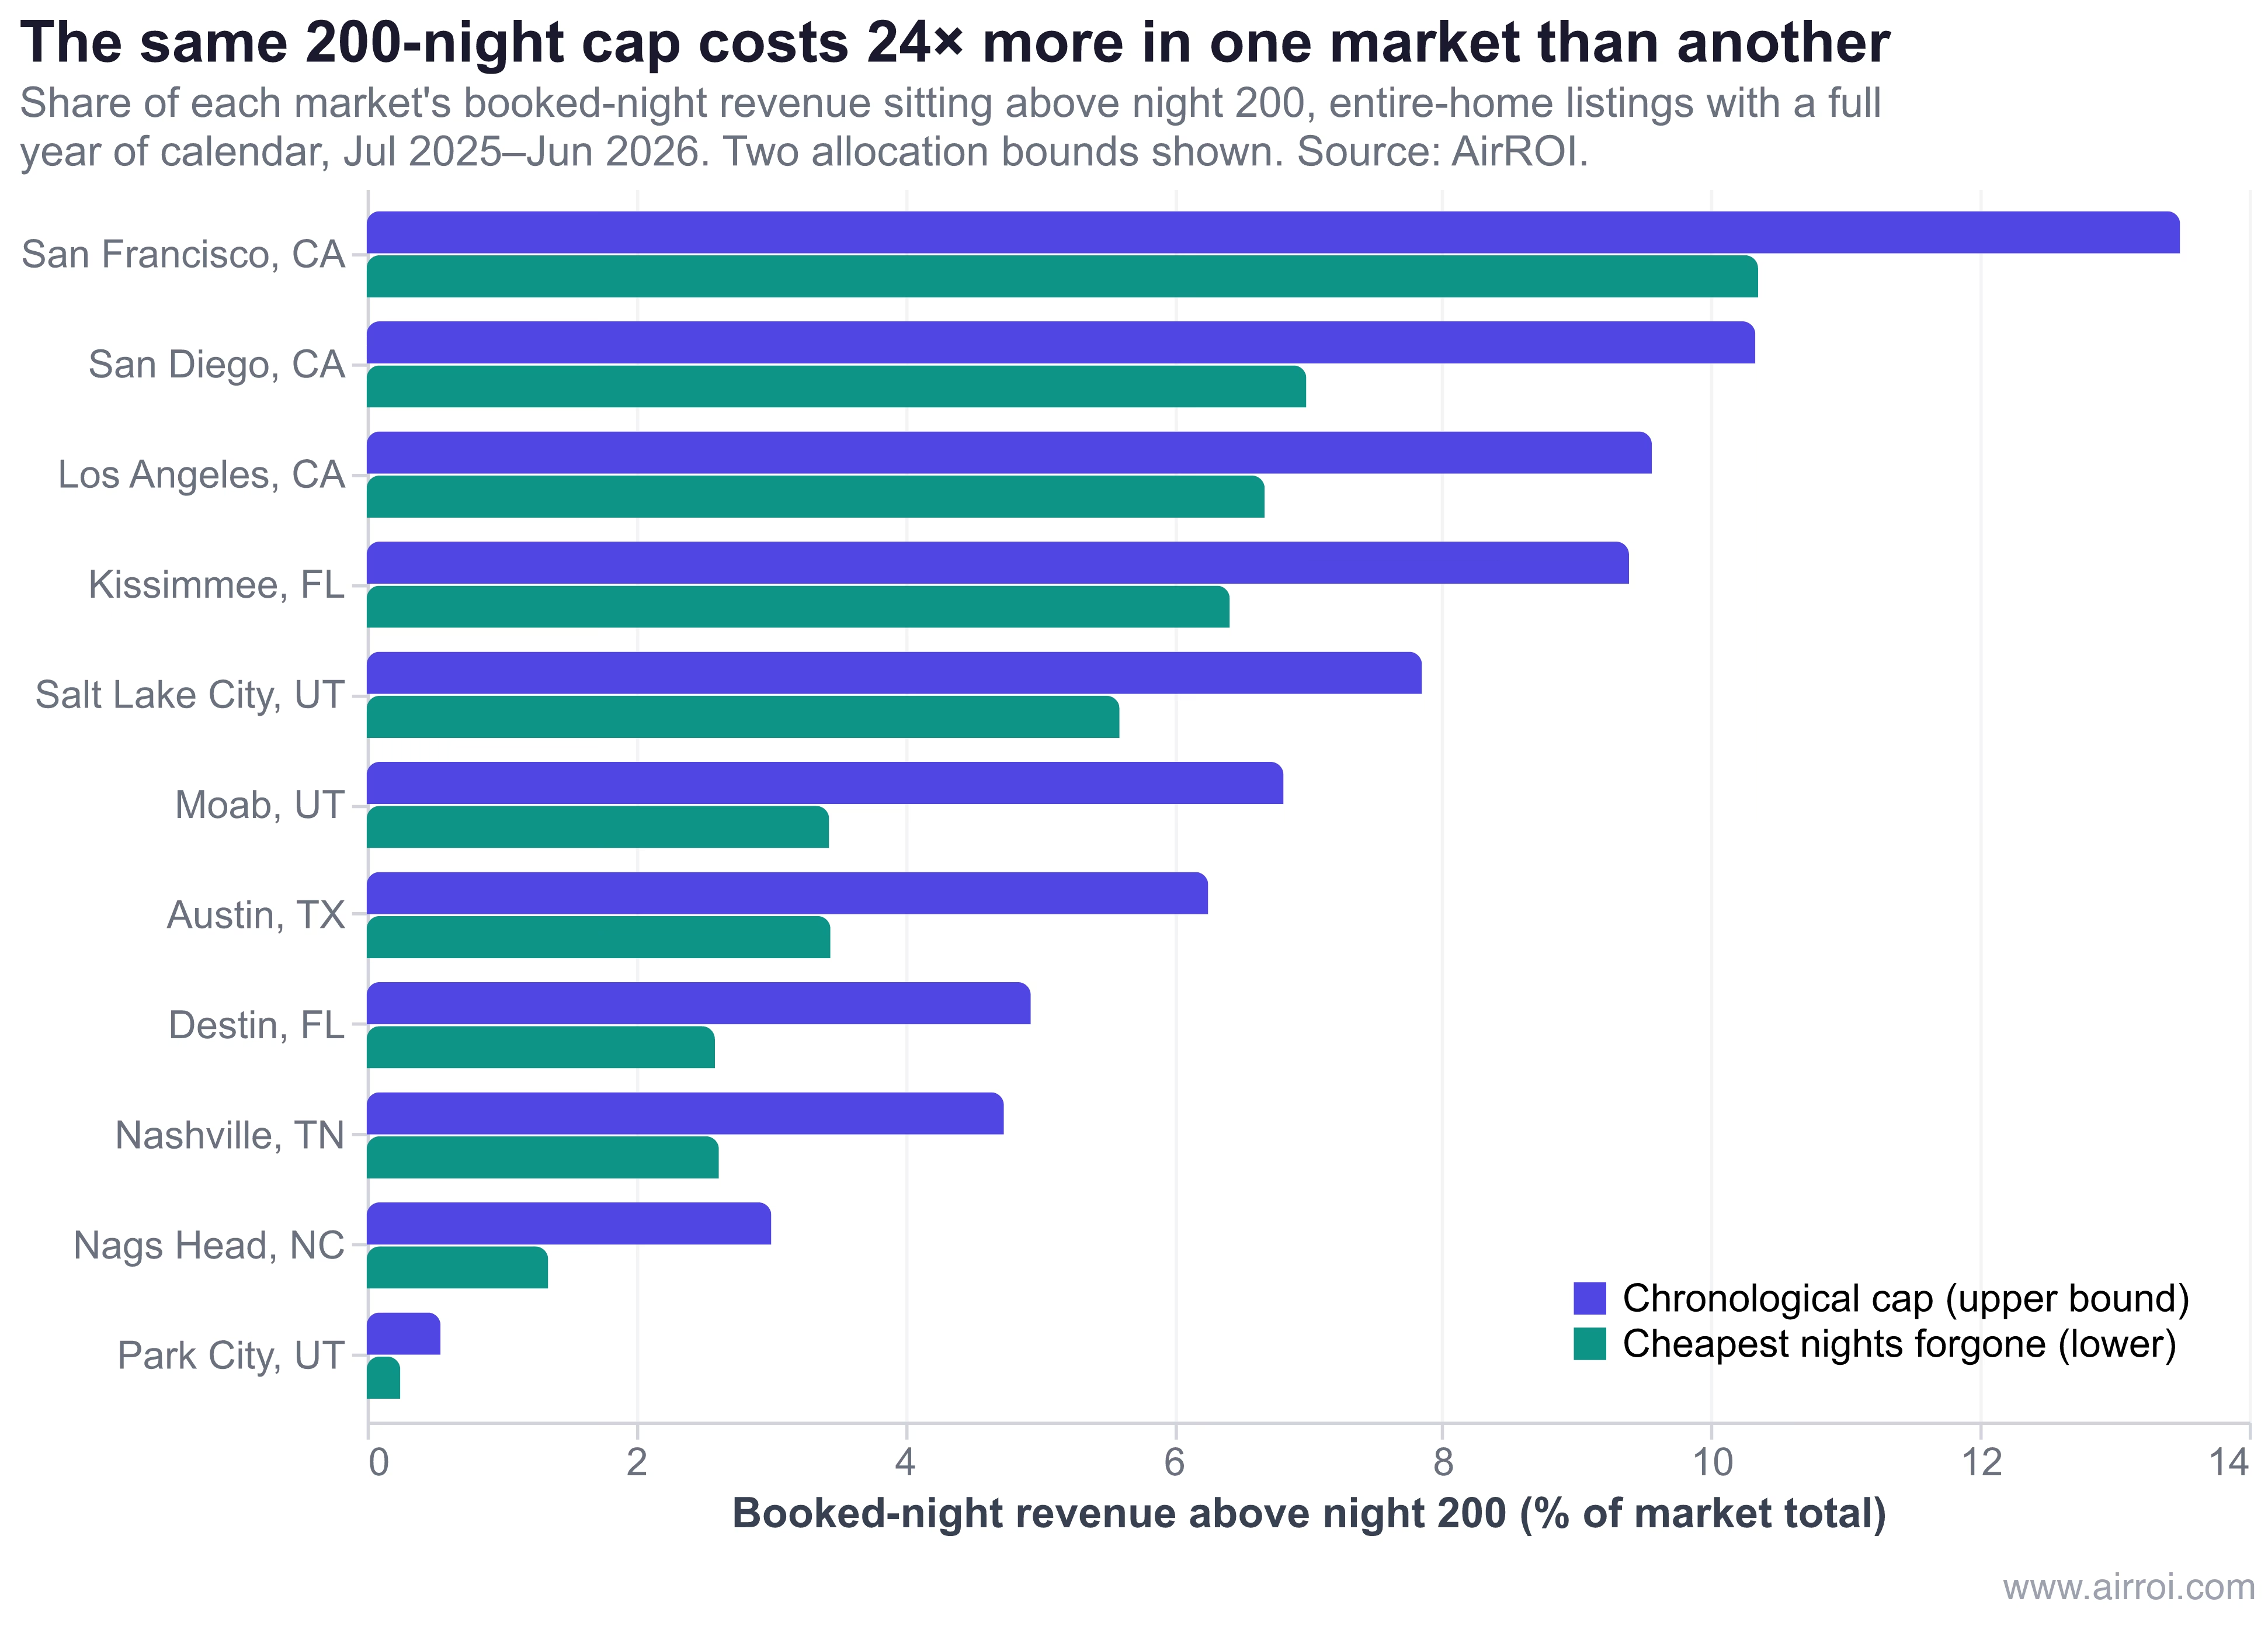
The second bar in that chart is the honest lower bound. "Revenue above night 200" assumes the cap bites chronologically: book until the 200th night, then stop. A host who can steer a calendar would drop the cheapest nights instead — rank the year's booked nights by rate, forgo the lowest (n − 200). On that basis Salt Lake City's exposure falls from 7.85% to 5.60%, and the gap between bounds is itself a finding. It is widest in the seasonal markets — Nags Head, 3.01% chronological against 1.35% cheapest-first (2.24×), and Park City, 0.55% against 0.25% (2.23×) — and narrowest in San Francisco, 13.49% against 10.35% (1.30×), with Salt Lake City near the narrow end at 1.40×. The ratio measures one thing: how much of a market's cap exposure sits in nights cheap enough to be the ones you drop. Reading it as the shape of a rate curve is interpretation — no per-market rate-dispersion statistic underlies it. Where the two bounds sit far apart, a night cap is a scheduling problem; where they converge, it is a revenue problem.
Christine Hammond, an operator in Orem — a different Utah city weighing its own, more restrictive rules — told FOX 13: "I don't see any need for regulating the number of days during the year that you're in operation." Across markets she has a point in a precise sense: the same 200 costs Park City 0.55% of booked-night revenue and San Diego 10.33%. Within one market it is not arbitrary at all — it is a choice with a price.
Caps already on the books cost far more than 200 does
By international standards Salt Lake City picked a permissive number. Measured against observed booked nights in the twelve months to June 2026, at each city's own statutory threshold:
| City | Statutory cap | Listings above it | % of panel | % of booked-night revenue above cap |
|---|---|---|---|---|
| Amsterdam | 30 nights/calendar year | 3,278 of 7,317 | 44.8% | 69.9% |
| San Francisco | 90 un-hosted nights/calendar year | 1,753 of 4,002 | 43.8% | 47.8% |
| London | 90 nights/calendar year | 10,666 of 33,986 | 31.4% | 38.6% |
| Los Angeles | 120 days/calendar year | 3,172 of 12,323 | 25.7% | 30.5% |
| Salt Lake City | 200 nights/calendar year | 418 of 2,050 | 20.4% | 7.85% |
These are not compliance rates. Los Angeles allows operation above 120 days with an Extended Home-Sharing registration, and in San Francisco and London hosted nights are uncapped, under Administrative Code Chapter 41A and the Deregulation Act 2015 respectively. Amsterdam's citywide 30 nights, reported by Dutch public broadcaster NOS alongside a cut to fifteen nights in Centrum and De Pijp, is not modelled at district level here. The last column measures how much observed activity each threshold sits above, not the volume of illegality. Against that set, Salt Lake City's 200 is closer to a registration regime with a ceiling attached than to a housing intervention.
Zoning binds; the cap barely does
The rule deciding who operates a short-term rental in Salt Lake City is the zoning map, not the night cap. Licenses exist only in the districts the city lists (MU2, MU3, MU5, MU6, MU8, MU11, M1, M1-A, D1–D4, GMU, RP, BP, A and JRF), which excludes residential zones. Testing all 2,050 panel listings' coordinates against those districts' polygons from the city's own zoning layer, 541 (26.4%) sit inside an eligible district; since platform coordinates are approximate, a sensitivity test that offsets every point ±150 metres in latitude, longitude or both — an eight-point grid whose diagonal corners land 212 metres out — and counts any hit as eligible raises that to 51.9%. The defensible claim is the range — between a quarter and half of existing entire-home listings sit where a license is possible, so roughly half to three-quarters do not, at any night count.
Eligible-district listings hold 32.0% of the panel's trailing-twelve-month revenue and run higher occupancy than those outside (median 134 booked nights vs 94), so the cap bites slightly harder on the cohort that can be licensed: 24.2% of them exceed 200 nights, against 19.0% outside. The order of operations for a host is zoning first, license availability second — as of this writing the city's page says short-term rental applications "are not currently being processed" and asks applicants to check back after August 8, 2026, without saying what happens then — and the night cap a distant third. Most Salt Lake City listings never reach question three.
The cheaper quantity rule is the two-night minimum
Salt Lake City's ordinance contains two rules limiting quantity, and the smaller-sounding one reaches more of the market. Reconstructing 57,698 reservations from the panel's daily calendars, one-night stays are 22.1% of reservations but only 5.55% of booked nights and 5.25% of booked-night revenue ($2,223,928). A two-night minimum touches more than one booking in five and about one night in twenty — and demands nothing of most operators: 1,552 of the 2,032 panel listings whose minimum-stay setting we could read (76.4%) already require two nights or more, leaving 480 at one.
How we measured this
Sample and window. Salt Lake City figures come from 2,050 entire-home listings with twelve full months of calendar, from AirROI's listing-level rate-and-calendar snapshot dated 2026-06-30 (pulled 2026-07-30). Listings with less than a year of calendar are excluded — an annual cap is unanswerable for them. Booked nights are counted over the 365 days from 2025-07-01 to 2026-06-30. Cross-market figures apply the identical filter per city partition. Validation: day-level booked flags across all 3,844 Salt Lake City listings sum to 250,246 booked nights, exactly matching AirROI's trailing-twelve-month column.
Computation and dollar basis. Booked nights are ranked chronologically per listing; "revenue above night 200" sums the nightly rates on nights ranked above 200. The cheapest-first variant ranks the same nights by rate and forgoes the lowest (n − 200). All dollar figures are booked-night (nightly-rate) revenue, not host payouts — that base is 91.0% of AirROI's revenue column here, the difference being fees; percentages use the same base top and bottom, so they are unaffected. Percentiles quoted in prose are exact linear-interpolation percentiles over the per-listing vector; the median, p75 and p90 columns of the fourteen-market table are approximate-percentile estimates from our query engine, which is why Salt Lake City reads 106 there and 105.5 here — and why the booked-at-least-once median is 127 exact against 128 approximate. Three counts of "Salt Lake City listings" coexist and are not interchangeable: our 2,050-listing panel, AirROI's public-API active-listing count of 1,835.8, and the city's estimate of about 1,600 operating (FOX 13).
Window sensitivity — read before quoting the headline. The cap is stated per calendar year; our primary window is trailing twelve months. Run the identical computation on calendar 2025 from the December 2025 snapshot and the cap bites harder: 602 of 1,970 listings bound — 30.56%, half again the 20.39% in the primary window (30.56 ÷ 20.39 = 1.50) — and 11.49% of booked-night revenue at risk, 46% larger than 7.85% (11.49 ÷ 7.85 = 1.46). That is the finding, not a defect: a cap's cost is demand-state-dependent. Demand softened over the period, the public API's occupancy series falling 0.588 → 0.505 (−8.3pp) between H1 2025 and H1 2026 on supply that rose 1.7%. This is not a snapshot artifact — the two snapshots report the overlapping months July–December 2025 within 0.76% of each other.
Zoning. Eligibility is a point-in-polygon test (even-odd ray casting, hole exclusion) of listing coordinates against the 1,296 approved-district polygons in Salt Lake City's own ArcGIS zoning layer. Coordinates are obfuscated by design, hence the 26.4%–51.9% band: the lower bound tests each listing where the platform puts it, the upper bound counts a listing eligible if any point of a ±150 m latitude/longitude offset grid around it lands in an approved district.
Not modelled. This is a static accounting of nights already booked. Hosts facing a cap will reprice, shift toward stays of 30 nights or more outside the ordinance's scope, sell, or exit; none of that is forecast, and the required-uplift column is arithmetic rather than an elasticity estimate. On sourcing: the cap, minimum stay, zoning list and density rule come from the city's licensing page; the July 1 effective date from local news coverage.
What the number is for
A night cap is the compromise instrument in short-term rental policy — more than a registration form, less than a ban — and its price is almost entirely a function of where a market's booked-night distribution already sits. That makes the choice of number, not the choice to have one, the decision that matters. Salt Lake City's 200 leaves 92% of its market's revenue in place; Amsterdam's 30 sits above 69.9% of its market's. Same label, different policies.
For a host, the headline number means nothing until you locate yourself in the distribution. Book 130 nights and the cap is paperwork; book 260 and you are in the fifth of the market that loses a median 17.1% of revenue, $6,344, which a 20.6% rate rise would have to recover from the part of the market where rates are already lowest. For anyone underwriting in a city that might adopt a cap, the question to model is not what the cap is but what share of projected revenue sits above night 200 — and whether those nights can be moved rather than lost.
The awkward part of the Salt Lake City record is not that staff could not produce the research. It is that the research was cheap — a cap ladder for one's own market is a single computation over data that already exists — and the version above shows a 200-night cap leaving the market it regulates almost intact: 92% of booked-night revenue and four listings in five, untouched. The instrument already sorting this market is the zoning map, which settles who may hold a licence before a single night is booked. Whether either one produces housing is past what a revenue ladder or a point-in-polygon test can measure; which one binds is not. When the amendments come back, that is the number worth arguing about.
Frequently Asked Questions
Salt Lake City requires a business license for any short-term rental in an approved zoning district, caps each licensed rental at 200 rental nights per calendar year, and requires stays of at least two consecutive nights (slc.gov). Licenses exist only in listed mixed-use, downtown and manufacturing districts, not residential zones. The ordinance took effect July 1, 2026 (FOX 13); as of this writing the city says short-term rental applications are not currently being processed and asks applicants to check back after August 8, 2026.
There is no platform-wide limit — the number is set by your city, not by Airbnb. The caps we sourced for this piece run from 30 to 200 nights: Amsterdam 30 citywide (NOS reports 15 in Centrum and De Pijp from 2026), London 90 without planning permission, San Francisco 90 un-hosted nights, Los Angeles 120 days absent an Extended Home-Sharing registration, Salt Lake City 200. And the annual number is not always the binding rule: in Salt Lake City, zoning eligibility excludes a larger share of existing listings than the cap reaches.
For most listings, no. In Salt Lake City, 79.3% of entire-home listings booked 199 nights or fewer in the year to June 2026, so a 200-night cap never reaches them, and market-wide it touches 5.60%–7.85% of booked-night revenue. Where it binds it bites: the 418 affected listings lose a median 17.1% of revenue.
No. 200 of 365 nights is 54.8% of the calendar, which is why hosts read the cap as an occupancy ceiling, but occupancy is measured against bookable nights and most listings are far below 200 booked nights anyway. Salt Lake City ran 51% occupancy on a trailing-twelve-month basis.