
Airbnb 15.5% Host Fee: Why +18.3% Is the Wrong Reprice

Two numbers decide what the Airbnb 15.5% host fee costs you in September 2026, and almost every guide circulating right now gets the second one wrong. The first: doing nothing drops your payout 12.9% in every market on earth, because the fee applies whether or not you touch your prices. The second: the +18.3% reprice the internet keeps quoting is not payout-neutral — it holds your gross list price flat, and since split-fee hosts were already paying roughly 3%, the genuinely payout-neutral figure is 0.97 ÷ 0.845 = +14.8%. That 3.5-point gap is a discretionary price increase wearing a defensive costume.
The deadline is September 15, 2026 outside the European Economic Area and October 13, 2026 inside it and in Switzerland. So how much should you raise your Airbnb price for the 15.5% fee? This article answers that with arithmetic traced to Airbnb's own documentation, then tests whether the surplus survives contact with demand across AirROI's analysis of 33,341 entire-home listings in 12 US markets. Short version: reprice everywhere, but size the increase to your market.
The Airbnb Single Service Fee Deadline 2026: Who Is Still in the Final Wave
Read that phrasing carefully. It is a deadline to adjust your prices, not a deadline to opt in. The fee switch happens regardless; the only thing in your control is whether your rate moves with it.
| Date | Who switched | What changed |
|---|---|---|
| Late 2025 | Some hosts using property management or channel management software | First cohort moved from the split fee to the single fee |
| April 13, 2026 | All remaining PMS and channel-manager-connected hosts, worldwide | Split fee retired for the software-connected cohort |
| May 25, 2026 | Hosts in Peru and South Korea | Country-level cutover |
| June 22, 2026 | Hosts in Germany and the UK | Country-level cutover |
| September 15, 2026 | Everyone else outside the EEA — self-managed, non-PMS hosts | Deadline to adjust prices |
| October 13, 2026 | Hosts in the EEA and Switzerland | Deadline to adjust prices |
What inaction actually costs
Airbnb publishes the consequence in plain numbers: "if you keep your price at $100, you'll earn $84.50 after the 15.5% fee is deducted and guests will see $100." Against the old payout of $97, that is a 12.9% cut. For the median Charleston listing in AirROI's sample, inaction costs about $7,595 a year; for the median San Antonio listing, about $2,930. There is no opt-out and no grandfathering.
Airbnb's price adjustment tool is opt-in, one-time and one-way — once hosts use it, Airbnb states, "they won't be able to revert back to the split-fee structure." It freezes calendar pricing during the change, adjusts two years of forward rates including cleaning and pet fees, excludes discounts, and co-hosts cannot run it.
One more honest caveat before the arithmetic: 15.5% is not universal. Airbnb's wording is that "most hosts pay 15.5%, remaining hosts typically pay 14%–16%," listings in Brazil and Mexico stay at 16%, and the fee is VAT-inclusive where VAT applies — so an EU host's gross-up ratio is not a flat 1.183.
The Repricing Math Almost Everyone Gets Slightly Wrong
Payout-neutral is +14.8%, not +18.3%. The division is correct; the target being divided is wrong. 1 ÷ 0.845 = 1.1834 holds your old list price constant — but you never netted your list price. You netted 97% of it, because the split fee took roughly 3% from the host side before the guest's 14.1%–16.5% was added on top. The number that holds your payout constant is 0.97 ÷ 0.845 = 1.148.
Here is what each choice does on a $300 nightly rate with a $175 cleaning fee — a $475 booking subtotal, which is the base the fee is charged on.
| Approach | New nightly rate | Host payout | Δ vs. old payout | Guest all-in Δ |
|---|---|---|---|---|
| Do nothing | $300.00 | $401.38 | −12.9% | −12.4% |
Payout-neutral (÷ 0.845 × 0.97, +14.8%) | $344.38 | $460.75 | 0.00% | +0.6% |
| "Naive" +15.5% | $346.50 | $463.59 | +0.62% | +1.2% |
Standard advice (÷ 0.845, +18.3%) | $354.90 | $474.83 | +3.06% | +3.7% |
Old payout baseline: $475 subtotal × 0.97 = $460.75. Source: AirROI calculation from Airbnb's published fee rates.
The counter-twist nobody mentions
The "naive" +15.5% that every repricing guide warns you against overshoots payout-neutral by 0.62%. It is, from the correct baseline, almost exactly right. Meanwhile the sophisticated-sounding +18.3% raises your payout 3.06% above where it was. That is a fine decision — it is simply a price increase, and it should be made as one.
Airbnb's own worked example is the +15% version: "if you adjust your price from $100 to $115, you'll still earn $97 and guests will still see $115." Airbnb never publishes an 18.34% figure anywhere. That number is a host-community construction, and the search results are split roughly 50/50 between the two camps without either stating what separates them.
The best practitioner explanation came from a host doing the arithmetic out loud in a repricing thread:
"The increase of 18.34% will just get you back to the original amount not including the 3% Fee. Example: $2,500 TOTAL Booking = $2,425 Payout after 3% Fee. 18.34% Increase = ($2,500 × 1.1834) × 0.845 = $2,499.93 Payout."
— u/13times5plus4 [11 points], r/airbnb_hosts
old_rate × (1 − your_old_host_fee) ÷ 0.845. See what Airbnb charges hosts for the full fee stack.The cleaning fee is where hosts genuinely lose money
The booking subtotal — the base the fee applies to — is your nightly price plus any fee you add: cleaning, pet, extra guest. Taxes are excluded. Under the split model the host paid 3% of that; now the host pays 15.5% of all of it.
| Cleaning fee | Old host-side fee (3%) | New fee (15.5%) | Added host cost | Grossed up (÷ 0.845) |
|---|---|---|---|---|
| $100 — Tulsa median | $3.00 | $15.50 | +$12.50 | $118.34 |
| $200 | $6.00 | $31.00 | +$25.00 | $236.69 |
| $303 — Palm Springs median | $9.09 | $46.97 | +$37.88 | $358.58 |
| $400 | $12.00 | $62.00 | +$50.00 | $473.37 |
Your Guest Will Barely Notice: The Airbnb Host Fee 15.5 Percent Explained From the Guest's Side
At payout-neutral, the guest's all-in price changes +0.6%. Even a full +18.3% reprice moves it +3.7%. And if you do nothing, your listing becomes 12.4% cheaper to the guest while you absorb the entire cut. No guest anywhere faces an 18.3% increase, because the guest service fee they were already paying — 14.1% to 16.5% of the booking subtotal — disappears from the total at the same moment your list price rises.
This is the finding that dismantles the dominant host strategy. The most-upvoted piece of advice in the host community is to delay: "Not going to touch that button until forced to do so," at 100 points. The thread's original poster, who moved early, described the fear precisely:
"Most hosts around me are probably waiting until September 15th to make the switch, and I got a little too eager and did it early. Now I'm taking the hit until everyone switches over."
— u/Exotic_Forever740 [21 points], in an r/airbnb_hosts thread with 189 comments
So a not-yet-migrated listing with a $100 base already shows about $114.50 in the search grid. A migrated listing repriced to payout-neutral shows $114.79. Those are the same number. Repricing early is display- and ranking-neutral; the delay strategy forfeits weeks of correctly priced bookings and buys nothing.
The real competitive threat is inverted
It is not un-migrated neighbours. It is migrated-but-un-repriced listings, which suddenly display roughly 13% cheaper and undercut you whether or not you delayed. A guest shopping through the transition described exactly that:
"Some places adjusted for the change, some didn't. The ones that did not change are now a better value than the ones that adjusted for the change."
— u/Its-a-write-off [6 points], r/airbnb_hosts
One honest caveat: Google Hotel Center's documentation confirms that in the US and Canada, Google highlights the base rate more prominently than the total. Display neutrality applies to Airbnb's own surfaces, not to every referral path.
This Is a Price Salience Question, Not a Price Shock
Use that number rather than the more widely quoted +20.6% revenue figure from the same paper. That arm randomized by user, so treated shoppers browsed a marketplace with inconsistent-looking prices. Airbnb's migration is platform-wide and simultaneous, which preserves relative rankings — the event-level result is the honest analogue.
Price salience — how visible a cost is at the moment of choice — has a transfer coefficient too. Chetty, Looney and Kroft, in the American Economic Review, found θ ≈ 0.35: a 10% tax increase reduces demand by the same amount as a 3.5% sticker-price increase. And "guests will get used to it" is empirically false — Blake and co-authors found experienced users, who should anticipate the fee, still spend 15% more when it is hidden.
Except the salience shift already happened
Here is the nuance that defuses the panic. Blake's paper classifies Airbnb as a back-end-fee drip-pricer as of 2018. Drip pricing — revealing mandatory costs progressively through checkout rather than upfront — is what Airbnb spent the following seven years dismantling.
| Date | What changed |
|---|---|
| November 2022 | Total price display launches; search ranking switches to total price |
| April 21, 2025 | Total-price display becomes the global standard; the toggle is removed |
| May 12, 2025 | FTC Junk Fees Rule takes effect |
| September 15 / October 13, 2026 | The fee moves from the guest's ledger to the host's |
Hosts do respond to display changes when they happen. After total price display launched, Airbnb reports that "over 300,000 listings lowered or eliminated their cleaning fees, and nearly 40% of active listings charge no cleaning fee at all."
One caution on framing. Airbnb's Q1 2026 shareholder letter tells investors the change is monetization-positive:
"improvements to monetization through a simplified fee structure and our insurance programs, which are expected to lift our full-year take rate."
— Airbnb Q1 2026 Shareholder Letter
Read that fairly. Airbnb's blended take rate has been flat at 13.4–13.6% for three years (13.54% in FY2023, 13.57% in FY2024, 13.41% in FY2025), and on the nightly rate the platform take is roughly unchanged under the new structure. Where the rake genuinely rises is on host-added fees, which went from a 3% host-side charge to 15.5%.
Airbnb Price Elasticity by Market: Can Yours Take the Extra 3%?
It depends on how tightly your market's prices cluster, and the spread across twelve markets is nearly 2:1. AirROI analysed 33,341 entire-home listings, 1–4 bedrooms, over the trailing twelve months to June 2026, drawn from AirROI's June 30, 2026 data snapshot. Only listings with verified county-level geocoding are included, for reasons explained below. Every listing is ranked by ADR percentile — where its average daily rate sits in its market's price distribution — computed within city and bedroom count, so rank measures price position against comparable inventory rather than property size.
Price crowding: the same percentage is a different move in every market
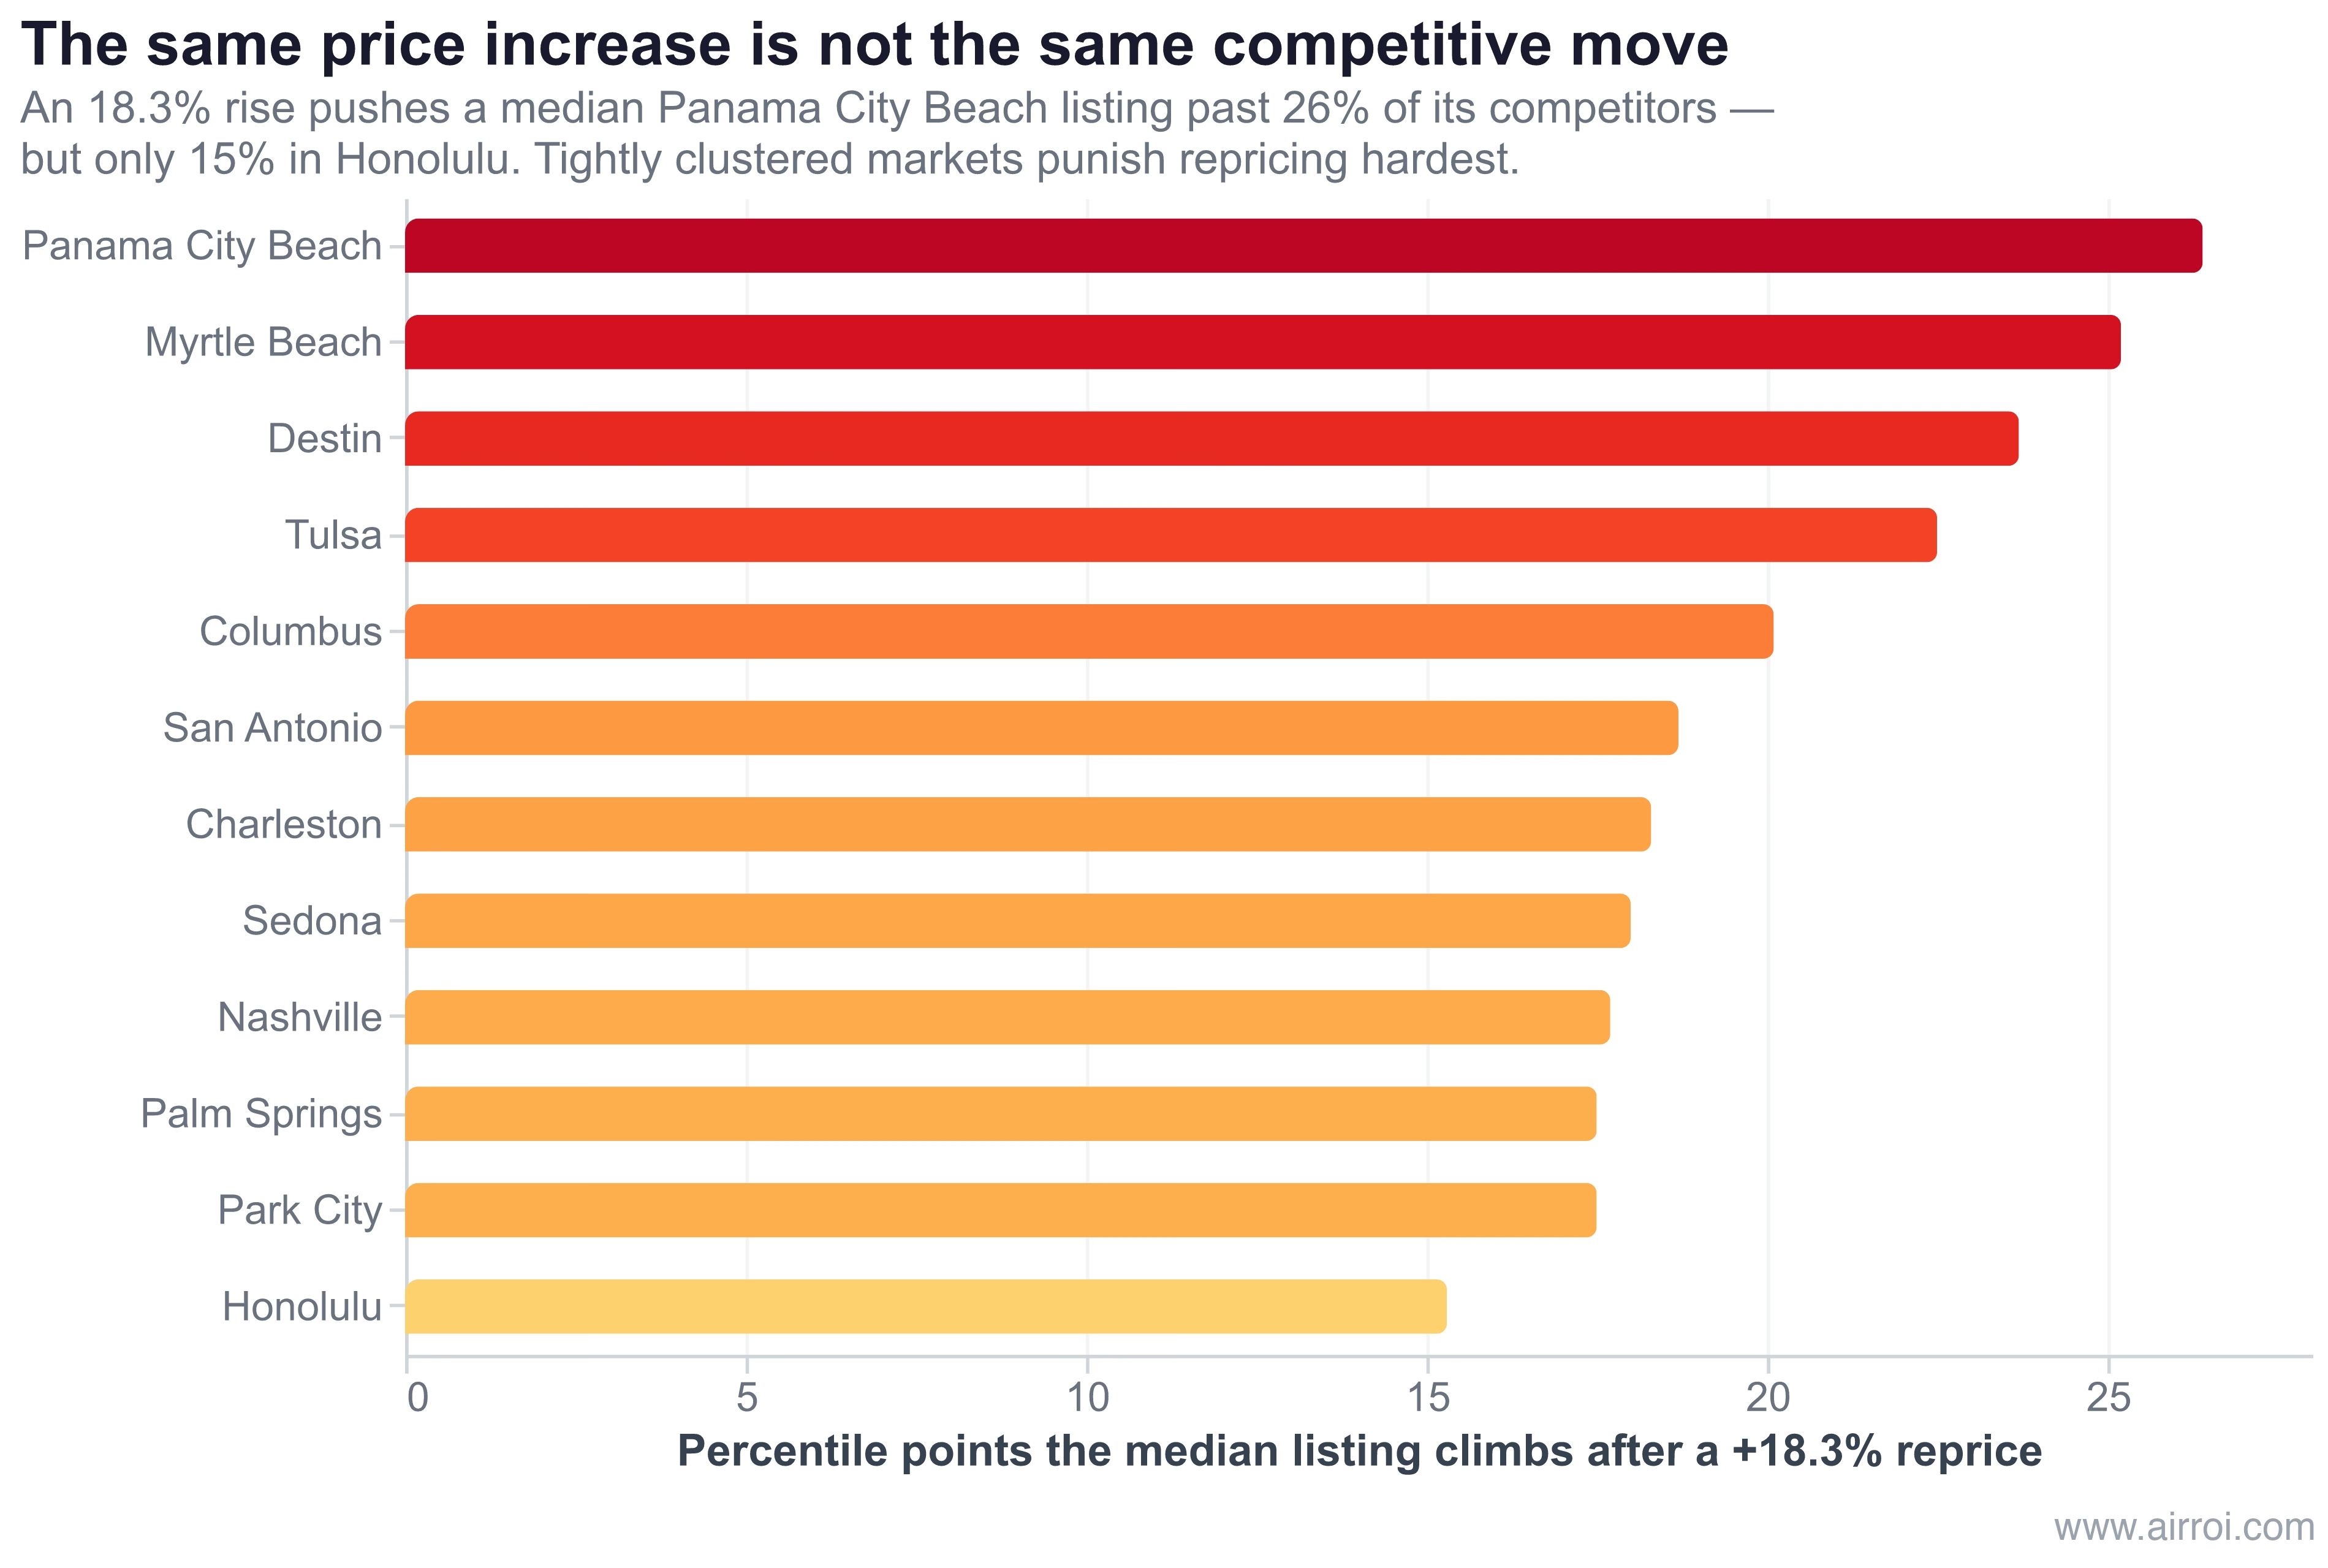
A +18.3% reprice pushes a median Panama City Beach listing past 26.4% of its competitors. The same increase moves a median Honolulu listing only 15.3 percentile points. The reason is dispersion: Panama City Beach's listings are packed into a $248–$387 interquartile range, a ratio of 1.56, while Charleston's spread across $213–$522, a ratio of 2.45. Density, not price level, decides what a reprice costs.
The occupancy gradient, and why it is a floor
The occupancy gradient measures occupancy points gained or lost per 10 ADR-percentile points of price position. Columbus is the steepest in the sample at −1.89 points; Nashville is a nearly flat −0.12; Destin reads +0.52.
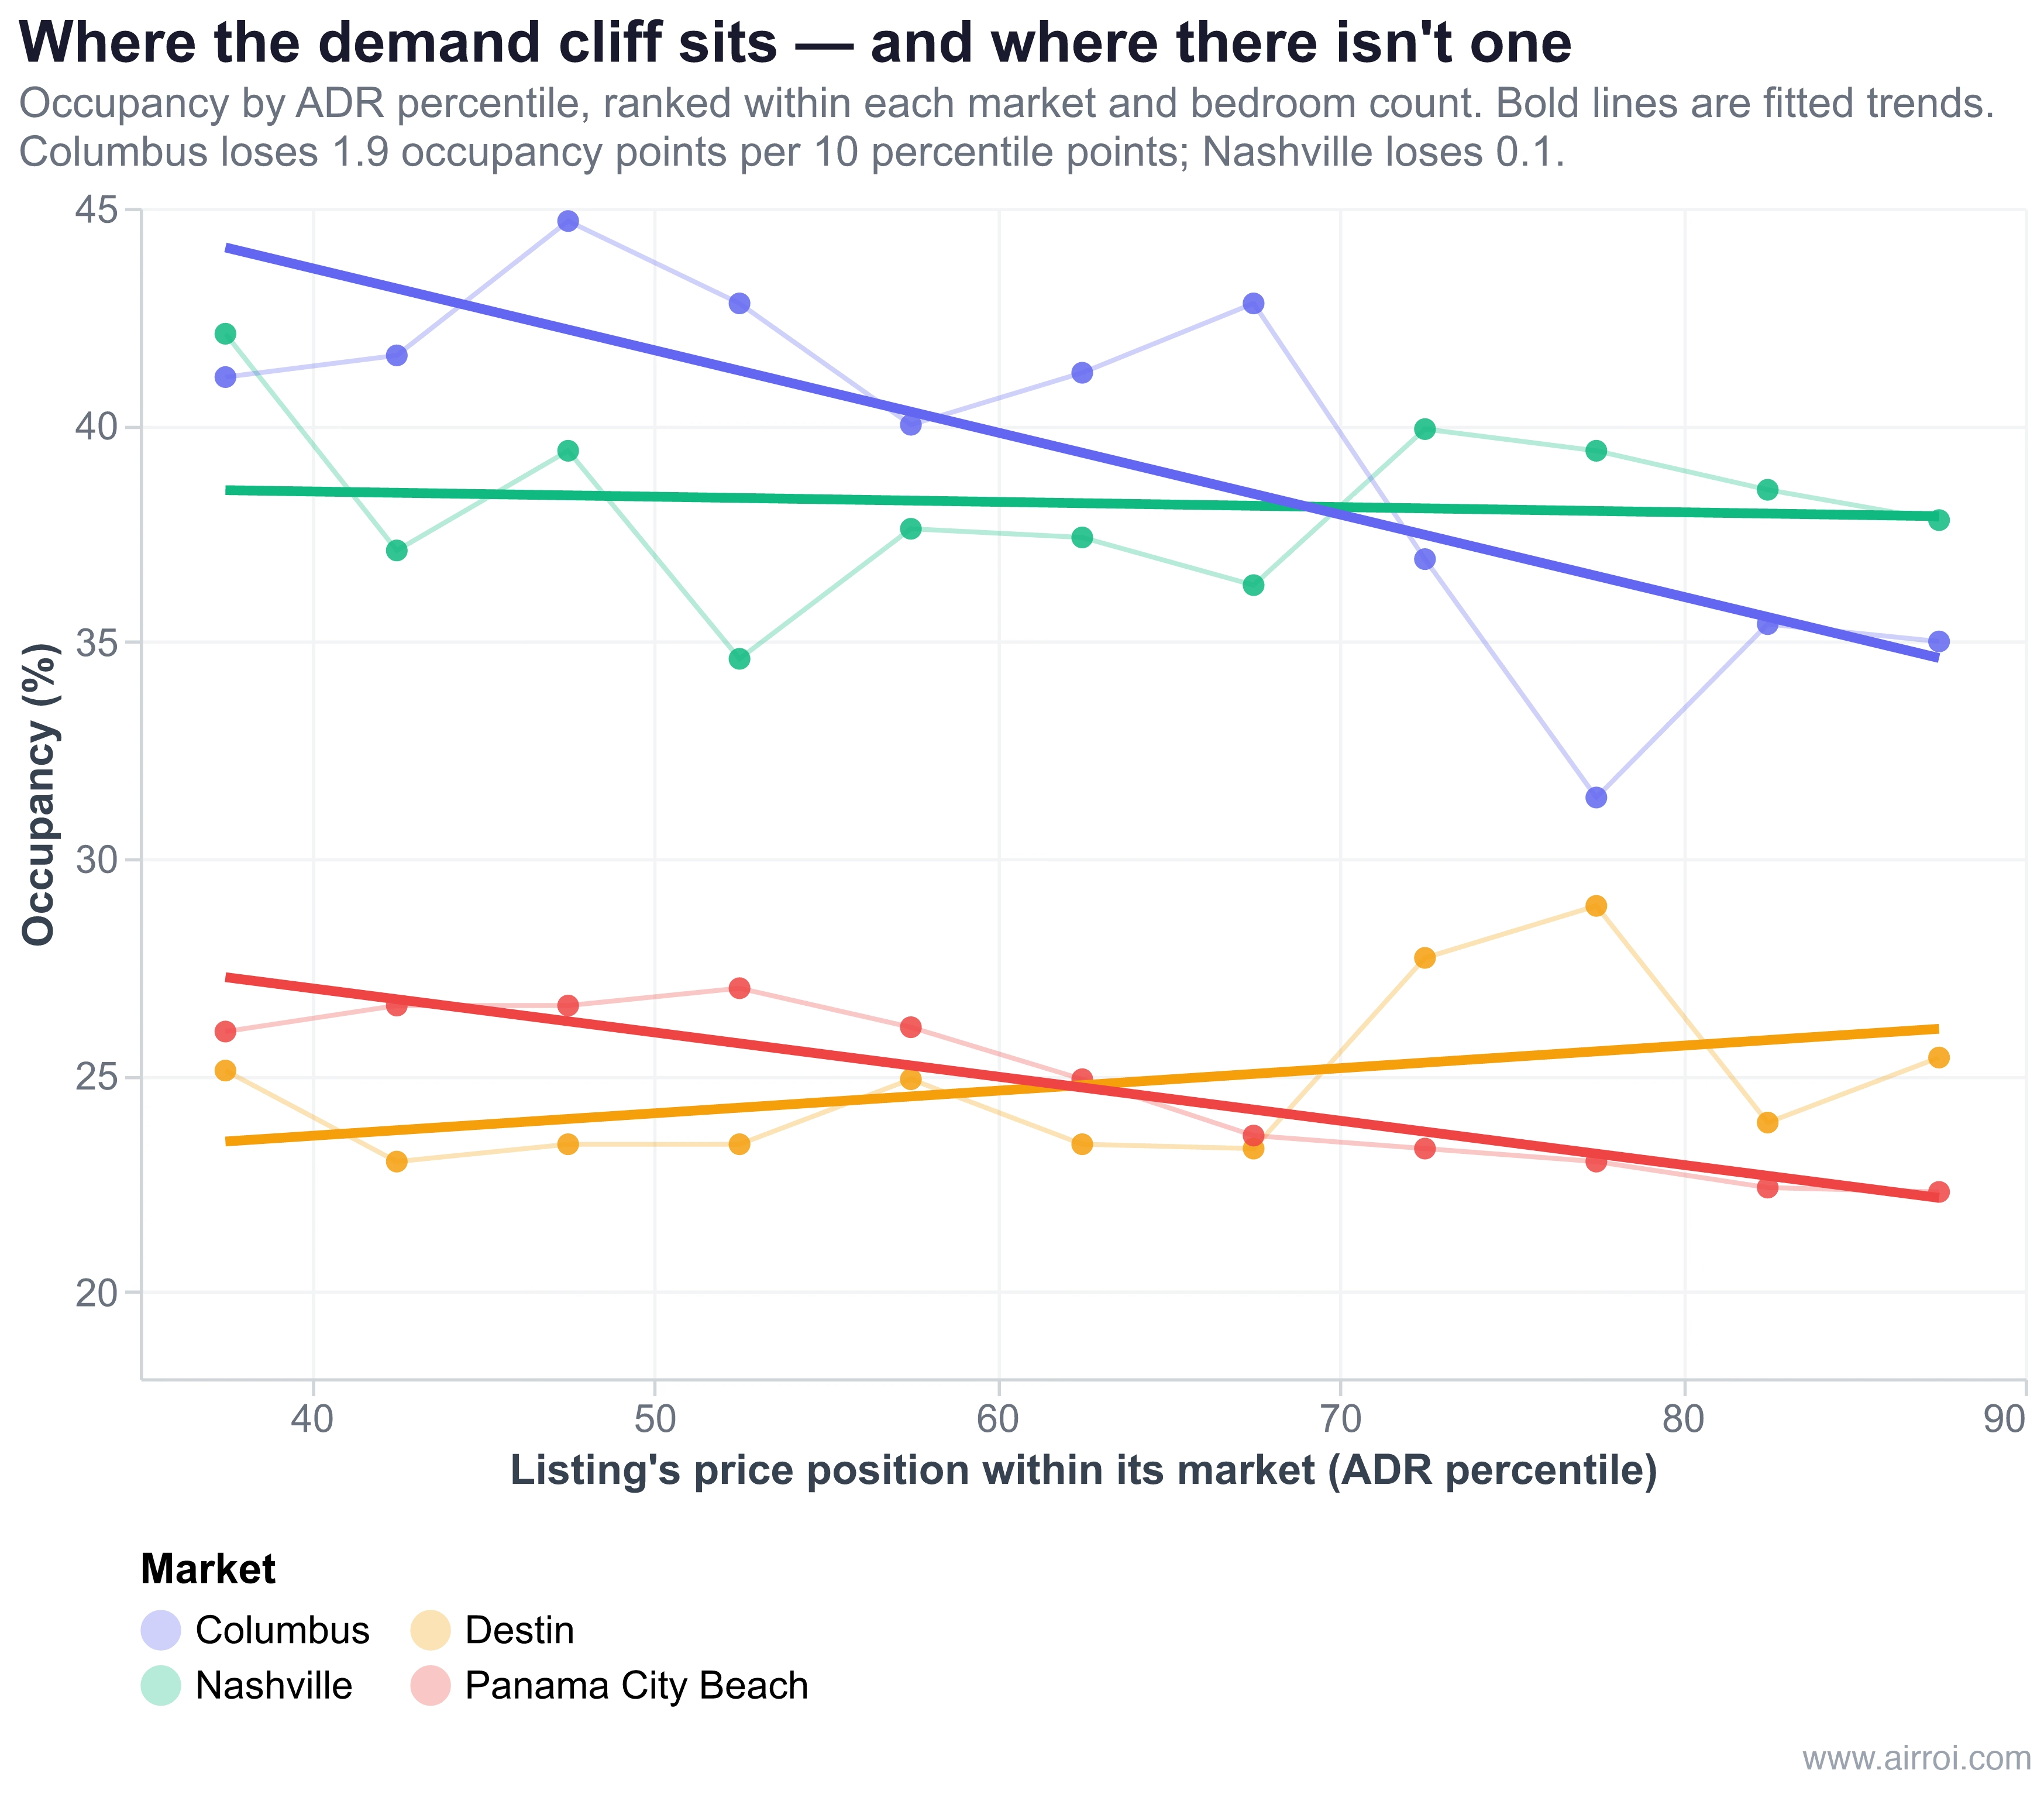
This measurement is cross-sectional: it compares different listings at different price positions at one moment, not one listing's response to a price change. The confound runs in a known direction, which makes it useful. Listings at the 70th ADR percentile are generally better listings — better located, better equipped, better photographed. They earned the price. A median listing that raises its rate gets the price without the product.
So every gradient here understates the occupancy penalty. It is a floor, not an estimate, and the real cost is at least as large. Destin's positive +0.52 is the proof: occupancy cannot genuinely rise with price, so what that number partly measures is quality.
Convergent validation from an unrelated dataset
Over the surplus 3.06% — the gap between +18.3% and payout-neutral — AirROI's implied within-market elasticities run −0.04 to −0.72, clustering near −0.2. Cornell's property-level panel of urban hotel demand across major metropolitan markets, covering 1989–2000, put own-price elasticity at −0.13 and described it as "extremely small." Two unrelated methods, different decades, same order of magnitude.
Cornell's cross-price term matters even more here: at +0.12, a property gains demand when the average rate of all properties in its market rises together. That is precisely what September 15 does.
Do not mix elasticity types. Product-level estimates — one listing moves while rivals hold — run −2 to −5. Market-level estimates, where everything moves together, run −0.13 to −1.3. This is a market-level event, and applying a product-level coefficient would overstate the damage by an order of magnitude.
Which Airbnb Markets Can Absorb a Price Increase — Twelve Markets, Two Scenarios
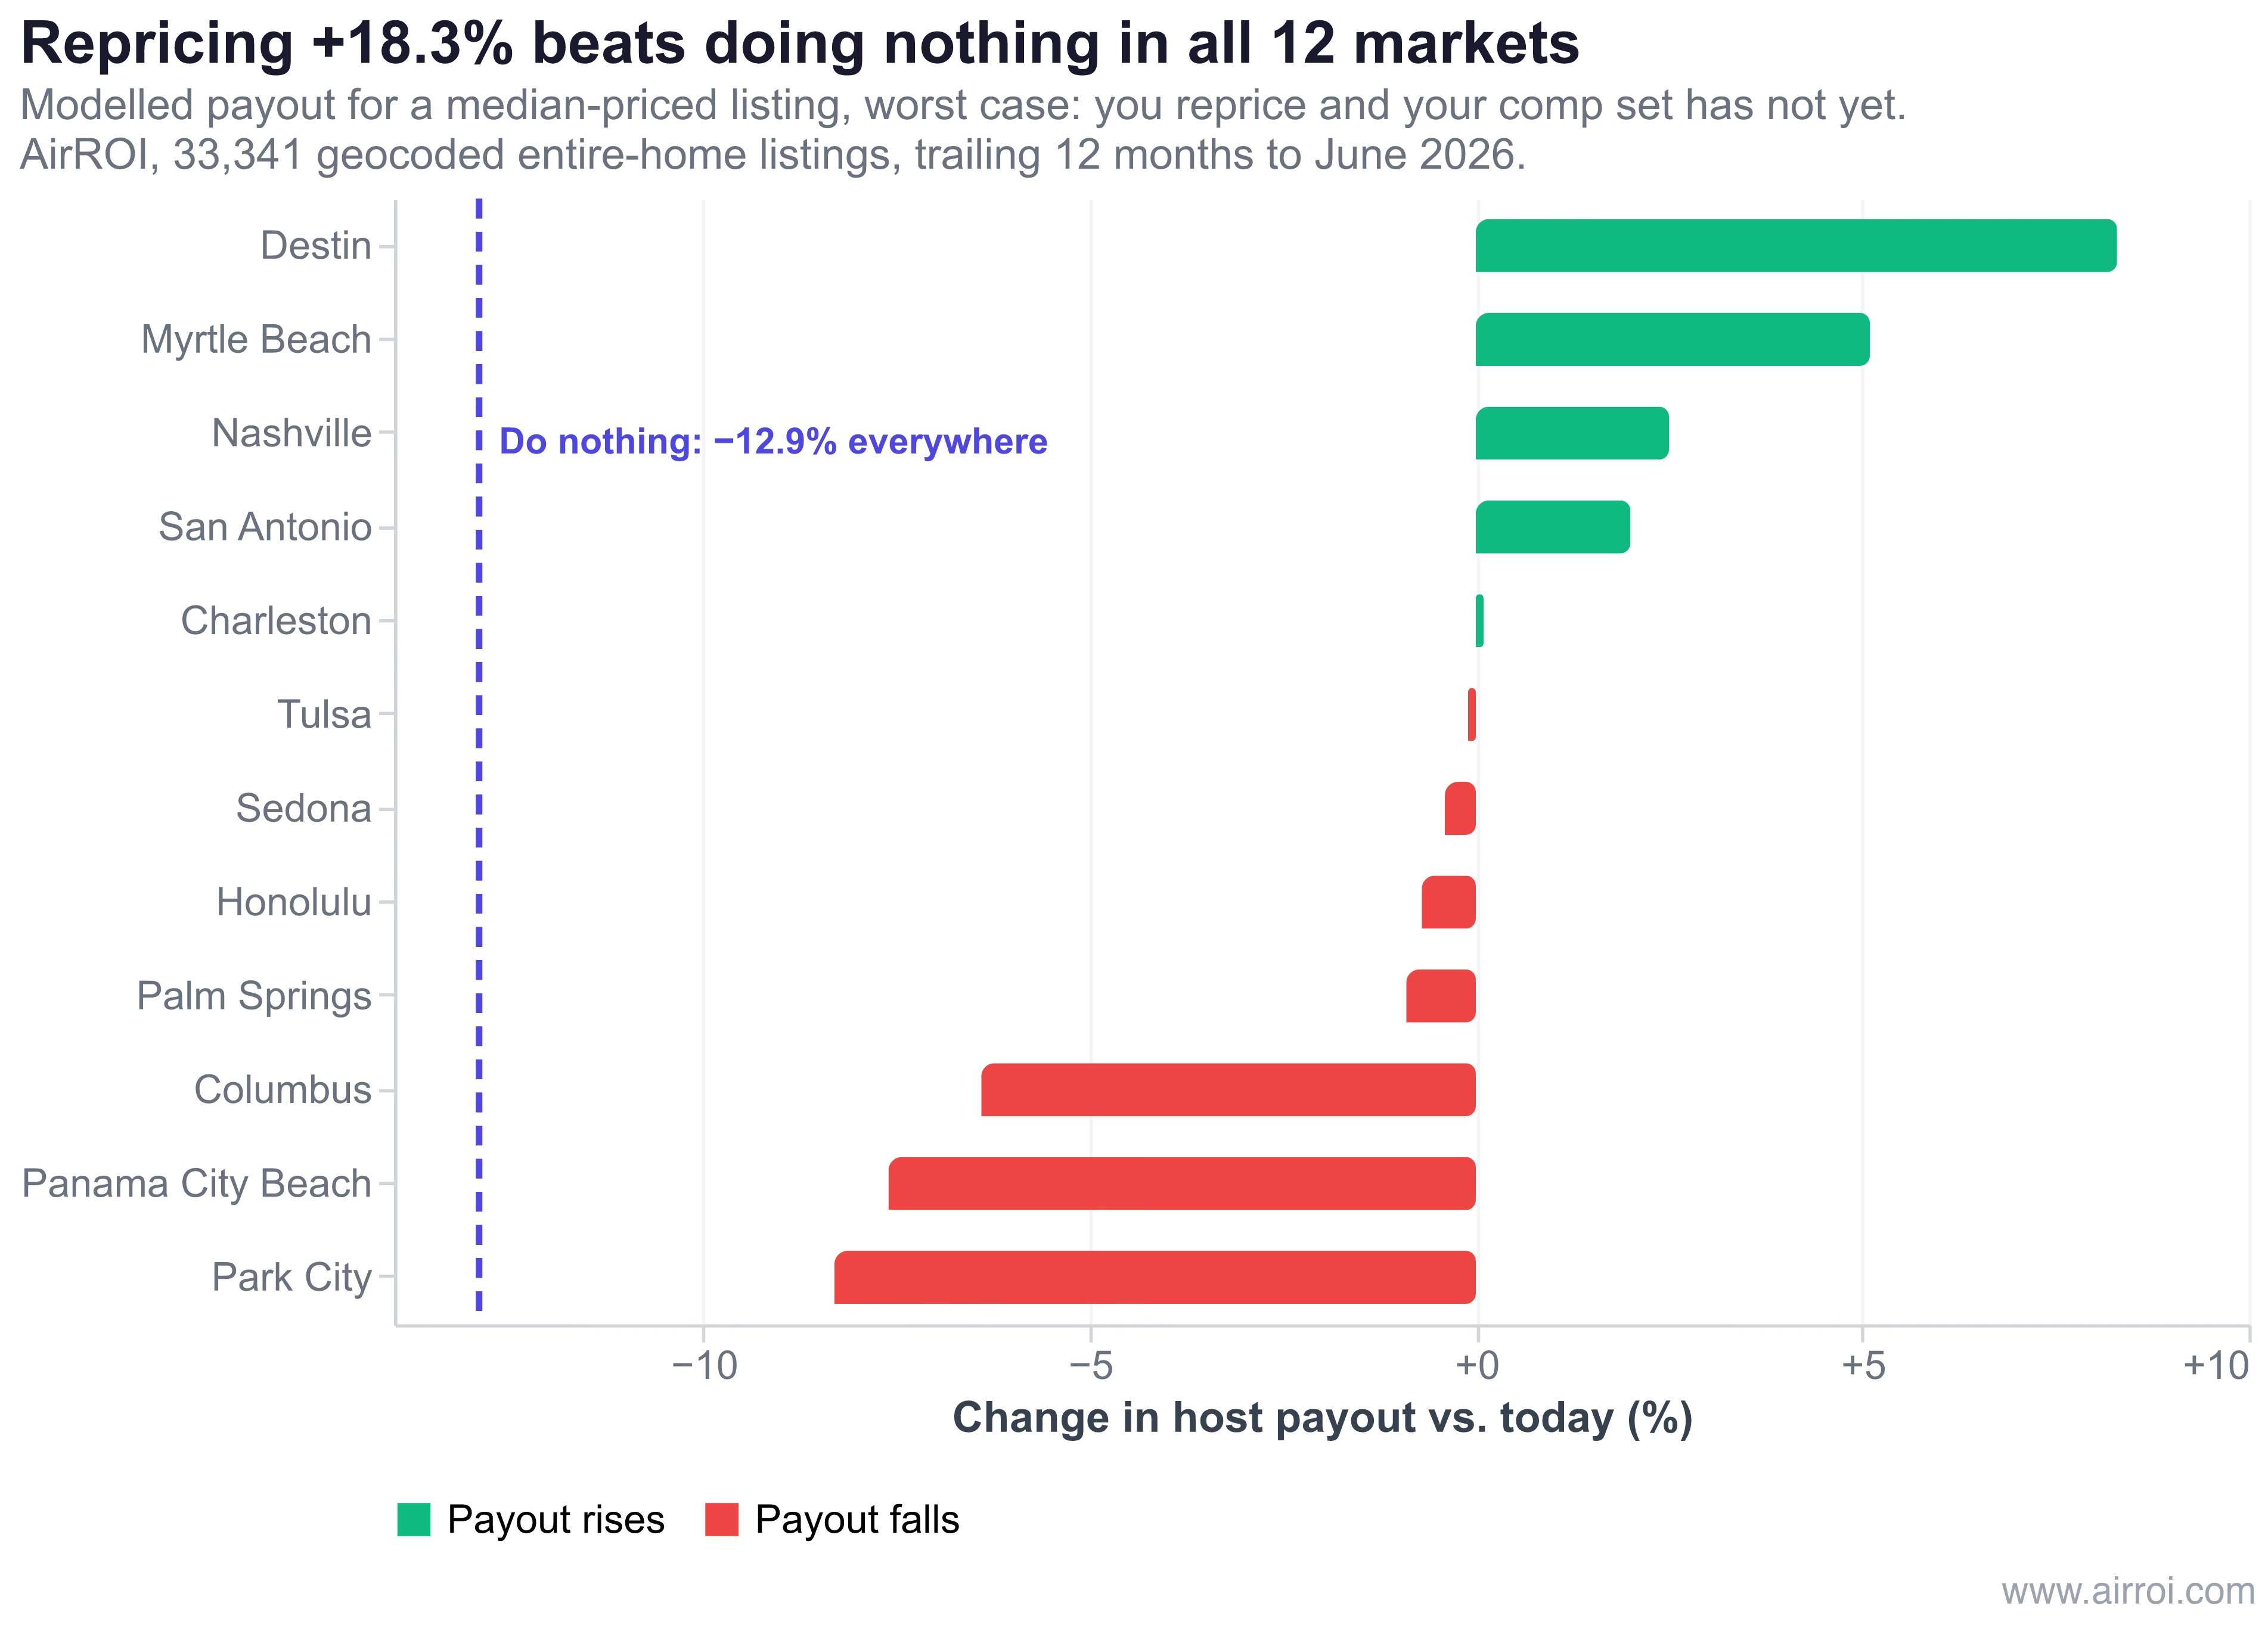
In the steady state, every one of the twelve markets is payout-positive after a full +18.3% reprice. In the transition window, six go negative. All twelve still beat −12.9%.
Both scenarios are real. Steady state is life after September 15, when your comp set has also repriced — only the surplus 3.06% is an unmatched increase, moving a median listing 2.7 to 5.0 percentile points. Transition is repricing now while your comp set hasn't, leaving the full +18.3% unmatched and moving you 15.3 to 26.4 points.
The payout figures below are modelled on RevPAR (revenue per available night — nightly rate multiplied by occupancy), net of the applicable service fee, so they capture both sides of the trade: what the higher rate earns and what the lost occupancy costs.
| Market | Median ADR | Dispersion (p75÷p25) | Occupancy gradient / 10 pctile | Steady-state payout Δ | Transition payout Δ | Avg lead time |
|---|---|---|---|---|---|---|
| Destin, FL | $354 | 1.64 | +0.52 | +4.1% | +8.3% | 65.8 d |
| Myrtle Beach, SC | $227 | 1.66 | +0.23 | +3.5% | +5.1% | 50.1 d |
| Nashville, TN | $292 | 2.13 | −0.12 | +2.9% | +2.5% | 55.3 d |
| San Antonio, TX | $184 | 1.86 | −0.19 | +2.8% | +2.0% | 28.0 d |
| Charleston, SC | $329 | 2.45 | −0.80 | +2.6% | +0.1% | 62.8 d |
| Tulsa, OK | $162 | 1.80 | −0.55 | +2.5% | −0.1% | 38.5 d |
| Sedona, AZ | $372 | 2.02 | −0.81 | +2.4% | −0.4% | 61.4 d |
| Honolulu, HI | $277 | 1.80 | −1.18 | +2.4% | −0.7% | 70.1 d |
| Palm Springs, CA | $455 | 2.25 | −0.68 | +2.3% | −0.9% | 71.9 d |
| Columbus, OH | $176 | 1.86 | −1.89 | +1.4% | −6.4% | 43.1 d |
| Panama City Beach, FL | $304 | 1.56 | −1.02 | +1.0% | −7.6% | 62.2 d |
| Park City, UT | $505 | 2.02 | −1.09 | +0.8% | −8.3% | 74.2 d |
Source: AirROI, June 30, 2026 snapshot, n = 33,341 geocoded entire-home listings.
Reading the table
The best transition outcomes belong to Destin (+8.3%), Myrtle Beach (+5.1%) and Nashville (+2.5%). Nashville is instructive: its gradient is essentially flat at −0.12, so price position costs it almost nothing. The worst are Park City (−8.3%), Panama City Beach (−7.6%) and Columbus (−6.4%). Charleston, Tulsa, Sedona, Honolulu and Palm Springs sit within a point of breakeven.
Charleston and Panama City Beach have near-identical median rates — $329 against $304 — and produce opposite answers. Charleston's occupancy is flat-to-rising across the whole upper range: 49.1% at the 37th–42nd percentile band, 50.2% at the 77th–82nd. There is no cliff to fall off, and a full reprice still models to +0.1% even in the transition case. Columbus falls off a visible one: average occupancy drops from 42.8% at the 67th–72nd percentile to 31.4% at the 77th–82nd.
The line that matters most
Booking Lead Time Decides When You Feel It
San Antonio's 28.0-day average booking window and Park City's 74.2 days mean two hosts making the same change on the same day read the result six weeks apart. Booking lead time — the average gap between reservation and check-in — is the transmission speed of any pricing decision.
Long-window markets carry a cushion. Park City (74.2 days), Palm Springs (71.9), Honolulu (70.1) and Destin (65.8) have months of reservations already locked at old rates, and Airbnb confirms the single service fee "will only apply to reservations made after you switch to a single fee." Existing bookings are untouched.
Short-window markets transmit almost immediately. San Antonio (28.0 days), Tulsa (38.5) and Columbus (43.1) will show the effect of a reprice inside a month — which cuts both ways, since the correction arrives as fast as the pain.
What the "Bookings Dropped" Reports Actually Show
Occupancy did fall — in all twelve markets, on an identical set of listings measured a year apart — and none of it can be pinned on the fee. The hypothesis is worth stating fairly, because a real host raised it in a thread that drew 189 comments: bookings stopped after the mandatory 15.5% price increase. But the highest-scoring replies in that thread are rebuttals, at 24, 22 and 14 points against the original post's 79.
"Guests are paying the same.. so wth are you talking about? The fee simply got restructured so hosts are the ones paying any fees instead of guests but the end price is the same to guests."
— u/piquantAvocado [24 points], r/airbnb_hosts
"No, we increased our rates (about a month ago ahead of the change) and we've been getting the normal bookings coming through, no noticeable drop whatsoever. It's possible that you're in a more competitive/saturated market, but it increase hasn't had any effect on our booking rate."
— u/CaptBlackfoot [22 points], same thread
Another host offered seasonality: "Look back at your last 10 years of bookings and you will see the same drop. People are done booking their summer vacations." Late July is a structural trough.
What a matched panel shows
The only honest way to measure this is a matched panel — the same listings in both snapshots, identified by listing ID, so the comparison cannot be distorted by listings entering or leaving the sample. Across 18,639 listings present in both periods, occupancy fell in every one of the twelve markets, from −3.6 points in Panama City Beach to −8.5 in San Antonio.
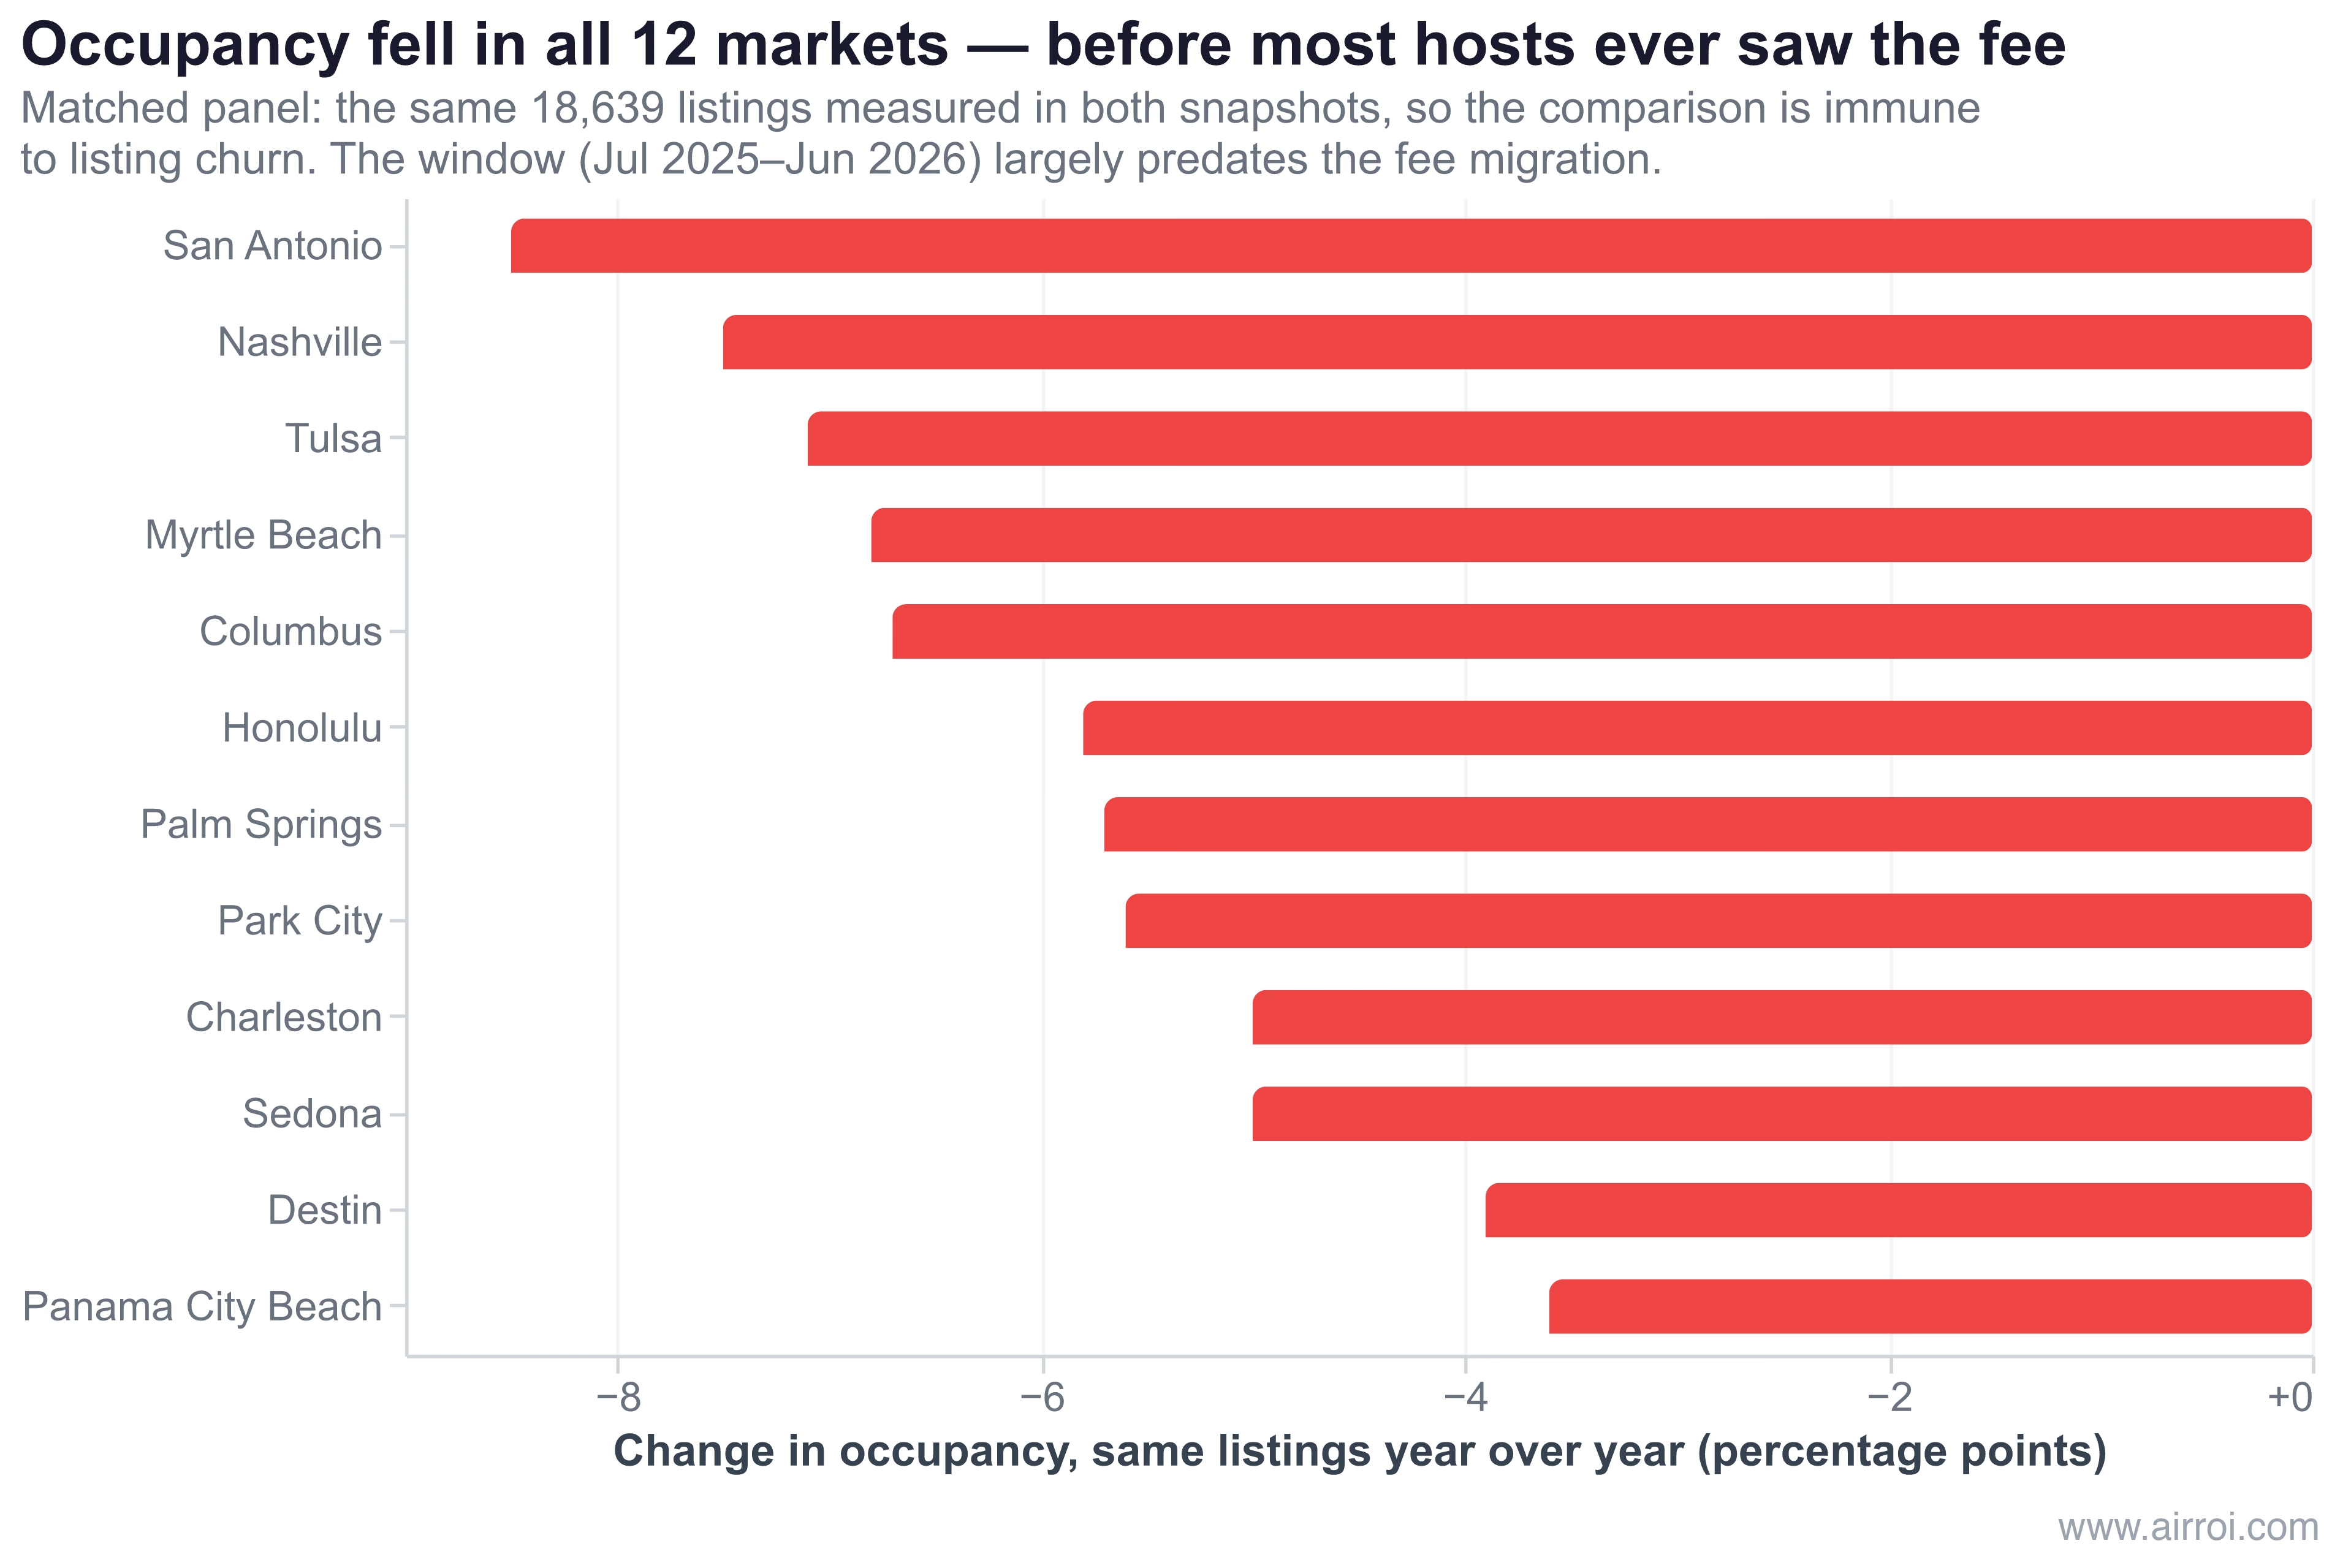
That uniformity is the point. A fee effect should show up unevenly, concentrated in the cohorts that actually migrated. A decline this broad — every market, resort and urban, high-ADR and budget — looks like a demand-side story that has nothing to do with which side of the ledger a service fee sits on.
Three reasons this cannot be a fee effect for most listings
The window problem. AirROI's trailing-twelve-month window runs July 2025 to June 2026. It contains at most three post-migration months for the already-connected cohort and zero for everyone else. Occupancy changes measured across it cannot be a fee effect for the majority of listings, whatever else they are.
The failed test, reported as a failure. We ran a difference-in-differences design comparing professionally managed listings, which migrated April 13, 2026, against self-managed listings that had not. The gap was +1.65 occupancy points in May and +2.07 in June. Then we ran the same comparison in a pre-migration placebo window, December 2024 to December 2025, and got +11.6 points — larger than the supposed effect. Parallel trends is violated. The design cannot isolate the fee, and publishing the +2.07 as though it could would be dishonest.
Data contamination, including ours. A 60-listing operator who migrated in October 2025 named the problem before any analyst did:
"Is the Unit that is a perfect comp to you in your area one that was switched to the 15.5% Fee back in October or were they being charged the 3% Fee and are just now switching? All you can see is the Revenue Totals and it will not be until 2027 when almost every Host on the platform is transitioned to 15.5% that you can comfortably trust the data."
— 60-listing operator [38 points], r/airbnb_hosts
He is right, and the problem runs deeper than the fee. Every 2026 short-term rental revenue and ADR series — AirROI's included — is distorted by the staggered migration, because migrated listings report inflated gross revenue while un-migrated ones do not.
We hit a second version of it while preparing this analysis, and it is worth reporting. An earlier draft of this article included market-level supply growth: listing counts compared across the two snapshots. Those figures did not survive scrutiny. Records with missing county-level geocoding multiplied between the snapshots in every market — from 6 to 626 in Columbus, 15 to 996 in Honolulu — and the Nashville metro turned out to be split across two different city labels whose populations shifted between periods. The result was apparent supply swings of +21% and −16% that were artifacts of geocoding coverage, not listings being built or delisted. We dropped supply growth from this article entirely and rebuilt every remaining figure on the 33,341 listings with verified county geocoding. The occupancy comparison above was rebuilt as a matched panel for the same reason.
Distrust 2026 year-over-year comparisons — including any you see from us that do not say how they handled this.
The macro backdrop is not neutral either. US lodging CPI ran +4.9% year over year in June 2026 per the Bureau of Labor Statistics, after a deflationary 2025 — guests are already absorbing a roughly 5% lodging price rise before any fee restructuring. Deloitte's 2026 summer travel survey found only 45% of Americans planned a vacation with paid lodging, the lowest in six years, while the average longest-trip budget rose 17% to $4,069. The market is shedding price-sensitive travellers while the remainder spend more — which cuts against a naive price-sensitivity story.
Airbnb Host-Only Fee Repricing: What to Do If Your Market Can't Absorb It
Reprice everywhere. Size the increase to your market. Here is the decision sequence, in order.
- Set the target deliberately. +14.8% is payout-neutral. Take +18.3% only as a conscious ~3% raise — and in Columbus, Panama City Beach and Park City, that surplus lands exactly where the occupancy gradient is steepest. If your old host fee was above 3%, use
old_rate × (1 − your_old_host_fee) ÷ 0.845. - Do not wait until September 14. The delay strategy rests on a false premise about the search grid: Airbnb has ranked on total price since 2022 and displayed all-in prices since April 2025. Waiting forfeits weeks of correctly priced bookings and protects nothing.
- Gross up the cleaning fee separately. Divide it by 0.845, or cut it and fold it into the nightly rate — nearly 40% of active listings already charge none, and the fee-bearing base is identical either way.
- Watch the discount trap. Airbnb's adjustment tool explicitly excludes discounts. A promotion launched after you reprice can hand the entire gross-up straight back.
- Check cross-channel parity. Vrbo in the US runs roughly 8% — a 5% commission plus 3% payment processing — and still charges guests separately. Grossing up Airbnb alone shifts volume to other channels, which is one reason the direct-booking recapture math deserves a look this autumn.
- Mind the tax base. Lodging taxes assessed on the gross guest payment now include Airbnb's commission, so gross revenue rises without net rising. EU and UK hosts may cross a VAT threshold — Airbnb warns about this itself, noting that adjusting prices "can increase your gross income, which means you could reach your VAT threshold sooner."
- Distrust 2026 revenue comparisons, including ours. Until the migration completes, comp-set revenue data mixes two fee regimes.
This article is market analysis, not financial, legal or tax advice. Fee rates, thresholds and lodging tax treatment vary by jurisdiction and by listing. Consult a qualified professional before acting — Airbnb itself flags the VAT-threshold consequence of repricing.
The Deadline Is Real; the Sky Is Not Falling
The Airbnb 15.5% host fee arriving in September 2026 is a fee-incidence transfer wrapped in a compliance deadline. Doing nothing costs 12.9% of payout everywhere, with no opt-out. Payout-neutral is +14.8%, the widely quoted +18.3% is a 3.06% price increase, and the mocked +15.5% overshoots neutral by 0.62%.
Across twelve markets, the steady state is payout-positive everywhere and the worst transition outcome is −8.3%. The question is not whether to reprice but by how much, and the answer is written in your market's price dispersion.
Frequently Asked Questions
About 14.8%, not the 18.3% most guides quote. Dividing by 0.845 holds your gross list price flat, not your payout — and on the split fee you were already paying roughly 3%. The payout-neutral calculation is 0.97 ÷ 0.845 = 1.148. On a $300 nightly rate that is $344, not $355. Airbnb's own worked example uses $100 → $115.
The 15.5% fee applies anyway and your payout falls 12.9%. Airbnb states it plainly: keep your price at $100 and you earn $84.50. For a median Charleston listing that is about $7,595 a year; for a median Tulsa listing, about $2,949. There is no opt-out and no grandfathering.
Barely. Airbnb has shown all-in prices in search since April 2025 and ranked search results on total price since November 2022, and the guest service fee disappears from the total. At the payout-neutral reprice the guest's all-in price changes by about +0.6%; even a full +18.3% moves it only +3.7%.
Occupancy fell in all twelve markets AirROI analysed — between 3.6 and 8.5 percentage points, measured on a matched panel of 18,639 listings present in both periods. But the measurement window largely predates the migration, and the decline is uniform across every market type rather than concentrated in the cohorts that actually switched. Nothing in the data isolates the fee as the cause.
Yes — the fee is charged on the full booking subtotal, which includes the nightly rate plus cleaning, pet and extra-guest fees, with taxes excluded. A $400 cleaning fee went from $12 of Airbnb fee under the split model to $62. Gross it up separately: $400 ÷ 0.845 = $473.