Airbnb Oversaturation 2026: Which U.S. Markets Are Bleeding RevPAR
Between March 2024 and March 2025, Austin added 2,582 new Airbnb listings -- a 32% supply surge that compressed average RevPAR to $131/night and dropped occupancy to 45%. Dallas grew even faster at 34%. Yet in the Smoky Mountains, Gatlinburg's listings grew 45% and RevPAR held firm at $177/night. The difference reveals everything investors need to know about where the short-term rental market correction is real -- and where the gold rush continues.
This article uses proprietary AirROI data to quantify exactly which markets are bleeding, which are thriving, and introduces a five-signal oversaturation scorecard that investors can apply to any market before committing capital. Whether you are evaluating your first STR purchase or stress-testing an existing portfolio, the data below provides a market-by-market framework for navigating the airbnb oversaturation landscape in 2026.
The Supply Explosion: 1.76 Million Listings and Counting
U.S. short-term rental listings hit a record 1.76 million in June 2025, according to AirDNA data -- a 6.1% increase from the prior year. The growth was not evenly distributed. Rural destinations surged 23% while suburban areas added 18%, but the most damaging supply growth occurred in urban metros where demand failed to keep pace.
The macro picture tells a stark story of deceleration. U.S. STR demand growth has fallen from 15.8% in 2021 to a projected 5.5% in 2026. More properties now compete for slower-growing bookings, and the result is visible across the country: 31 of the top 50 largest U.S. STR markets experienced declining occupancy rates in the July-September 2025 period, according to industry analysis.
"This is a correction, not a full collapse. But it feels like a crash to investors who bought during the hype. Markets will stabilize, but not all STR owners will survive." -- IGMS Research, "Navigating the Airbnb Bust" (2025)
The trajectory is unmistakable. Seven years ago, the U.S. had fewer than 200,000 STR listings. By 2023, that number had surged to nearly one million. Today it approaches 1.76 million. Meanwhile, the era of double-digit demand growth that justified this supply expansion is over. The result is a classic commodity cycle: supply overshot demand, and per-listing economics are compressing across the majority of urban markets.
Where the Growth Is Concentrated
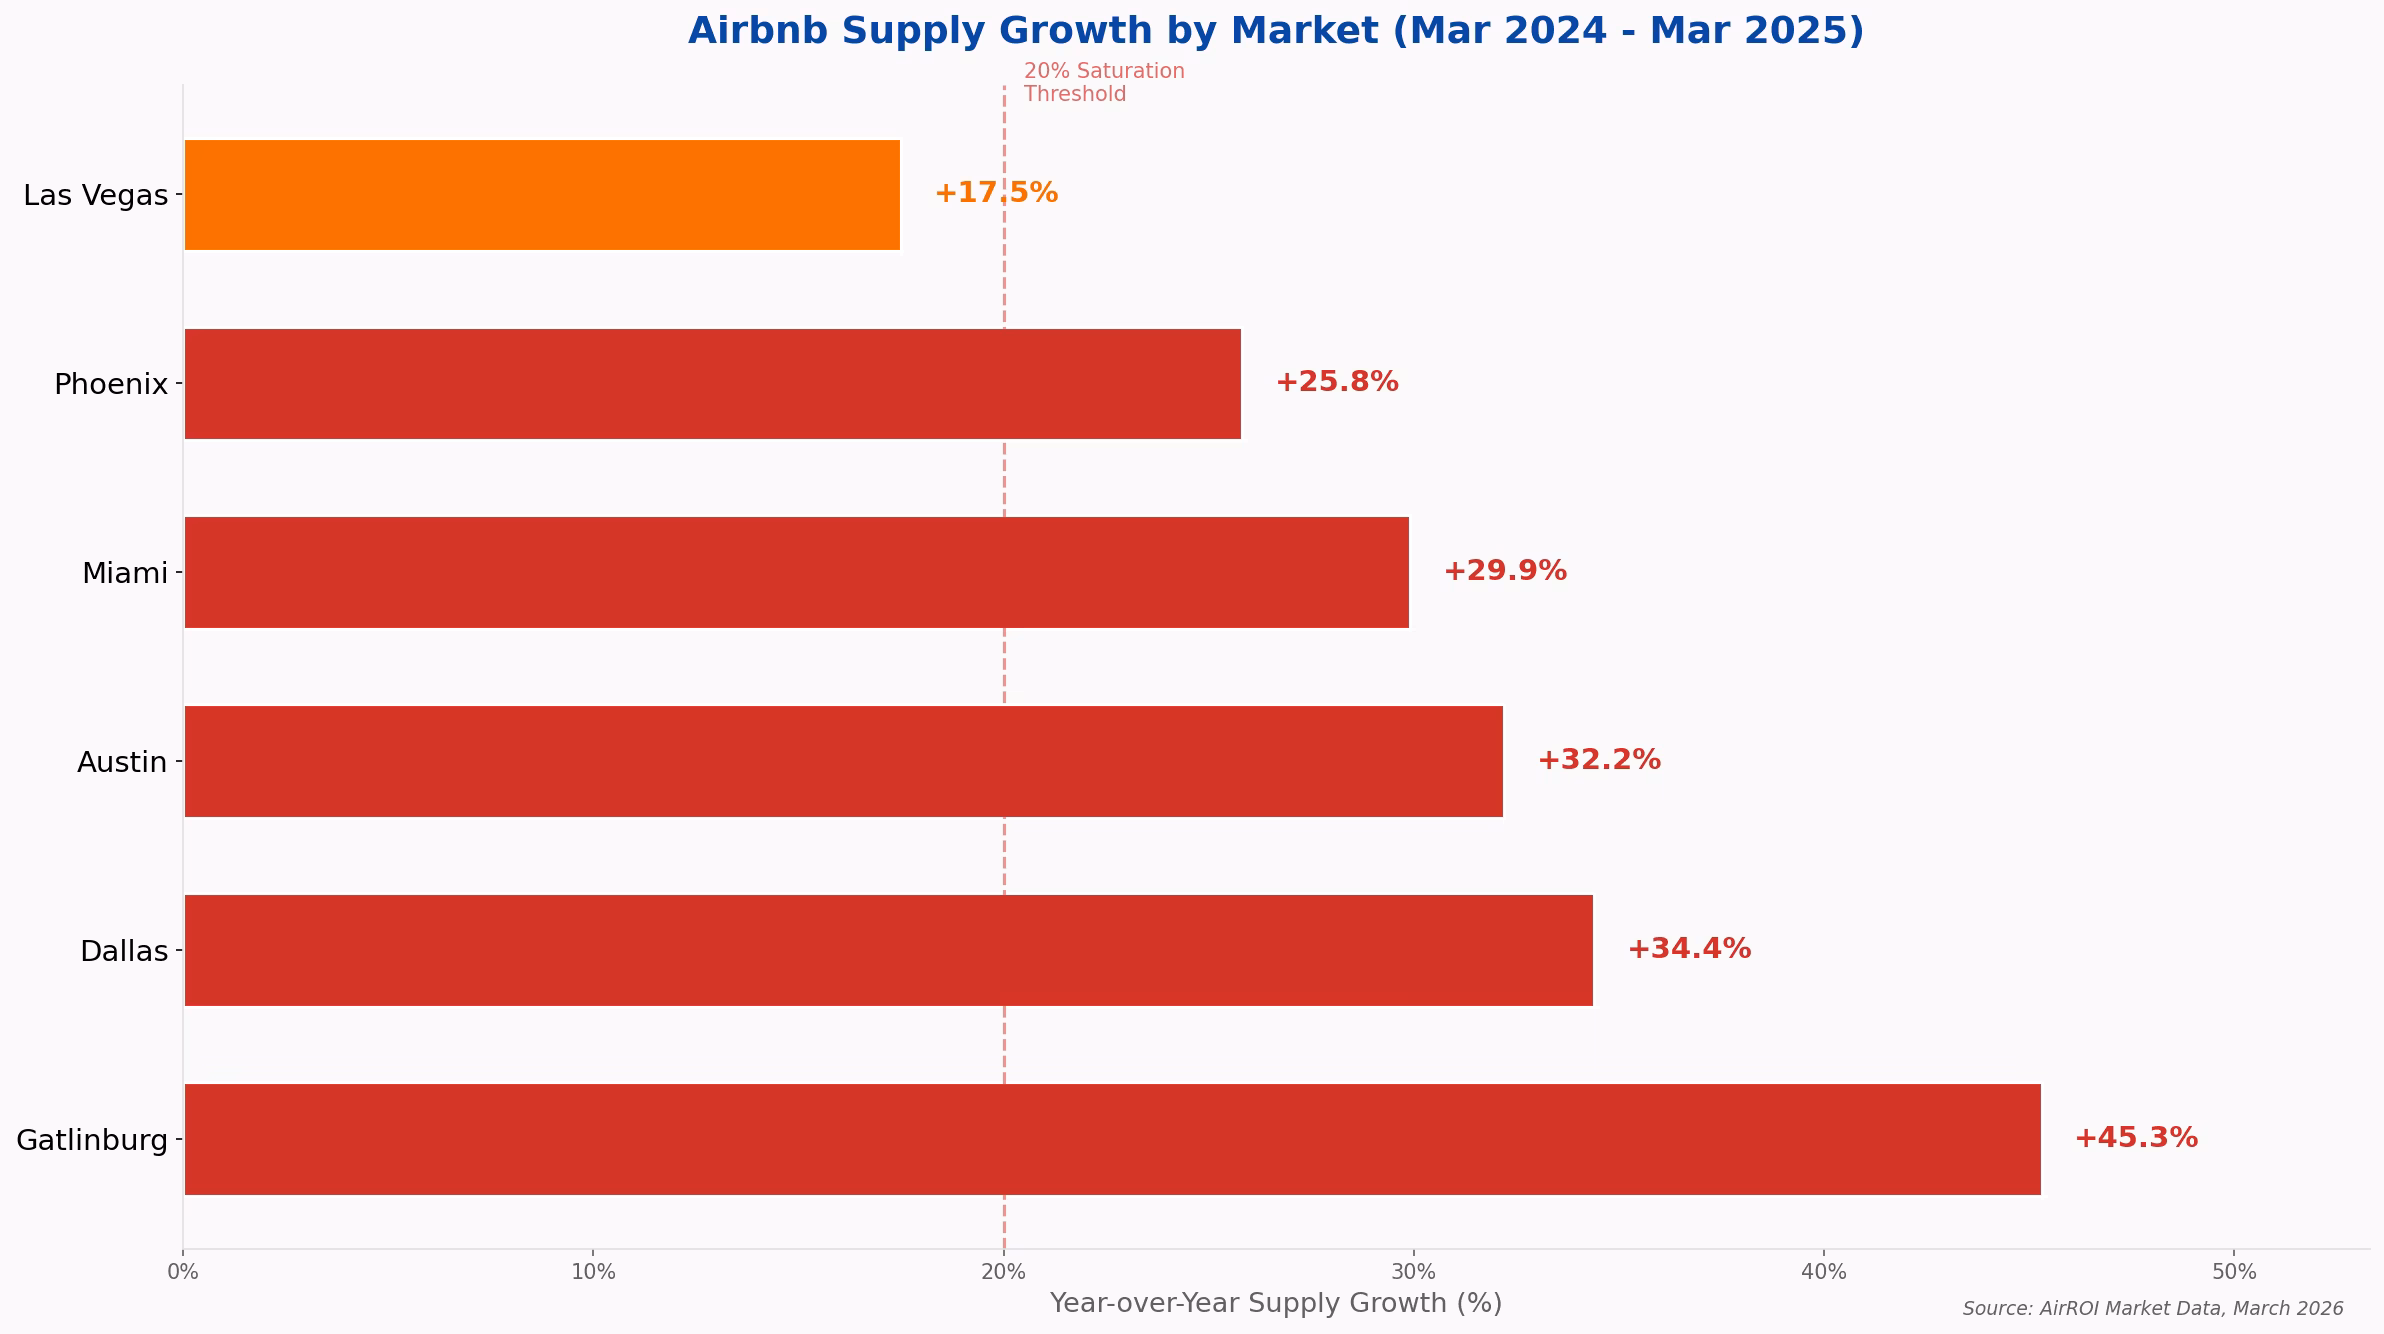
AirROI tracked supply growth across six major U.S. markets between March 2024 and March 2025. Every market in our sample grew at or above 17%, but the revenue outcomes diverged dramatically.
| Market | Mar 2024 Listings | Mar 2025 Listings | YoY Growth | Feb 2026 Listings |
|---|---|---|---|---|
| Gatlinburg, TN | 2,517 | 3,656 | +45.3% | 3,914 |
| Dallas, TX | 3,559 | 4,783 | +34.4% | 4,739 |
| Austin, TX | 8,030 | 10,612 | +32.2% | 9,289 |
| Miami, FL | 7,042 | 9,148 | +29.9% | 8,743 |
| Phoenix, AZ | 5,787 | 7,282 | +25.8% | 6,359 |
| Las Vegas, NV | 2,566 | 3,014 | +17.5% | 4,191 |
Source: AirROI Market Data, March 2026
The paradox is immediate: Gatlinburg posted the highest supply growth (45.3%) yet maintained the strongest per-listing economics. Dallas grew at a similar rate (34.4%) but sits at the bottom of the revenue table. Supply growth alone does not predict oversaturation -- the ratio of supply growth to demand absorption determines whether new listings enhance or erode a market's economics.
RevPAR Compression: The Metric That Separates Winners from Losers
RevPAR (Revenue Per Available Rental night) is the single most important metric for detecting airbnb market saturation because it captures both pricing and occupancy in one number. A market with a $300 ADR but 35% occupancy produces lower RevPAR ($105/night) than one with $200 ADR at 65% occupancy ($130/night). ADR alone is deceptive -- it hides the empty nights.
"Revenue Per Available Night is the single best number for comparing markets -- it divides total revenue by all calendar nights regardless of booking status." -- Sean Rakidzich, STR investment analyst
AirROI's 24-month market summaries reveal the full picture. Austin hosts maintain a respectable $294 ADR, but with only 45% of nights booked, their RevPAR compresses to $131/night. Dallas tells an even sharper story: $226 ADR, 45% occupancy, and $102 RevPAR -- the lowest in our six-market sample. Meanwhile, Gatlinburg commands $367 ADR at 48% occupancy for $177 RevPAR and median annual revenue of $40,582 per listing -- nearly double Austin's $21,032.
| Market | Avg Occupancy | ADR | RevPAR | Annual Revenue | Booking Lead Time |
|---|---|---|---|---|---|
| Gatlinburg, TN | 48% | $367 | $177 | $40,582 | 56.4 days |
| Miami, FL | 50% | $288 | $143 | $23,399 | 34.9 days |
| Phoenix, AZ | 49% | $282 | $142 | $22,740 | 43.3 days |
| Austin, TX | 45% | $294 | $131 | $21,032 | 38.2 days |
| Dallas, TX | 45% | $226 | $102 | $15,400 | 27.5 days |
| Las Vegas, NV | 42% | $271 | $114 | $15,215 | 37.3 days |
Source: AirROI Market Data, 24-month averages through February 2026
Notice that Dallas and Las Vegas -- the two markets with the lowest RevPAR -- also have the shortest booking lead times (27.5 and 37.3 days, respectively). Short lead times indicate weak advance demand and last-minute booking patterns, both hallmarks of oversupplied markets where guests have abundant choices.
The Winner-Take-All Dynamic
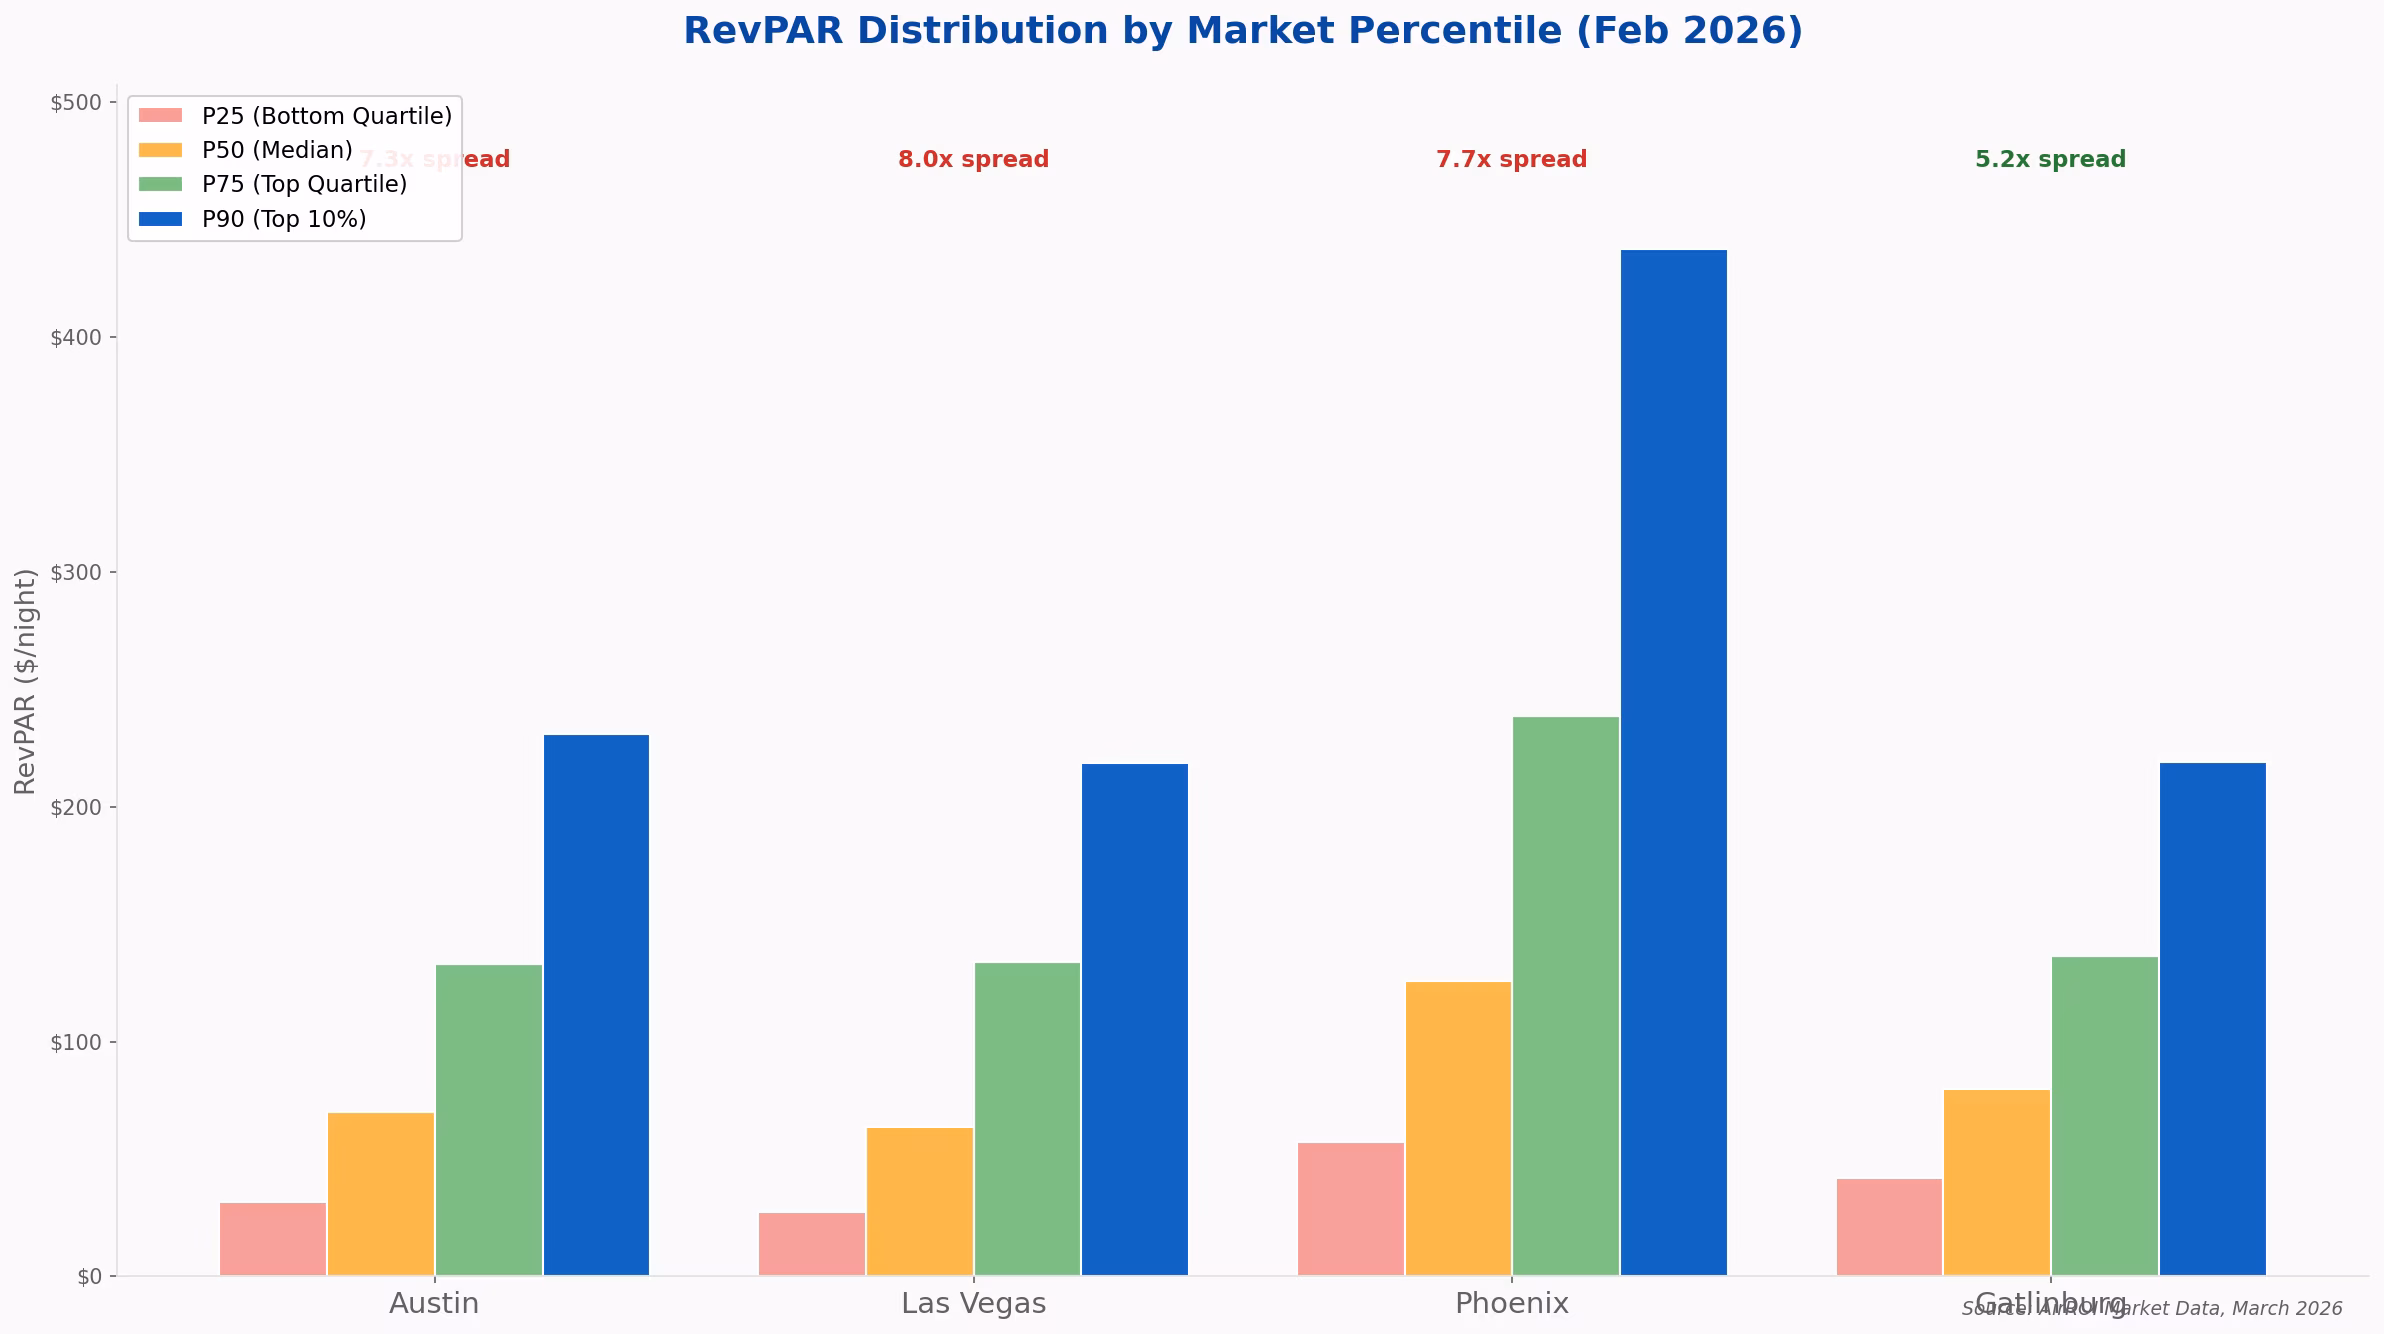
RevPAR compression does not affect all listings equally. In oversaturated markets, the gap between top and bottom performers widens into a chasm. AirROI's percentile data for February 2026 reveals a winner-take-all dynamic that market-average statistics obscure.
| Market | P25 RevPAR | P50 RevPAR | P75 RevPAR | P90 RevPAR | P90/P25 Spread |
|---|---|---|---|---|---|
| Las Vegas | $27/night | $64/night | $134/night | $219/night | 8.0x |
| Phoenix | $57/night | $126/night | $239/night | $437/night | 7.7x |
| Austin | $32/night | $70/night | $133/night | $231/night | 7.3x |
| Gatlinburg | $42/night | $80/night | $137/night | $219/night | 5.2x |
Source: AirROI Market Data, February 2026
In Las Vegas, the bottom 25% of listings earn just $27/night RevPAR ($810/month) while the top 10% earn $219/night ($6,570/month) -- an 8.0x gap. In Austin, the spread is 7.3x: the bottom quartile generates $32/night ($960/month), barely enough to cover utilities on most properties.
Gatlinburg's tighter 5.2x spread signals a healthier market where rising tides lift more boats. When demand fundamentals are strong, even average operators can earn a viable income. In oversaturated metros, only the top quartile prospers while the bottom half bleeds cash.
This distribution matters for investors because market-average projections are misleading. A first-time host entering Austin at the 25th percentile faces a radically different economic reality than the market average suggests. The question is not "what is the average RevPAR?" but rather "where will my property land in the distribution, and can I afford to be below the median?"
Consider the practical math. An Austin property at the 25th percentile generates roughly $960/month in gross revenue. After a typical $2,800 monthly mortgage payment, $400 in utilities and insurance, $300 in cleaning costs, and $200 in platform fees and supplies, the property operates at a monthly loss exceeding $2,700. Even at the median ($2,100/month), the investor loses over $1,500/month. Only properties at the 75th percentile and above -- those earning $133/night RevPAR or approximately $3,990/month -- begin to approach breakeven.
This winner-take-all dynamic is not unique to Austin. In every oversaturated market AirROI analyzed, the bottom quartile generates revenue insufficient to cover standard carrying costs. The implication is clear: entering an oversaturated market without a concrete strategy to land above the median is a recipe for sustained cash losses.
The 5-Signal Oversaturation Scorecard
Signal 1: Listing Growth >20% Annually. Markets adding supply at more than 20% per year are saturating. Above 30% is a red flag. Below 15% is healthy. Five of our six markets exceeded 20%.
Signal 2: Occupancy Below 50%. If average occupancy for your property type sits below 50%, the market has more supply than demand can absorb. Austin (45%), Dallas (45%), and Las Vegas (42%) all fail this threshold.
Signal 3: RevPAR Compression Year-over-Year. Declining RevPAR indicates that supply additions are diluting revenue faster than demand growth can offset them. Watch for consecutive months where RevPAR trails prior-year levels.
Signal 4: ADR Stagnation Despite Falling Occupancy. When occupancy drops but ADR does not adjust downward, hosts are choosing empty nights over rate reductions. This pricing rigidity accelerates revenue decline and signals an unsustainable equilibrium. Dallas displays this pattern clearly.
Signal 5: Booking Lead Time Under 30 Days. Short booking lead times indicate weak advance demand. Gatlinburg's 56-day average signals strong forward booking; Dallas's 27-day average means guests book last-minute from abundant choices.
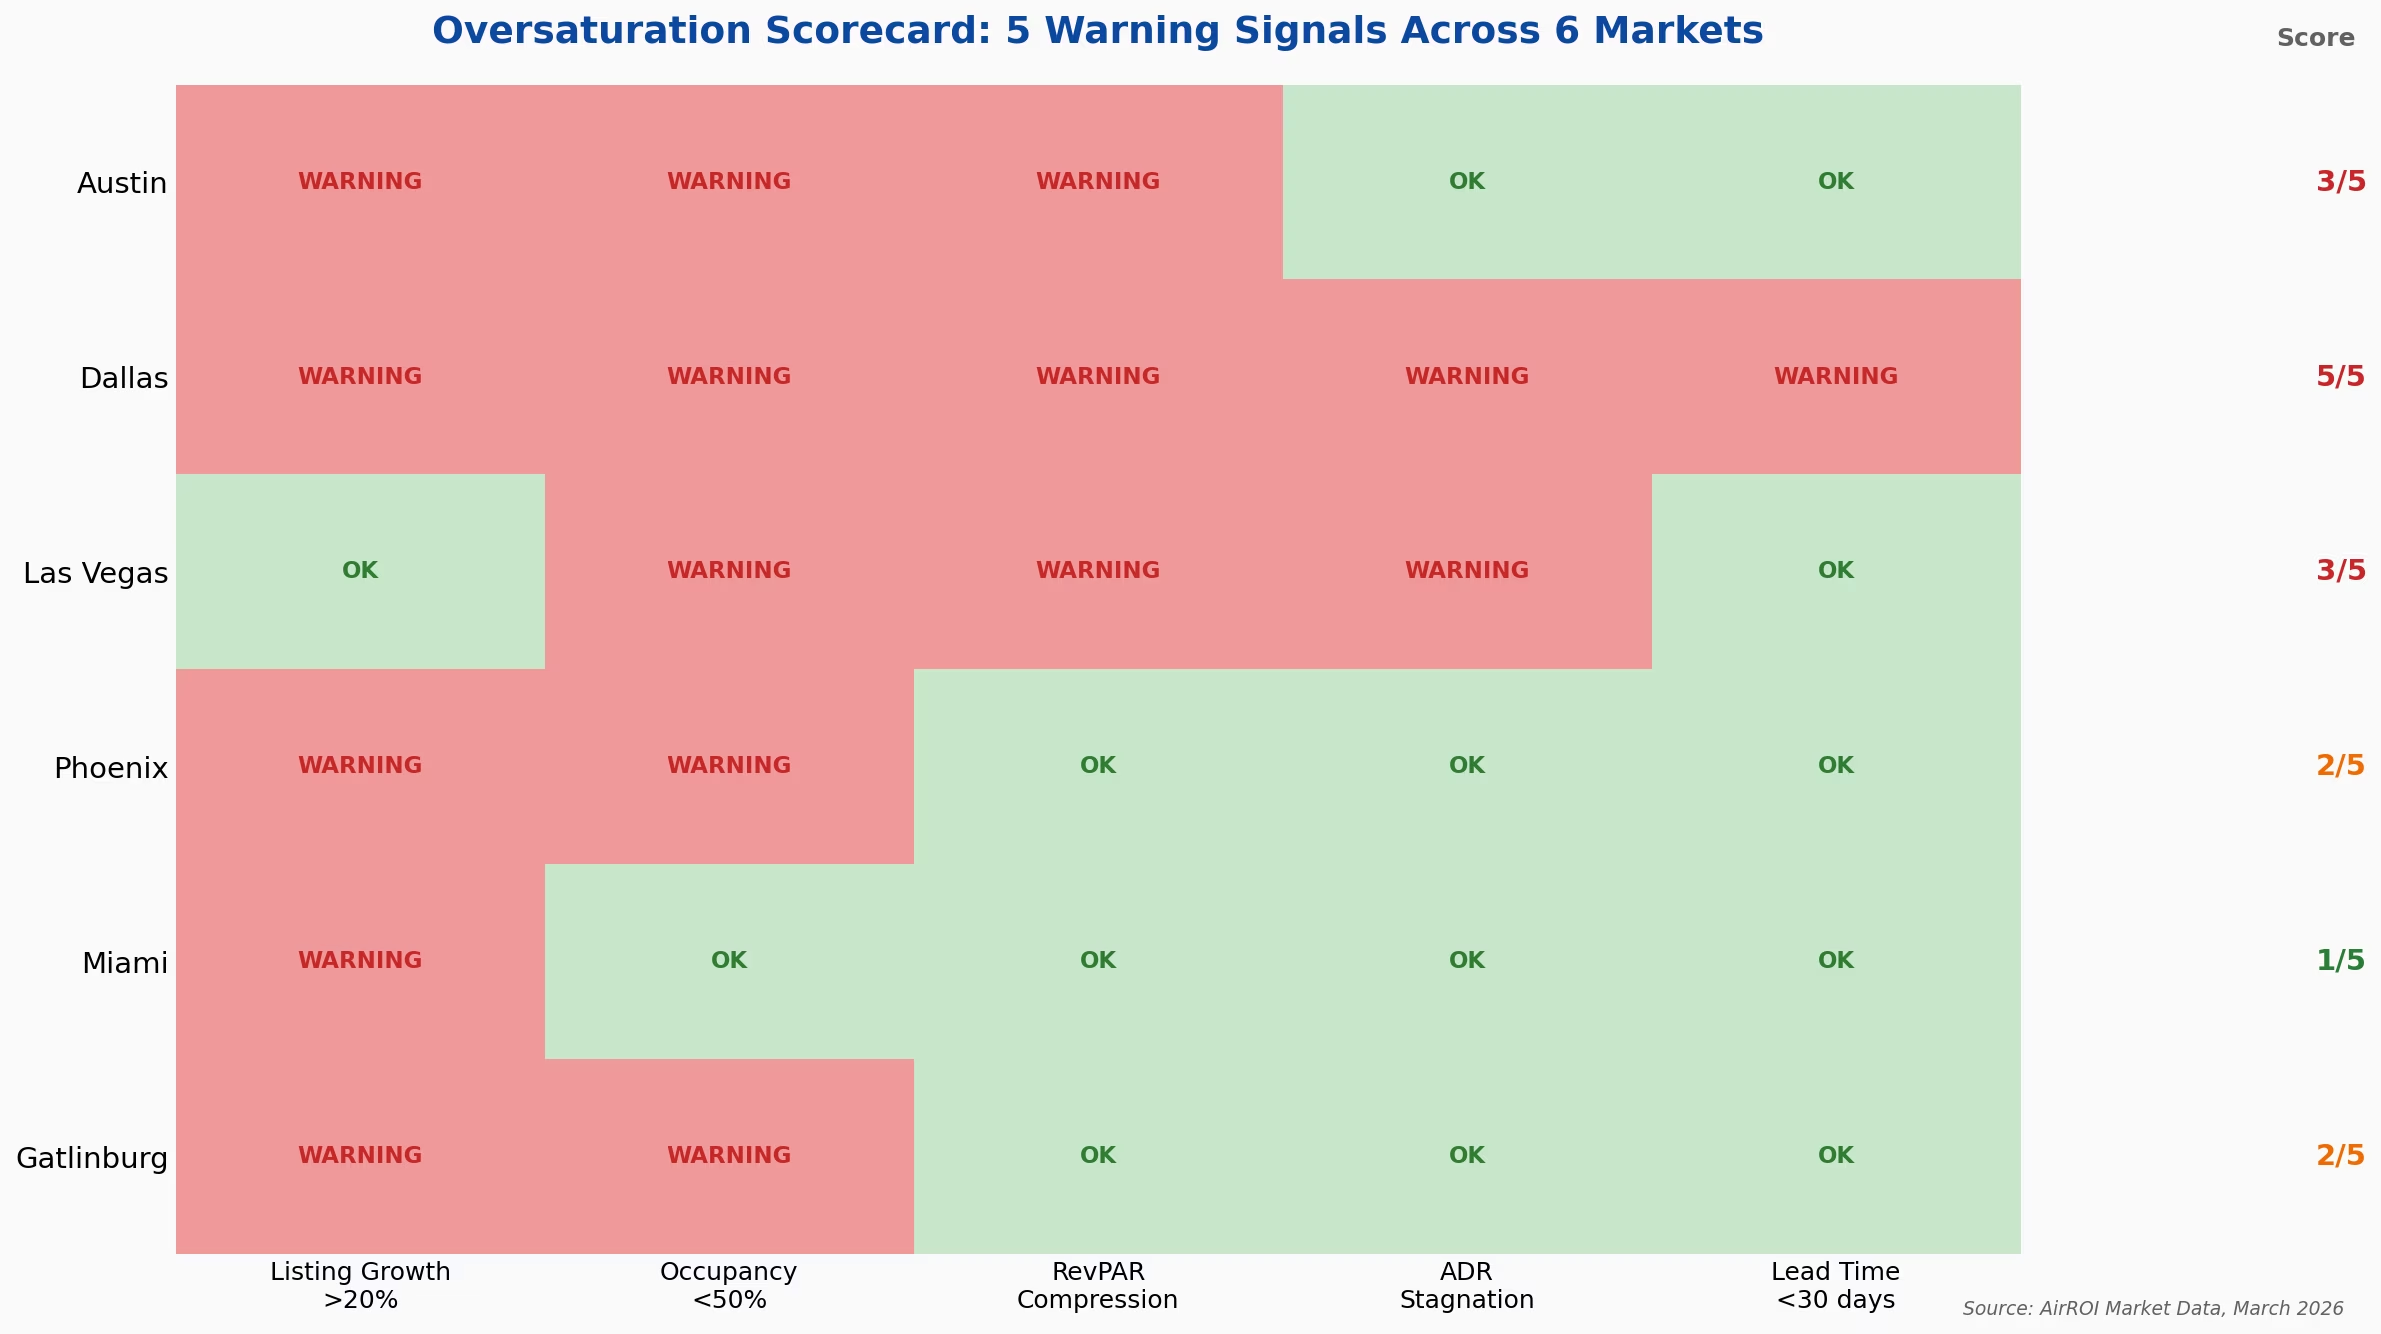
Markets triggering three or more signals -- Austin (3/5), Dallas (5/5), Las Vegas (3/5) -- warrant extreme caution. Markets triggering one or fewer -- Miami (1/5) -- represent lower-risk opportunities, though individual property analysis remains essential.
Applying the Scorecard: Austin vs. Gatlinburg
The scorecard's power emerges when comparing two markets with similar supply growth rates but opposite outcomes.
Austin triggers three signals. Its 9,289 active listings compete for a tourist and business-travel demand base that grows incrementally at best. AirROI data shows the bottom quartile earning $32/night RevPAR -- less than $960/month. An investor who purchased a 2BR condo in East Austin in early 2024, projecting $55,000 in annual revenue based on 2022 numbers, now faces a reality where even the market median produces $70/night ($2,100/month). After a $2,800 mortgage and $1,200 in operating costs, the math turns negative below the 60th percentile.
Gatlinburg triggers two signals (listing growth and occupancy) but neither produces the downstream effects seen in Austin. Why? Three structural differences absorb the new supply:
- Smoky Mountains National Park draws 12.5 million visitors annually -- a demand engine no metro can replicate
- Limited hotel supply in the mountain geography means STRs face less competitive substitution
- 56-day booking lead times indicate guests plan and commit weeks in advance, signaling robust forward demand
The result: Gatlinburg's median annual revenue of $40,582 is nearly double Austin's $21,032, and the property at the 75th percentile earns $315/night RevPAR in peak months. Supply growth alone does not predict oversaturation. The ratio of supply growth to demand absorption does.
The December 2025 data underscores this divergence. While Austin's RevPAR fell to $117/night that month, Gatlinburg's surged to $250/night -- a seasonal peak driven by holiday visitors booking mountain cabins weeks in advance. During the same period, Dallas RevPAR remained below $120 and Las Vegas hovered near $129. The markets with the strongest seasonal demand profiles consistently weather supply growth better than metros relying on steady-state business or leisure travel.
Markets That Defy the Trend
Regulatory moats limiting new supply. New York City's Local Law 18 eliminated thousands of listings in 2023 -- Airbnb removed over 100,000 listings platform-wide in March 2024 alone as regulatory compliance tightened. The hosts who remained compliant now enjoy higher occupancy and pricing power. Jersey City and Newark benefit directly from NYC's restrictions -- AirDNA forecasts +5.6% RevPAR growth there for 2026, precisely because supply cannot flood the market. Markets with strict permitting requirements create barriers to entry that protect existing operators from the supply deluge affecting unregulated cities like Austin and Dallas.
Long booking lead times signaling advance demand. Gatlinburg's 56-day average booking lead time stands in sharp contrast to Dallas's 27 days. Longer lead times mean guests are planning trips in advance rather than scrolling through abundant last-minute options. This metric serves as a demand-confidence indicator -- when lead times contract, the market is softening.
"The era of 'list it and forget it' passive income models has ended. Hosts with differentiated properties and strong branding are more likely to succeed than those relying on generic listings." -- Cenk Demircan, founder of Elite Coaching Circle
The Regulatory Moat Advantage
Regulation is typically framed as a threat to STR operators, but AirROI data suggests it functions as a competitive moat for compliant hosts. In markets where licensing requirements, night caps, or owner-occupancy rules limit new listings, existing operators face less competition and sustain higher revenue per property.
Interestingly, Dallas appears on this list despite triggering all five oversaturation signals. The World Cup represents a temporary demand injection that could lift even oversaturated markets -- but only for the duration of the event. Investors should not confuse a one-time demand spike with structural market health. The scorecard evaluates long-term fundamentals, not short-term catalysts.
What This Means for Investors in 2026
The short-term rental market correction is not a reason to avoid STR investing entirely. It is a reason to invest with precision. AirDNA's assessment that 2026 represents favorable conditions is supported by slowing national supply growth (projected 4.6%, well below the 20%+ peaks of 2021-2022) and ADR gains of 1.5%. But these national averages mask the market-by-market variation that determines individual returns.
Here is a three-step framework for evaluating any market in 2026:
Step 2: Run the 5-signal scorecard. Apply the five oversaturation signals outlined above. Three or more triggered signals indicate a market where per-listing revenue will likely continue declining. Zero to one triggered signals indicate a market where supply-demand balance remains favorable.
Step 3: Analyze the percentile distribution. The most critical question is not "what is the market average?" but "can I afford to be at the 25th percentile?" If the P25 RevPAR in your target market cannot cover your monthly carrying costs (mortgage + operating expenses), the market is too risky regardless of its average performance. In Austin, the P25 RevPAR of $32/night generates $960/month -- insufficient to service most investment properties.
But differentiation has limits. No amount of optimization can overcome a market where 45% occupancy is the structural ceiling. An investor who executes flawlessly on property quality, pricing strategy, and guest communication in Austin may reach the 75th percentile -- earning $133/night RevPAR or roughly $48,000 annually. The same investor deploying the same strategies in Gatlinburg reaches a 75th percentile of $137/night RevPAR but at a higher ADR floor ($367 vs. $294), producing stronger absolute returns with less competitive pressure.
"Hype runs ahead of fundamentals." -- Cenk Demircan, founder of Elite Coaching Circle
The investors who thrive in 2026 will be those who let data replace narrative. The "Airbnb is profitable" thesis is too broad. The "Airbnb bust" thesis is too narrow. The truth lives in the market-level metrics -- and the scorecard that separates oversaturated metros from resilient vacation markets with structural demand.
The short-term rental market correction is ultimately a story of market selection. AirROI's data across six markets demonstrates that a single investment decision -- choosing Gatlinburg over Austin, for instance -- can mean the difference between $40,582 in annual revenue and $21,032. That delta, compounded over a five- or ten-year hold, represents hundreds of thousands of dollars in cumulative returns. In the post-pandemic STR market, the highest-leverage decision an investor makes is not which property to buy, but which market to enter. Let the data make that choice.
Frequently Asked Questions
The U.S. STR market is oversaturated in specific metros, not universally. AirROI data shows occupancy below 50% in Austin (45%), Dallas (45%), and Las Vegas (42%), all markets where supply grew 17-34% year-over-year. Vacation-driven markets like Gatlinburg maintain RevPAR of $177/night despite similar supply growth because demand fundamentals remain strong.
Austin, Dallas, and Las Vegas show the clearest oversaturation signals as of early 2026. Dallas triggers all five warning signals in AirROI's oversaturation scorecard: 34% listing growth, 45% occupancy, RevPAR compression, ADR stagnation, and booking lead times under 30 days. Phoenix and Miami show mixed signals with seasonal variation.
Track five signals: listing growth exceeding 20% annually, occupancy below 50%, RevPAR declining year-over-year, ADR stagnation despite falling occupancy, and booking lead times under 30 days. Markets showing three or more of these signals warrant extreme caution. Use AirROI Atlas to check these metrics for any U.S. market for free.
Vacation-driven markets with strong tourism demand and limited hotel supply remain profitable. AirROI data shows Gatlinburg generating $40,582 in median annual revenue per listing with $177 RevPAR. Markets with regulatory moats like Jersey City (benefiting from NYC restrictions) and resort destinations like Destin (68% occupancy, $310 ADR) also outperform.
Dynamic pricing narrows the revenue gap but cannot fully overcome oversaturation. In Austin, the top 10% of listings earn $231/night RevPAR while the bottom quartile earns $32/night -- a 7.3x gap that even optimal pricing cannot close when base occupancy sits at 45%. Dynamic pricing is necessary but not sufficient in markets with structural oversupply.