Patong, Phuket Province Airbnb Market Data 2026: STR Report & Statistics
How much can you earn on Airbnb in Patong, Phuket Province? Based on AirROI's 2026 dataset (July 2025 – June 2026), the short answer is $17,740 per year — at a $180 nightly rate, 36.8% occupancy, and a $65 RevPAR that reflects moderate rate-to-revenue efficiency with room to optimize.
With 1,553 active listings and moderate demand with room for well-positioned listings to outperform, Patong is an established vacation rental market. Supply has held steady while nightly rates moved higher — a market where hosts who optimize for bookability can unlock the full value of rising rates. Balancing rate strategy with occupancy is the key lever, and hosts who get it right will outperform.
Regulation is low with minimal registration requirements, pointing to an operator-friendly environment. For data-driven hosts, the opportunity lies in reading these signals and positioning accordingly.

Table of Contents [hide] [show]
What Are the Key Airbnb Metrics in Patong?
In Patong, the headline Airbnb metrics are $17,740 in average annual revenue,36.8% occupancy, $180 ADR, and $65 in RevPAR, and guests book about 44 days in advance.
How Much Do Airbnb Hosts Earn Monthly in Patong?
Understanding the monthly revenue variations for Airbnb listings in Patong is key to maximizing your short term rental income potential. Seasonality significantly impacts earnings. Our analysis, based on data from the past 12 months, shows that the peak revenue month for STRs in Patong is typically January, while June often presents the lowest earnings, highlighting opportunities for strategic pricing adjustments during shoulder and low seasons. Explore the typical Airbnb income in Patong across different performance tiers:
- Best-in-class properties (Top 10%) achieve $5,451+ monthly, often utilizing dynamic pricing and superior guest experiences.
- Strong performing properties (Top 25%) earn $2,493 or more, indicating effective management and desirable locations/amenities.
- Typical properties (Median) generate around $1,195 per month, representing the average market performance.
- Entry-level properties (Bottom 25%) see earnings around $478, often with potential for optimization.
Average Monthly Airbnb Earnings Trend in Patong
What Is the Monthly Airbnb Occupancy Rate in Patong?
Maximize your bookings by understanding the Patong STR occupancy trends. Seasonal demand shifts significantly influence how often properties are booked. Typically, Januarysees the highest demand (peak season occupancy), while June experiences the lowest (low season). Effective strategies, like adjusting minimum stays or offering promotions, can boost occupancy during slower periods. Here's how different property tiers perform in Patong:
- Best-in-class properties (Top 10%) achieve 82%+ occupancy, indicating high desirability and potentially optimized availability.
- Strong performing properties (Top 25%) maintain 65% or higher occupancy, suggesting good market fit and guest satisfaction.
- Typical properties (Median) have an occupancy rate around 38%.
- Entry-level properties (Bottom 25%) average 17% occupancy, potentially facing higher vacancy.
Average Monthly Occupancy Rate Trend in Patong
What Is the Average Airbnb Nightly Rate in Patong?
Effective short term rental pricing strategy in Patong involves understanding monthly ADR fluctuations. The Average Daily Rate (ADR) for Airbnb in Patong typically peaks in February and dips lowest during September. Leveraging Airbnb dynamic pricing tools or strategies based on this seasonality can significantly boost revenue. Here's a look at the typical nightly rates achieved:
- Best-in-class properties (Top 10%) command rates of $383+ per night, often due to premium features or locations.
- Strong performing properties (Top 25%) achieve nightly rates of $171 or more.
- Typical properties (Median) charge around $87 per night.
- Entry-level properties (Bottom 25%) earn around $52 per night.
Average Daily Rate (ADR) Trend by Month in Patong
What Is the RevPAR for Airbnb in Patong?
RevPAR in Patong is currently $65. Because RevPAR combines nightly rates with realized occupancy, it is one of the cleanest ways to compare how efficiently listings turn demand into revenue across the market.
- Entry-level properties (Bottom 25%) see $17 RevPAR.
- Typical properties (Median) generate $35 RevPAR.
- Strong performers (Top 25%) earn $67 RevPAR.
- Best-in-class (Top 10%) achieve $147 RevPAR.
Average Monthly RevPAR Trend in Patong
RevPAR Insights for Patong
- The average RevPAR in Patong is $65. This metric combines nightly rates with realized occupancy, making it one of the best single-number indicators of market efficiency.
- The gap between the top 10% ($147) and bottom 25% ($17) is $130, indicating significant performance disparity driven by property quality, pricing strategy, and location.
- RevPAR peaks in Jan and bottoms out in Jun, mirroring the broader seasonal demand pattern and suggesting opportunities for dynamic pricing.
Recommendations for Hosts
- Track your own RevPAR monthly against these Patong benchmarks. If your RevPAR falls below the median of $35, examine whether low occupancy or low ADR is the primary drag.
- Top-quartile listings achieve $67+ RevPAR through a combination of competitive pricing, strong reviews, and strategic amenities. Target this tier through incremental improvements.
- Use RevPAR rather than revenue alone when comparing properties of different sizes — it normalizes for available nights and gives a more accurate picture of performance.
Get Live Patong Market Intelligence 👇
Explore Real-time Analytics
When Is the Peak Season for Airbnb in Patong?
Patong's peak Airbnb season falls in January, February, December, while the softest stretch is May, June, September. Overall, the market shows highly seasonal trends requiring careful strategy, which should guide pricing, minimum stays, and cash-flow planning.
Peak Season (January, February, December)
- Revenue averages $3,353 per month
- Occupancy rates average 49.7%
- Daily rates average $217
Shoulder Season
- Revenue averages $2,250 per month
- Occupancy maintains around 42.4%
- Daily rates hold near $165
Low Season (May, June, September)
- Revenue drops to average $1,672 per month
- Occupancy decreases to average 32.4%
- Daily rates adjust to average $155
Seasonality Insights for Patong
- Airbnb seasonality in Patong is pronounced. Revenue swings sharply between peak and low months, which means pricing strategy, minimum-stay settings, and cash reserves all need to account for extended slower periods.
- During the high season, the absolute peak month showcases Patong's highest earning potential, with monthly revenues climbing to $3,759, occupancy reaching 53.6%, and ADRs peaking at $224.
- Conversely, the slowest single month marks the market's lowest point — revenue may dip to $1,579, occupancy could drop to 27.9%, and ADRs may adjust to $138.
- Lower occupancy paired with meaningful seasonality means hosts in Patong need to maximize every peak-season booking and seriously consider whether off-season pricing adjustments or minimum-stay changes can capture incremental revenue.
Seasonal Strategies for Maximizing Profit
- Peak Season: Maximize revenue through premium pricing and potentially longer minimum stays. Ensure high availability and consider tightening cancellation policies to reduce last-minute gaps.
- Low Season: Offer competitive pricing, extended-stay discounts, and flexible cancellation policies. Target off-season travelers like remote workers, budget-conscious guests, and travelers with flexible schedules.
- Shoulder Seasons: Implement dynamic pricing that bridges peak and low rates. Target weekend travelers, local events, and business visitors. Slightly more flexible terms than peak season can help maintain occupancy without deep discounting.
- In a highly seasonal market like Patong, building a cash reserve during the top months is essential for covering fixed costs during the slow period. Automated pricing tools can help capture demand shifts in real time.
Do You Need a License for Airbnb in Patong?
Patong, Phuket Province, Thailand currently shows a low regulation profile despite having 1,553 active listings. Larger markets with light regulation can attract new supply quickly, but that also means regulatory frameworks may evolve as local governments respond to growth — staying informed protects your investment. Always verify the latest short-term rental regulations and Airbnb license requirements directly with local government authorities for Patong to ensure full compliance before hosting.
(Source: AirROI data, 2026, finding no licensed listings among those analyzed)
What Are the Best Neighborhoods for Airbnb in Patong?
Patong is a large short-term rental market, and performance varies significantly by location within the city. The neighborhoods below are among the most active areas for Airbnb hosts — each with distinct guest demographics, demand drivers, and local attractions. Use this as a starting point for neighborhood-level investment analysis in Patong, Phuket Province.
| Neighborhood / Area | Why Host Here? (Target Guests & Appeal) | Key Attractions & Landmarks |
|---|---|---|
| Patong Beach | The most famous beach in Phuket, known for its vibrant nightlife, water sports, and beach activities. It attracts millions of tourists each year looking for sun and fun. | Patong Beach, Bangla Road, Jungceylon Shopping Mall, Paradise Beach, Simon Cabaret |
| Kalim Beach | Just north of Patong, Kalim Beach offers a quieter alternative with stunning views and a more relaxed atmosphere, ideal for couples and families. | Kalim Beach, Kalim Seafood, Shopping at local markets, Wat Suwan Khiri Wong |
| Tri Trang Beach | A beautiful, tranquil beach area perfect for those seeking a peaceful retreat away from the bustling Patong centre while still being close to attractions. | Tri Trang Beach, Freedom Beach, Siam Niramit Phuket, Sea Kayaking |
| Nanai Road | A bustling street that offers a taste of local life with numerous guesthouses, shops, and restaurants. It's popular among budget travelers who want access to Patong's amenities. | Nanai Road markets, Local restaurants, Massage parlors, Convenience stores |
| Sai Nam Yen | A lesser-known area that offers beautiful views and proximity to Patong but with a more local and authentic living experience. | Local temples, Markets, Views over Patong Bay |
| Baan Khai | An upcoming area that combines local charm with modern convenience, attracting those looking to invest in a more laid back atmosphere close to Patong. | Local cultural spots, Beaches, Phuket Elephant Sanctuary |
| Freedom Beach | Accessed mainly by boat, this stunning beach is a hidden gem attracting visitors looking for a more secluded beach experience. | Freedom Beach, Snorkeling spots, Scenic viewpoints |
| The Marina | A new development area aiming to attract high-end guests with luxury villas and waterfront properties in proximity to the beach and entertainment. | Marina facilities, Water sports, Luxury dining, Boat tours |
With 8 distinct neighborhoods showing meaningful short-term rental activity, Patong offers diversification within a single market. Investors can tailor their strategy — from high-turnover tourist zones to quieter residential areas that attract longer stays and remote workers.
What Types of Properties Are on Airbnb in Patong?
Room Type Distribution
Property Type Distribution
Market Composition Insights for Patong
- The Patong Airbnb market composition is heavily skewed towards Entire Home/Apt listings, which make up 63.4% of the 1,553 active rentals. This indicates strong guest preference for privacy and space.
- However, a notable 31.7% share for Private Rooms suggests opportunities for budget-conscious travelers or hosts renting out spare rooms.
- Looking at the property type distribution in Patong, Apartment/Condo properties are the most common (56.4%), reflecting the local real estate landscape.
- Houses represent a significant 17.2% portion, catering likely to families or larger groups.
- The presence of 25.6% Hotel/Boutique listings indicates integration with traditional hospitality.
- Smaller segments like others, outdoor/unique (combined 0.8%) offer potential for unique stay experiences.
Patong Airbnb Room Capacity Analysis (2026): Bedroom Distribution
Distribution of Listings by Number of Bedrooms
Room Capacity Insights for Patong
- The dominant room capacity in Patong is 1 bedroom listings, making up 50.2% of the market. This suggests a strong demand for properties suitable for couples or solo travelers.
- Together, 1 bedroom and 2 bedrooms properties represent 66.2% of the active Airbnb listings in Patong, indicating a high concentration in these sizes.
- With over half the market (50.2%) consisting of studios or 1-bedroom units, Patong is particularly well-suited for individuals or couples.
Patong Vacation Rental Guest Capacity Trends (2026)
Distribution of Listings by Guest Capacity
Guest Capacity Insights for Patong
- The most common guest capacity trend in Patong vacation rentals is listings accommodating 2 guests (42.3%). This suggests the primary traveler segment is likely couples or solo travelers.
- Properties designed for 2 guests and 3 guests dominate the Patong STR market, accounting for 57.8% of listings.
- A significant 42.5% of listings cater specifically to 1-2 guests, highlighting strong demand from couples and solo travelers in Patong.
- 19.3% of properties accommodate 6+ guests, serving the market segment for larger families or group travel in Patong.
- On average, properties in Patong are equipped to host 3.4 guests.
How Do Listings in Patong Compare on Quality?
Listing quality in Patong can be approximated through presentation depth, bedroom count, and how often hosts disclose exact locations. These signals show how professionally the local supply base is merchandised.
Listing Quality Insights for Patong
- At 34.5 photos per listing on average, Patong hosts invest well in visual presentation. Listings with 20+ photos consistently outperform in search ranking and conversion.
- 35.2% of listings show their exact location. Lower disclosure rates can increase booking hesitation — guests want to know exactly where they are staying.
Recommendations for Hosts
- Enable exact location if possible — it removes a common source of guest uncertainty and can improve your listing's position in map-based searches.
- Use these quality indicators as a self-audit checklist. Listings that exceed the Patong averages across all three metrics are better positioned for premium pricing.
What Amenities Do Airbnb Guests Expect in Patong?
Amenity Prevalence
Amenity Insights for Patong
- Essential amenities in Patong that guests expect include: Wifi, Air conditioning, TV. Lacking these (any) could significantly impact bookings.
- Popular amenities like Hair dryer, Hangers, Hot water are common but not universal. Offering these can provide a competitive edge.
Recommendations for Hosts
- Ensure your listing includes all essential amenities for Patong: Wifi, Air conditioning, TV.
- Prioritize adding missing essentials: Wifi, Air conditioning, TV.
- Consider adding popular differentiators like Hair dryer or Hangers to increase appeal.
- Highlight unique or less common amenities you offer (e.g., hot tub, dedicated workspace, EV charger) in your listing description and photos.
- Regularly check competitor amenities in Patong to stay competitive.
Which Airbnb Amenities Boost Revenue in Patong?
Not every amenity matters equally. This table focuses on the amenities most associated with higher revenue in Patong, which makes it more useful for prioritizing upgrades than a simple popularity list alone.
| Amenity | Prevalence | Revenue With | Revenue Without | Revenue Uplift |
|---|---|---|---|---|
Game consoleHigh opportunity | 0.5% | $104,935 | $17,288 | 507.0% |
Barbecue utensilsHigh opportunity | 4.4% | $85,043 | $14,611 | 482.1% |
Kitchen | 62.8% | $25,465 | $4,708 | 440.9% |
Oven | 12.4% | $59,034 | $11,880 | 396.9% |
BBQ grill | 10.2% | $60,339 | $12,881 | 368.4% |
Sound systemHigh opportunity | 5.9% | $67,633 | $14,634 | 362.2% |
Baking sheetHigh opportunity | 3.6% | $67,523 | $15,878 | 325.3% |
DishwasherHigh opportunity | 6.4% | $62,048 | $14,723 | 321.4% |
High chair | 10.3% | $52,326 | $13,767 | 280.1% |
Baby bathHigh opportunity | 1.9% | $62,661 | $16,855 | 271.8% |
Revenue Impact Insights for Patong
- Game console tops the revenue impact list with a 507.0% uplift — listings with this amenity earn $104,935 vs. $17,288 without it.
- High-opportunity amenities — Game console, Barbecue utensils, Sound system — combine revenue uplift above 100% with prevalence under 10%, meaning most competitors haven't adopted them yet.
Recommendations for Hosts
- Prioritize adding Game console — it has the best combination of high revenue impact and low market saturation in Patong.
- Focus your upgrade budget on amenities in the top half of this table. Below-median amenities may improve guest experience but contribute less to revenue growth.
- Highlight revenue-impacting amenities prominently in your listing title, photos, and description — guests can't value what they don't notice.
Dive Deeper: Advanced Patong STR Market Data (2026)
Ready to unlock more insights? AirROI provides access to advanced metrics and comprehensive Airbnb data for Patong. Explore detailed analytics beyond this report to refine your investment strategy, optimize pricing, and maximize your vacation rental profits.
Explore Advanced MetricsPatong Airbnb Guest Demographics & Profile Analysis (2026)
Guest Profile Summary for Patong
- The typical guest profile for Airbnb in Patong consists of predominantly international visitors (99%), with top international origins including India, typically belonging to the Post-2000s (Gen Z/Alpha) group (50%), primarily speaking English or Spanish.
- Domestic travelers account for 0.7% of guests.
- Key international markets include United States (19.1%) and India (11.4%).
- Top languages spoken are English (47.5%) followed by Spanish (6.9%).
- A significant demographic segment is the Post-2000s (Gen Z/Alpha) group, representing 50% of guests.
Recommendations for Hosts
- Focus marketing internationally, particularly towards travelers from India.
- Tailor amenities and listing descriptions to appeal to the dominant Post-2000s (Gen Z/Alpha) demographic (e.g., highlight fast WiFi, smart home features, local guides).
- Highlight unique local experiences or amenities relevant to the primary guest profile.
- Consider seasonal promotions aligned with peak travel times for key origin markets.
What Are Airbnb Guest Ratings in Patong?
Listings in Patong average 4.63 out of 5 overall, with about 42.1 reviews per active listing and 18.5% of listings carrying the Guest Favorite badge.
Rating Breakdown by Category
Guest Rating Insights for Patong
- An average rating of 4.63 places Patong in solid territory. Most guests leave satisfied, though there is room for hosts to push toward the top tier.
- The strongest subcategory is Communication (4.77), while Value (4.58) trails behind — a useful signal for hosts looking to prioritize upgrades.
- 18.5% of listings carry the Guest Favorite badge, a strong trust signal that can meaningfully lift click-through and booking rates.
Recommendations for Hosts
- Focus improvement efforts on Value — even small gains in the weakest subcategory can lift overall ratings and search ranking.
- Encourage guests to leave reviews after checkout. Listings with more reviews rank higher in search results and convert browsers into bookers more effectively.
- With only 18.5% of listings earning Guest Favorite status, hosts who consistently exceed expectations have a clear competitive advantage.
Patong Airbnb Booking Patterns (2026): Available vs. Booked Days
Available Days Distribution
Booked Days Distribution
Booking Pattern Insights for Patong
- The most common availability pattern in Patong falls within the 271-366 days range, representing 58% of listings. This suggests many properties have significant open periods on their calendars.
- Approximately 80.2% of listings show high availability (181+ days open annually), indicating potential for increased bookings or specific owner usage patterns.
- For booked days, the 1-30 days range is most frequent in Patong (30.2%), reflecting common guest stay durations or potential owner blocking patterns.
- A notable 20.9% of properties secure long booking periods (181+ days booked per year), highlighting successful long-term rental strategies or significant owner usage.
How Far in Advance Do Guests Book Airbnb in Patong?
Average Booking Lead Time by Month
Booking Lead Time Insights for Patong
- The overall average booking lead time for vacation rentals in Patong is 44 days.
- Guests book furthest in advance for stays during December (average 62 days), likely coinciding with peak travel demand or local events.
- The shortest booking windows occur for stays in May (average 30 days), indicating more last-minute travel plans during this time.
- Seasonally, Winter (56 days avg.) sees the longest lead times, while Summer (33 days avg.) has the shortest, reflecting typical travel planning cycles.
Recommendations for Hosts
- Use the overall average lead time (44 days) as a baseline for your pricing and availability strategy in Patong.
- For December stays, consider implementing length-of-stay discounts or slightly higher rates for bookings made less than 62 days out to capitalize on advance planning.
- Target marketing efforts for the Winter season well in advance (at least 56 days) to capture early planners.
- Monitor your own booking lead times against these Patong averages to identify opportunities for dynamic pricing adjustments.
What Is the Average Length of Stay for Airbnb in Patong?
Guests in Patong stay about 5.9 nights on average, generating roughly 25,423 reservations and 16.5 bookings per listing in the latest AirROI dataset. The most common check-in time is 2:00 PM and check-out is 12:00 PM.
Monthly Length of Stay in Patong
Check-in Time Distribution
Check-out Time Distribution
Stay Pattern Insights for Patong
- A mid-range stay length points to leisure-driven demand — weekend getaways and short vacations. Hosts should optimize for quick turnover efficiency while keeping the guest experience smooth.
- 16.5 bookings per listing is a manageable pace that balances revenue with operational overhead.
- Stay lengths peak in Jan (6.7 nights) and shorten in May (4.9 nights). Adjust minimum-night requirements seasonally to match.
Recommendations for Hosts
- Leverage the longer-stay pattern by offering weekly discounts — even 5-10% off can convert browsing into bookings for guests considering an extended stay.
- Set your check-in time to match or beat the market standard of 2:00 PM. Offering early check-in flexibility can be a low-cost differentiator.
- Monitor length-of-stay seasonality to adjust minimum-night requirements — longer minimums during peak periods maximize revenue while shorter minimums fill gaps in shoulder seasons.
Patong Airbnb Minimum Stay Requirements Analysis
Distribution of Listings by Minimum Night Requirement
1 Night
691 listings
44.6% of total
2 Nights
116 listings
7.5% of total
3 Nights
150 listings
9.7% of total
4-6 Nights
98 listings
6.3% of total
7-29 Nights
89 listings
5.7% of total
30+ Nights
407 listings
26.2% of total
Key Insights
- The most prevalent minimum stay requirement in Patong is 1 Night, adopted by 44.6% of listings. This highlights the market's preference for shorter, flexible bookings.
- A significant segment (26.2%) caters to monthly stays (30+ nights) in Patong, pointing to opportunities in the extended-stay market.
Recommendations
- Align with the market by considering a 1 Night minimum stay, as 44.6% of Patong hosts use this setting.
- Explore offering discounts for stays of 30+ nights to attract the 26.2% of the market seeking extended stays.
- Adjust minimum nights based on seasonality – potentially shorter during low season and longer during peak demand periods in Patong.
Patong Airbnb Cancellation Policy Trends Analysis (2026)
Super Strict 60 Days
14 listings
0.9% of total
Super Strict 30 Days
17 listings
1.1% of total
Limited
33 listings
2.1% of total
Flexible
306 listings
19.7% of total
Moderate
254 listings
16.4% of total
Firm
550 listings
35.4% of total
Strict
379 listings
24.4% of total
Cancellation Policy Insights for Patong
- The prevailing Airbnb cancellation policy trend in Patong is Firm, used by 35.4% of listings.
- A majority (59.8%) of hosts in Patong utilize Firm or Strict policies, indicating a market where hosts prioritize booking security.
Recommendations for Hosts
- Consider adopting a Firm policy to align with the 35.4% market standard in Patong.
- Regularly review your cancellation policy against competitors and market demand shifts in Patong.
How Much Are Airbnb Cleaning Fees in Patong?
Cleaning fees in Patong are meaningful operating levers, not just pass-through charges. What matters most is how often hosts charge them, how high they run relative to market norms, and how large a share of gross revenue they consume.
Cleaning Fee Insights for Patong
- About 52.7% of Patong listings charge a cleaning fee — a mixed market where some hosts absorb the cost into nightly rates while others break it out.
- The gap between the average ($63) and median ($21) cleaning fee indicates some high-end properties are pulling the average up considerably.
- Cleaning fees represent 3.8% of gross revenue on average — a modest component of the overall booking price.
Recommendations for Hosts
- Price your cleaning fee competitively against the Patong median of $21. Fees significantly above market norms can deter bookings, especially for shorter stays.
- Monitor competitor cleaning fees regularly. Airbnb's search algorithm factors in total price, so a well-calibrated cleaning fee can improve your listing's ranking.
What Do the Top Airbnb Listings in Patong Look Like?
Benchmark your potential! Explore examples of top-performing Airbnb properties in Patongbased on Trailing Twelve Month (TTM) revenue. Analyze their characteristics, revenue, occupancy rate, and ADR to understand what drives success in this market.
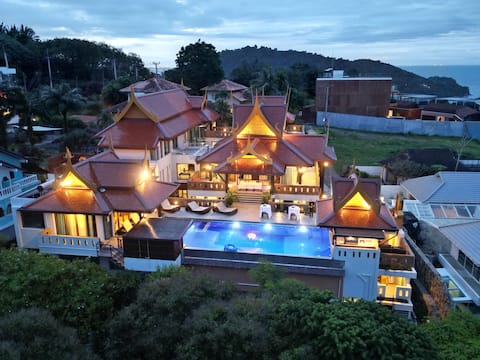
13-bedroom Exclusive & Private Villa Patong Phuket
Entire Place • 13 bedrooms
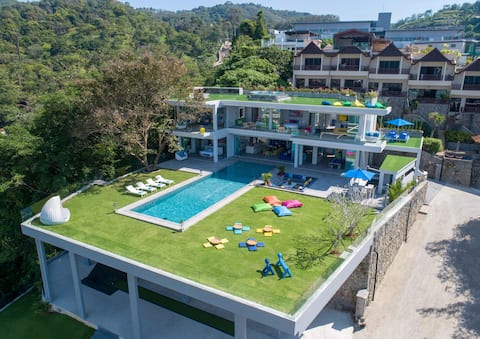
Villa Enjoy - Modern Luxury in Patong
Entire Place • 5 bedrooms
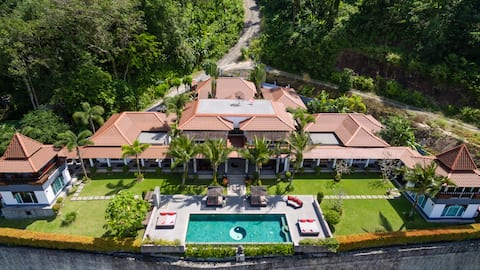
Wondrous 8BR Boutique Villa in Patong w/ SEAVIEW
Entire Place • 8 bedrooms

Kalim Beach House - 7 bed Villa with Beach & Pool
Entire Place • 7 bedrooms
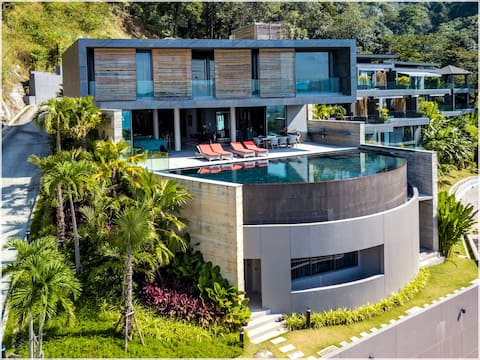
The Cube Ocean View Pool Villa
Entire Place • 4 bedrooms
Luxury Villa in Kamala Beach Villa infinity
Entire Place • 10 bedrooms
Note: Performance varies based on location, size, amenities, seasonality, and management quality. Data reflects the past 12 months.
Who Are the Top Airbnb Hosts in Patong?
Learn from the best! This table showcases top-performing Airbnb hosts in Patong based on the number of properties managed and estimated total revenue over the past year. Analyze their scale and performance metrics.
| Host Name | Properties | Grossing Revenue | Stay Reviews | Avg Rating |
|---|---|---|---|---|
| Three Monkeys Villas Patong | 13 | $1,277,958 | 637 | 4.97/5.0 |
| Leky | 18 | $1,093,506 | 998 | 4.78/5.0 |
| Lofty | 56 | $865,550 | 2085 | 4.36/5.0 |
| Jon | 3 | $687,980 | 115 | 4.97/5.0 |
| Gilles | 15 | $605,188 | 516 | 4.58/5.0 |
| Dr. Supot | 23 | $569,053 | 2532 | 4.81/5.0 |
| Ira | 25 | $560,316 | 2326 | 4.77/5.0 |
| Endless Villas L'Orchidee Resi | 10 | $547,171 | 232 | 4.85/5.0 |
| Nannapat | 1 | $447,472 | 19 | 5.00/5.0 |
| Greg | 15 | $440,826 | 985 | 4.71/5.0 |
Analyzing the strategies of top hosts, such as their property selection, pricing, and guest communication, can offer valuable lessons for optimizing your own Airbnb operations in Patong.
Who Are the Airbnb Hosts in Patong?
Patong has a relatively balanced host base.
Host Profile Insights for Patong
- A 37.0% Superhost share is healthy — enough experienced operators to anchor quality without making the market impenetrable for newcomers.
- 5.3% of listings are professionally managed, reflecting a market still dominated by individual hosts.
- 16.1% of listings have Instant Book enabled. Lower Instant Book adoption means many guests must request approval, which can slow conversions.
- 77.9% of listings use Airbnb's simplified pricing (host-only fee), where the host pays the entire platform service fee and the guest sees one all-in price with no separate Airbnb service charge. High adoption signals a professional, PMS-connected host base — Airbnb mandates simplified pricing for software-connected listings.
Recommendations for Hosts
- Earning Superhost status can significantly improve search ranking and guest trust. Focus on maintaining high response rates, low cancellations, and strong reviews.
- Consider enabling Instant Book — it reduces booking friction and Airbnb's algorithm tends to favor Instant Book listings in search results.
- With 21.6% cohosted listings, there may be a growing local market for property management services.
- Benchmark your host metrics against these Patong averages regularly and adjust your hosting strategy based on what top performers do differently.
Top Professional Management Companies in Patong
These are the highest-grossing professional property management operations in Patong, ranked by total revenue across their portfolio. Their performance metrics offer a benchmark for what institutional-level hosting looks like in this market.
| Company | Listings | Revenue | ADR | Occ. | Rating |
|---|---|---|---|---|---|
| Lofty | 56 | $865,550 | $115 | 48.7% | 4.36/5 |
| Dr. Supot | 23 | $569,053 | $140 | 51.6% | 4.81/5 |
| Ira | 25 | $560,316 | $83 | 71.2% | 4.77/5 |
| Oy | 5 | $393,216 | $460 | 51.7% | 4.95/5 |
| Tachin | 3 | $59,642 | $680 | 19.1% | 5.00/5 |
| Jacob | 1 | $41,036 | $977 | 28.6% | N/A |
| Aleksandra | 2 | $39,706 | $302 | 43.6% | 4.68/5 |
| Busaya | 1 | $25,227 | $247 | 30.1% | 5.00/5 |
| Kong | 8 | $24,882 | $102 | 19.1% | 4.25/5 |
| Dariusz | 1 | $23,993 | $215 | 35.8% | 5.00/5 |
Management Company Insights for Patong
- The leading management company, Lofty, operates 56 listings with $865,550 in gross revenue — a useful benchmark for what scale looks like in Patong.
- Top managers average 13 properties each, suggesting professional management in Patong still operates at a relatively boutique scale.
- Professionally managed listings in the top tier average 4.76/5 in guest ratings — demonstrating that scale and quality can coexist.
Recommendations
- With only 5.3% of listings professionally managed, there may be an opportunity to differentiate through more structured operations and consistent guest experiences.
- Study how top management companies price, position, and maintain their portfolios — their ADR and occupancy rates reflect strategies refined across dozens of listings.
- If you're considering hiring a property manager, compare their portfolio performance against these benchmarks before committing.
How Does Patong's Airbnb Market Compare to Nearby Cities?
How does the Patong Airbnb market stack up against its neighbors? Compare key performance metrics like average monthly revenue, ADR, and occupancy rates in surrounding areas to understand the broader regional STR landscape.
Compared with Haad Klong Jaak, Patong has 6 percentage points lower occupancy and about $47 lower ADR. That helps frame whether this market is winning more on demand, pricing, or both.
| Market | Active Properties | Monthly Revenue | Daily Rate | Avg. Occupancy |
|---|---|---|---|---|
| Ban Khao Pi Lai | 10 | $4,619 | $1746.25 | 23% |
| Pa Khlok | 89 | $4,333 | $856.13 | 30% |
| Ban Khlong Son | 25 | $2,951 | $353.87 | 42% |
| Haad Klong Jaak | 35 | $2,437 | $227.17 | 43% |
| Kamala | 1,064 | $2,190 | $299.61 | 40% |
| Tambon Ao Nang | 77 | $1,913 | $205.99 | 43% |
| Si Sunthon | 165 | $1,882 | $331.38 | 36% |
| Thep Krasattri | 51 | $1,851 | $401.28 | 40% |
| Tengah Island | 72 | $1,795 | $207.02 | 32% |
| Haad Khlong Khong | 93 | $1,751 | $155.94 | 42% |
Frequently Asked Questions About Airbnb in Patong
These quick answers summarize the most common investor and operator questions using AirROI's latest market data for Patong.
How much do Airbnb hosts make in Patong?
Patong hosts earn about $17,740 per year on average, with an average nightly rate of $180 and RevPAR of $65. Those figures describe the typical revenue environment for active listings in Patong, Phuket Province, not the ceiling for the best operators. Source: AirROI 2026 data, Patong market, July 2025 to June 2026.
What is the average Airbnb occupancy rate in Patong?
The average Airbnb occupancy rate in Patong is 36.8%. January is the strongest month and June is the softest, so hosts should expect demand to move meaningfully throughout the year rather than stay flat.
What is the average Airbnb daily rate in Patong?
Listings in Patong average $180 per night. The broader pricing spread also matters: lower-performing listings cluster closer to the lower quartiles, while premium homes can price materially above the city average when demand spikes or listing quality stands out.
How many Airbnb listings are active in Patong?
Patong currently has about 1,553 active Airbnb listings in AirROI's market dataset. That supply count helps explain how competitive the market is, how much depth there is for benchmarking, and whether the market behaves like a niche destination or a scaled urban market.
How strict are short-term rental regulations in Patong?
AirROI currently classifies the short-term rental regulation level in Patong as Low. The dataset also shows about 0.0% of listings with registration evidence. That is a market signal, not legal advice, so hosts should still confirm current licensing and compliance rules locally before listing.
What is the RevPAR for Airbnb in Patong?
RevPAR in Patong is about $65. That metric combines pricing and occupancy into one efficiency number, so it is often a better quick benchmark than ADR alone when investors want to compare how well listings convert nightly rates into realized revenue.
Is Airbnb profitable in Patong?
Occupancy of 36.8% means Patong is a more selective market. Profitability is achievable but requires careful cost management, premium positioning, or targeting longer stays to reduce turnover. Average annual revenue is $17,740, but individual returns depend on property type, location within the city, and the host's operating efficiency.
How far in advance do guests book Airbnb in Patong?
The average booking lead time in Patong is about 44 days — a moderate lead time that gives hosts planning visibility while still benefiting from last-minute bookings. Hosts who understand their market's booking cadence can adjust minimum stays and pricing windows accordingly.
What are the best neighborhoods for Airbnb in Patong?
Based on AirROI's analysis, some of the top neighborhoods for short-term rentals in Patong include Patong Beach, Kalim Beach, Tri Trang Beach. Each area attracts different guest profiles — from business travelers to leisure visitors — so the best location depends on the property type and target audience a host is aiming for. See the full neighborhood breakdown above.
What type of property performs best on Airbnb in Patong?
entire_home listings make up 63.4% of the active supply in Patong. The most common configuration does not always mean the most profitable — operators who identify underserved property types or bedroom counts can sometimes outperform the market average by filling a gap in local supply.
How does Patong compare to nearby Airbnb markets?
Among neighboring markets, Ban Khao Pi Lai posts $55,425 in average annual revenue with 23.0% occupancy, compared to Patong's $17,740 and 36.8%. Comparing nearby markets helps investors understand whether a destination's performance reflects local demand or broader regional trends.
What is the average length of stay in Patong?
The average Airbnb stay length in Patong is about 5.9 nights. That matters for turnover, cleaning operations, and pricing strategy because shorter stays increase changeovers while longer stays can smooth occupancy and reduce operational friction.
What is the average Airbnb guest rating in Patong?
Airbnb listings in Patong average 4.63 out of 5 overall. About 18.5% of listings carry the guest favorite badge, which suggests a meaningful share of inventory is competing on review quality rather than price alone.
Which amenities boost Airbnb revenue in Patong?
Game console and Barbecue utensils are among the strongest revenue-linked amenities in Patong. In AirROI's latest dataset, listings with these amenities outperform those without on average revenue, which makes amenities analysis useful for prioritizing investment and listing upgrades.
Do Airbnb hosts charge cleaning fees in Patong?
Yes. About 52.7% of active Airbnb listings in Patong charge a cleaning fee, and the average fee is $63. The more important operating benchmark is how much of gross revenue that fee consumes, not just the absolute dollar amount.
What percentage of Airbnb hosts are Superhosts in Patong?
At 37.0%, there is a healthy mix of experienced and newer hosts — earning Superhost status can still provide a meaningful visibility boost.
About AirROI Market Data
AirROI tracks over 20 million properties across 190+ countries and maintains 15+ years of historical performance data, making it one of the deepest Airbnb and STR intelligence platforms available. The analytics pipeline aggregates listing-level data monthly — revenue, occupancy, nightly rates, RevPAR, guest demographics, booking patterns, and competitive supply — so investors and operators can benchmark any market against its own history and against neighboring destinations.
Real estate investors, property managers, financial institutions, hedge funds, tourism boards, hospitality consultants, tech platforms, and academic researchers rely on AirROI data to underwrite acquisitions, optimize pricing, model macro trends, and conduct peer-reviewed research. Data is available through in-depth market reports like this one and the Airbnb API with 22 endpoints and an Airbnb MCP Server for AI agents.
AirROI proprietary analytics as of 2026-06-30. Metrics reflect trailing twelve-month aggregates from active listings. Revenue figures are market averages, not projections. Neighborhood descriptions are AI-generated and reviewed for accuracy. For full methodology, see the data methodology page.