Ban Khao Pi Lai, Phang-nga Province Airbnb Market Data 2025: STR Report & Statistics
How much can you earn on Airbnb in Ban Khao Pi Lai, Phang-nga Province? Based on AirROI's 2025 dataset (April 2024 – March 2025), the short answer is $240,203 per year — at a $2,032 nightly rate, 26.8% occupancy, and a N/A RevPAR.
With just 19 active listings, Ban Khao Pi Lai is a micro-market where selective demand that rewards strong listing quality and pricing strategy. Supply declined 50.0% and revenue has grown even as nightly rates softened, pointing to strengthened occupancy among remaining listings. Fewer competitors and resilient demand create favorable conditions for well-run properties.
Regulation is low with minimal registration requirements, pointing to an operator-friendly environment. In a market this size, differentiated listings with strong reviews can capture outsized returns relative to the competition.

Table of Contents [hide] [show]
What Are the Key Airbnb Metrics in Ban Khao Pi Lai?
In Ban Khao Pi Lai, the headline Airbnb metrics are $240,203 in average annual revenue,26.8% occupancy, $2,032 ADR, and $0 in RevPAR, and guests book about 39 days in advance.
How Much Do Airbnb Hosts Earn Monthly in Ban Khao Pi Lai?
Understanding the monthly revenue variations for Airbnb listings in Ban Khao Pi Lai is key to maximizing your short term rental income potential. Seasonality significantly impacts earnings. Our analysis, based on data from the past 12 months, shows that the peak revenue month for STRs in Ban Khao Pi Lai is typically May, while November often presents the lowest earnings, highlighting opportunities for strategic pricing adjustments during shoulder and low seasons. Explore the typical Airbnb income in Ban Khao Pi Lai across different performance tiers:
- Best-in-class properties (Top 10%) achieve $74,753+ monthly, often utilizing dynamic pricing and superior guest experiences.
- Strong performing properties (Top 25%) earn $58,224 or more, indicating effective management and desirable locations/amenities.
- Typical properties (Median) generate around $27,164 per month, representing the average market performance.
- Entry-level properties (Bottom 25%) see earnings around $13,237, often with potential for optimization.
Average Monthly Airbnb Earnings Trend in Ban Khao Pi Lai
What Is the Monthly Airbnb Occupancy Rate in Ban Khao Pi Lai?
Maximize your bookings by understanding the Ban Khao Pi Lai STR occupancy trends. Seasonal demand shifts significantly influence how often properties are booked. Typically, Aprilsees the highest demand (peak season occupancy), while May experiences the lowest (low season). Effective strategies, like adjusting minimum stays or offering promotions, can boost occupancy during slower periods. Here's how different property tiers perform in Ban Khao Pi Lai:
- Best-in-class properties (Top 10%) achieve 54%+ occupancy, indicating high desirability and potentially optimized availability.
- Strong performing properties (Top 25%) maintain 33% or higher occupancy, suggesting good market fit and guest satisfaction.
- Typical properties (Median) have an occupancy rate around 21%.
- Entry-level properties (Bottom 25%) average 12% occupancy, potentially facing higher vacancy.
Average Monthly Occupancy Rate Trend in Ban Khao Pi Lai
What Is the Average Airbnb Nightly Rate in Ban Khao Pi Lai?
Effective short term rental pricing strategy in Ban Khao Pi Lai involves understanding monthly ADR fluctuations. The Average Daily Rate (ADR) for Airbnb in Ban Khao Pi Lai typically peaks in January and dips lowest during September. Leveraging Airbnb dynamic pricing tools or strategies based on this seasonality can significantly boost revenue. Here's a look at the typical nightly rates achieved:
- Best-in-class properties (Top 10%) command rates of $3,199+ per night, often due to premium features or locations.
- Strong performing properties (Top 25%) achieve nightly rates of $2,702 or more.
- Typical properties (Median) charge around $2,109 per night.
- Entry-level properties (Bottom 25%) earn around $1,460 per night.
Average Daily Rate (ADR) Trend by Month in Ban Khao Pi Lai
What Is the RevPAR for Airbnb in Ban Khao Pi Lai?
RevPAR in Ban Khao Pi Lai is currently N/A. Because RevPAR combines nightly rates with realized occupancy, it is one of the cleanest ways to compare how efficiently listings turn demand into revenue across the market.
- Entry-level properties (Bottom 25%) see N/A RevPAR.
- Typical properties (Median) generate N/A RevPAR.
- Strong performers (Top 25%) earn N/A RevPAR.
- Best-in-class (Top 10%) achieve N/A RevPAR.
Average Monthly RevPAR Trend in Ban Khao Pi Lai
RevPAR Insights for Ban Khao Pi Lai
- RevPAR peaks in Jan and bottoms out in Jan, mirroring the broader seasonal demand pattern and suggesting opportunities for dynamic pricing.
Recommendations for Hosts
- Track your own RevPAR monthly against these Ban Khao Pi Lai benchmarks. If your RevPAR falls below the median of N/A, examine whether low occupancy or low ADR is the primary drag.
- Use RevPAR rather than revenue alone when comparing properties of different sizes — it normalizes for available nights and gives a more accurate picture of performance.
Get Live Ban Khao Pi Lai Market Intelligence 👇
Explore Real-time Analytics
When Is the Peak Season for Airbnb in Ban Khao Pi Lai?
Ban Khao Pi Lai's peak Airbnb season falls in May, January, December, while the softest stretch is July, September, November. Overall, the market shows highly seasonal trends requiring careful strategy, which should guide pricing, minimum stays, and cash-flow planning.
Peak Season (May, January, December)
- Revenue averages $47,203 per month
- Occupancy rates average 19.3%
- Daily rates average $2,246
Shoulder Season
- Revenue averages $37,210 per month
- Occupancy maintains around 27.5%
- Daily rates hold near $1,972
Low Season (July, September, November)
- Revenue drops to average $22,104 per month
- Occupancy decreases to average 28.7%
- Daily rates adjust to average $1,896
Seasonality Insights for Ban Khao Pi Lai
- Airbnb seasonality in Ban Khao Pi Lai is pronounced. Revenue swings sharply between peak and low months, which means pricing strategy, minimum-stay settings, and cash reserves all need to account for extended slower periods.
- During the high season, the absolute peak month showcases Ban Khao Pi Lai's highest earning potential, with monthly revenues climbing to $47,967, occupancy reaching 41.1%, and ADRs peaking at $2,450.
- Conversely, the slowest single month marks the market's lowest point — revenue may dip to $13,343, occupancy could drop to 8.1%, and ADRs may adjust to $1,809.
- Lower occupancy paired with meaningful seasonality means hosts in Ban Khao Pi Lai need to maximize every peak-season booking and seriously consider whether off-season pricing adjustments or minimum-stay changes can capture incremental revenue.
Seasonal Strategies for Maximizing Profit
- Peak Season: Maximize revenue through premium pricing and potentially longer minimum stays. Ensure high availability and consider tightening cancellation policies to reduce last-minute gaps.
- Low Season: Offer competitive pricing, extended-stay discounts, and flexible cancellation policies. Target off-season travelers like remote workers, budget-conscious guests, and travelers with flexible schedules.
- Shoulder Seasons: Implement dynamic pricing that bridges peak and low rates. Target weekend travelers, local events, and business visitors. Slightly more flexible terms than peak season can help maintain occupancy without deep discounting.
- In a highly seasonal market like Ban Khao Pi Lai, building a cash reserve during the top months is essential for covering fixed costs during the slow period. Automated pricing tools can help capture demand shifts in real time.
Do You Need a License for Airbnb in Ban Khao Pi Lai?
Low regulation and minimal registration activity in Ban Khao Pi Lai, Phang-nga Province, Thailand point to an operator-friendly environment. That said, even low-regulation markets may have tax collection requirements, safety standards, or HOA rules that affect short-term rental operations. Always verify the latest short-term rental regulations and Airbnb license requirements directly with local government authorities for Ban Khao Pi Lai to ensure full compliance before hosting.
(Source: AirROI data, 2026, finding no licensed listings among those analyzed)
What Are the Best Neighborhoods for Airbnb in Ban Khao Pi Lai?
With a compact short-term rental market, Ban Khao Pi Lai gives early-mover hosts an advantage in the right neighborhoods. The areas listed below are where guest demand and local attractions converge — a useful lens for investors evaluating whether to enter this market and where to position their listing.
| Neighborhood / Area | Why Host Here? (Target Guests & Appeal) | Key Attractions & Landmarks |
|---|---|---|
| Khao Lak | A stunning beach destination known for its natural beauty, diving spots, and laid-back atmosphere. Popular with tourists seeking tranquility and adventure. | Khao Lak National Park, Similan Islands, Bang Niang Beach, Khao Lak Viewpoint, Takuapa Old Town, Nang Thong Beach |
| Phang Nga Bay | Famous for its limestone cliffs and emerald waters, this area attracts tourists looking for boat tours and stunning scenery. Great for nature lovers and adventure seekers. | James Bond Island, Hong Islands, Koh Panyee, Phang Nga Bay National Park, Sea Canoeing, Limestone Caves |
| Bang Niang Beach | A quieter beach destination popular with families and those seeking a relaxing beach experience. Close to local markets and restaurants. | Bang Niang Market, Bang Niang Beach, Tsunami Memorial Park, Bangsak Beach, Khao Lak-Lam Ru National Park, Local restaurants and cafés |
| Nang Thong Beach | A beautiful beach area known for its sunset views and local dining options. Ideal for tourists who want convenience and leisure activities. | Nang Thong Beach, Local dining spots, Snorkeling and diving, Khao Lak shops, Sunset viewing spots, Nearby massage shops |
| Khao Lak-Lam Ru National Park | A national park featuring beautiful coastline and lush jungles, popular for ecotourism and outdoor activities. | Jungle trekking, Relaxing beaches, Wildlife watching, Waterfalls, Scenic viewpoints, Adventure activities |
| Takuapa | Rich in culture and history, Takuapa offers a different experience with its traditional markets and local heritage. | Old Town Takuapa, Local markets, Cultural festivals, Temples, Culinary tours, Nearby beaches |
| Surin Beach | Known for its upscale resorts and clear waters, Surin Beach attracts tourists seeking luxury and relaxation. | Surin Beach, High-end restaurants, Beach clubs, Water sports, Local markets, Tropical landscapes |
| Koh Yao Islands | An excellent getaway for tourists looking to explore the quiet, beautiful islands with stunning beaches and local culture. | Koh Yao Noi, Koh Yao Yai, Secluded beaches, Local fishing villages, Island hopping tours, Scenic views |
With 8 distinct neighborhoods showing meaningful short-term rental activity, Ban Khao Pi Lai offers diversification within a single market. Investors can tailor their strategy — from high-turnover tourist zones to quieter residential areas that attract longer stays and remote workers.
What Types of Properties Are on Airbnb in Ban Khao Pi Lai?
Room Type Distribution
Property Type Distribution
Market Composition Insights for Ban Khao Pi Lai
- The Ban Khao Pi Lai Airbnb market composition is heavily skewed towards Entire Home/Apt listings, which make up 100% of the 19 active rentals. This indicates strong guest preference for privacy and space.
- Looking at the property type distribution in Ban Khao Pi Lai, House properties are the most common (100%), reflecting the local real estate landscape.
- Houses represent a significant 100% portion, catering likely to families or larger groups.
Ban Khao Pi Lai Airbnb Room Capacity Analysis (2026): Bedroom Distribution
Distribution of Listings by Number of Bedrooms
Room Capacity Insights for Ban Khao Pi Lai
- The dominant room capacity in Ban Khao Pi Lai is 5+ bedrooms listings, making up 57.9% of the market. This suggests a strong demand for properties suitable for families or small groups.
- Together, 5+ bedrooms and 4 bedrooms properties represent 84.2% of the active Airbnb listings in Ban Khao Pi Lai, indicating a high concentration in these sizes.
- A significant 94.7% of listings offer 3+ bedrooms, catering to larger groups and families seeking more space in Ban Khao Pi Lai.
Ban Khao Pi Lai Vacation Rental Guest Capacity Trends (2026)
Distribution of Listings by Guest Capacity
Guest Capacity Insights for Ban Khao Pi Lai
- The most common guest capacity trend in Ban Khao Pi Lai vacation rentals is listings accommodating 8+ guests (84.2%). This suggests the primary traveler segment is likely larger groups.
- Properties designed for 8+ guests and 6 guests dominate the Ban Khao Pi Lai STR market, accounting for 94.7% of listings.
- 94.7% of properties accommodate 6+ guests, serving the market segment for larger families or group travel in Ban Khao Pi Lai.
- On average, properties in Ban Khao Pi Lai are equipped to host 7.6 guests.
What Amenities Do Airbnb Guests Expect in Ban Khao Pi Lai?
Amenity Prevalence
No amenities with partial availability (less than 100%) were found to display in the chart. All essential amenities might be present in all listings. Check insights below.
Amenity Insights for Ban Khao Pi Lai
- Essential amenities in Ban Khao Pi Lai that guests expect include: Air conditioning, Smoke alarm, Wifi, Carbon monoxide alarm, Washer, Essentials, TV, Hot water, Kitchen, Free parking on premises. Lacking these (any) could significantly impact bookings.
Recommendations for Hosts
- Ensure your listing includes all essential amenities for Ban Khao Pi Lai: Air conditioning, Smoke alarm, Wifi, Carbon monoxide alarm, Washer, Essentials, TV, Hot water, Kitchen, Free parking on premises.
- Highlight unique or less common amenities you offer (e.g., hot tub, dedicated workspace, EV charger) in your listing description and photos.
- Regularly check competitor amenities in Ban Khao Pi Lai to stay competitive.
Dive Deeper: Advanced Ban Khao Pi Lai STR Market Data (2026)
Ready to unlock more insights? AirROI provides access to advanced metrics and comprehensive Airbnb data for Ban Khao Pi Lai. Explore detailed analytics beyond this report to refine your investment strategy, optimize pricing, and maximize your vacation rental profits.
Explore Advanced MetricsBan Khao Pi Lai Airbnb Guest Demographics & Profile Analysis (2026)
Guest Profile Summary for Ban Khao Pi Lai
- The typical guest profile for Airbnb in Ban Khao Pi Lai consists of primarily domestic travelers (100%), often arriving from nearby Bangkok, typically belonging to the 1990s (Older Gen Z) group (50%), primarily speaking Thai or English.
- Domestic travelers account for 100.0% of guests.
- Top languages spoken are Thai (50%) followed by English (50%).
- A significant demographic segment is the Post-2000s (Gen Z/Alpha) group, representing 50% of guests.
Recommendations for Hosts
- Target domestic marketing efforts towards travelers from Bangkok.
- Tailor amenities and listing descriptions to appeal to the dominant 1990s (Older Gen Z) demographic (e.g., highlight fast WiFi, smart home features, local guides).
- Highlight unique local experiences or amenities relevant to the primary guest profile.
- Consider seasonal promotions aligned with peak travel times for key origin markets.
Ban Khao Pi Lai Airbnb Booking Patterns (2026): Available vs. Booked Days
Available Days Distribution
Booked Days Distribution
Booking Pattern Insights for Ban Khao Pi Lai
- The most common availability pattern in Ban Khao Pi Lai falls within the 181-270 days range, representing 78.9% of listings. This suggests many properties have significant open periods on their calendars.
- Approximately 94.7% of listings show high availability (181+ days open annually), indicating potential for increased bookings or specific owner usage patterns.
- For booked days, the 91-180 days range is most frequent in Ban Khao Pi Lai (73.7%), reflecting common guest stay durations or potential owner blocking patterns.
- A notable 10.5% of properties secure long booking periods (181+ days booked per year), highlighting successful long-term rental strategies or significant owner usage.
How Far in Advance Do Guests Book Airbnb in Ban Khao Pi Lai?
Average Booking Lead Time by Month
Booking Lead Time Insights for Ban Khao Pi Lai
- The overall average booking lead time for vacation rentals in Ban Khao Pi Lai is 39 days.
- Guests book furthest in advance for stays during April (average 123 days), likely coinciding with peak travel demand or local events.
- The shortest booking windows occur for stays in June (average 31 days), indicating more last-minute travel plans during this time.
- Seasonally, Spring (94 days avg.) sees the longest lead times, while Summer (50 days avg.) has the shortest, reflecting typical travel planning cycles.
Recommendations for Hosts
- Use the overall average lead time (39 days) as a baseline for your pricing and availability strategy in Ban Khao Pi Lai.
- For April stays, consider implementing length-of-stay discounts or slightly higher rates for bookings made less than 123 days out to capitalize on advance planning.
- Target marketing efforts for the Spring season well in advance (at least 94 days) to capture early planners.
- Monitor your own booking lead times against these Ban Khao Pi Lai averages to identify opportunities for dynamic pricing adjustments.
Ban Khao Pi Lai Airbnb Minimum Stay Requirements Analysis
Distribution of Listings by Minimum Night Requirement
2 Nights
2 listings
13.3% of total
3 Nights
1 listings
6.7% of total
4-6 Nights
10 listings
66.7% of total
30+ Nights
2 listings
13.3% of total
Key Insights
- The most prevalent minimum stay requirement in Ban Khao Pi Lai is 4-6 Nights, adopted by 66.7% of listings. This highlights the market's preference for longer commitments.
- Very short stays (1-2 nights) are less common (13.3%), suggesting hosts prefer slightly longer bookings to optimize turnover.
- A significant segment (13.3%) caters to monthly stays (30+ nights) in Ban Khao Pi Lai, pointing to opportunities in the extended-stay market.
Recommendations
- Align with the market by considering a 4-6 Nights minimum stay, as 66.7% of Ban Khao Pi Lai hosts use this setting.
- Explore offering discounts for stays of 30+ nights to attract the 13.3% of the market seeking extended stays.
- Adjust minimum nights based on seasonality – potentially shorter during low season and longer during peak demand periods in Ban Khao Pi Lai.
Ban Khao Pi Lai Airbnb Cancellation Policy Trends Analysis (2026)
Moderate
1 listings
50% of total
Strict
1 listings
50% of total
Cancellation Policy Insights for Ban Khao Pi Lai
- The prevailing Airbnb cancellation policy trend in Ban Khao Pi Lai is Moderate, used by 50% of listings.
- There's a relatively balanced mix between guest-friendly (50.0%) and stricter (50.0%) policies, offering choices for different guest needs.
Recommendations for Hosts
- Consider adopting a Moderate policy to align with the 50% market standard in Ban Khao Pi Lai.
- With 50% using Strict terms, this is a viable option in Ban Khao Pi Lai, particularly for high-value properties or during peak demand periods.
- Regularly review your cancellation policy against competitors and market demand shifts in Ban Khao Pi Lai.
What Do the Top Airbnb Listings in Ban Khao Pi Lai Look Like?
Benchmark your potential! Explore examples of top-performing Airbnb properties in Ban Khao Pi Laibased on Trailing Twelve Month (TTM) revenue. Analyze their characteristics, revenue, occupancy rate, and ADR to understand what drives success in this market.
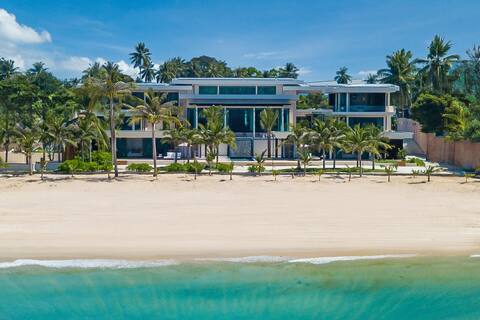
Villa Boonta
Entire Place • 6 bedrooms
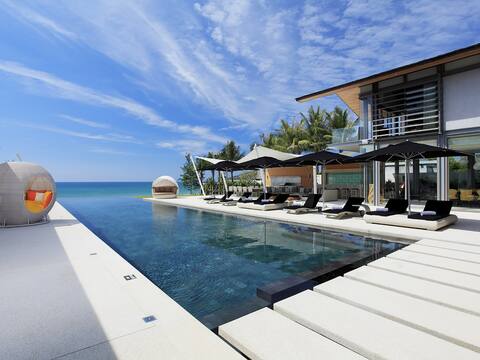
7BR Beachfront Villa w/ Kid'sRm &Spa | Natai Beach
Entire Place • 7 bedrooms
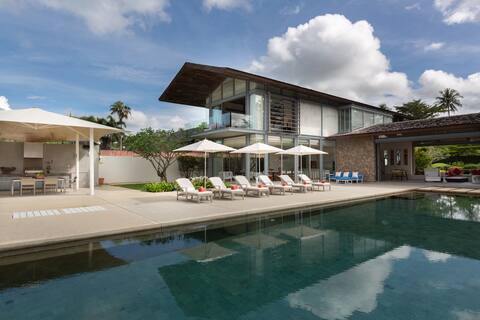
6BR Luxurious Villa w/ Pétanque Lawn | Natai Beach
Entire Place • 6 bedrooms
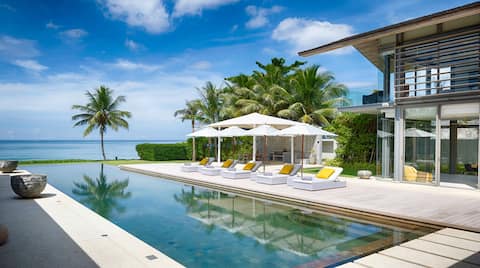
6BR Beachfront Villa w/ Pool & Chef | Natai Beach
Entire Place • 6 bedrooms
6BR Beachfront Villa w/ Kids Area | Natai Beach
Entire Place • 6 bedrooms
6BR Villa w/ Enormous Back Garden | Natai Beach
Entire Place • 6 bedrooms
Note: Performance varies based on location, size, amenities, seasonality, and management quality. Data reflects the past 12 months.
Who Are the Top Airbnb Hosts in Ban Khao Pi Lai?
Learn from the best! This table showcases top-performing Airbnb hosts in Ban Khao Pi Lai based on the number of properties managed and estimated total revenue over the past year. Analyze their scale and performance metrics.
| Host Name | Properties | Grossing Revenue | Stay Reviews | Avg Rating |
|---|---|---|---|---|
| Host #150765519 | 8 | $2,494,202 | 0 | 0.00/5.0 |
| Host #12812689 | 1 | $558,392 | 0 | 0.00/5.0 |
| Host #182591674 | 2 | $478,098 | 0 | 0.00/5.0 |
| Host #542084812 | 2 | $477,232 | 0 | 0.00/5.0 |
| Host #458364206 | 1 | $243,765 | 0 | 0.00/5.0 |
| Host #562974626 | 1 | $119,910 | 0 | 0.00/5.0 |
| Host #5742955 | 2 | $119,316 | 2 | 0.00/5.0 |
| Host #272099254 | 1 | $40,665 | 1 | 0.00/5.0 |
| Host #1874669 | 1 | $32,269 | 0 | 0.00/5.0 |
Analyzing the strategies of top hosts, such as their property selection, pricing, and guest communication, can offer valuable lessons for optimizing your own Airbnb operations in Ban Khao Pi Lai.
How Does Ban Khao Pi Lai's Airbnb Market Compare to Nearby Cities?
How does the Ban Khao Pi Lai Airbnb market stack up against its neighbors? Compare key performance metrics like average monthly revenue, ADR, and occupancy rates in surrounding areas to understand the broader regional STR landscape.
Compared with Kamala, Ban Khao Pi Lai has 21 percentage points lower occupancy and about $1741 higher ADR. That helps frame whether this market is winning more on demand, pricing, or both.
| Market | Active Properties | Monthly Revenue | Daily Rate | Avg. Occupancy |
|---|---|---|---|---|
| Pa Khlok | 88 | $6,294 | $694.89 | 29% |
| Baan Thong Po | 133 | $4,453 | $373.62 | 47% |
| Ban Bang Khao | 47 | $4,259 | $407.52 | 38% |
| Khok Kloi | 10 | $3,637 | $498.63 | 28% |
| Baan Taling Ngam | 22 | $3,465 | $406.97 | 34% |
| Tong Yang | 65 | $3,267 | $335.92 | 36% |
| Haad Klong Jaak | 35 | $3,225 | $263.02 | 45% |
| Kamala | 906 | $3,072 | $291.16 | 48% |
| Baan Thong Krut | 27 | $2,823 | $280.56 | 42% |
| Ko Kaeo | 82 | $2,814 | $370.70 | 22% |
Frequently Asked Questions About Airbnb in Ban Khao Pi Lai
These quick answers summarize the most common investor and operator questions using AirROI's latest market data for Ban Khao Pi Lai.
How much do Airbnb hosts make in Ban Khao Pi Lai?
Ban Khao Pi Lai hosts earn about $240,203 per year on average, with an average nightly rate of $2,032 and RevPAR of N/A. Those figures describe the typical revenue environment for active listings in Ban Khao Pi Lai, Phang-nga Province, not the ceiling for the best operators. Source: AirROI 2025 data, Ban Khao Pi Lai market, April 2024 to March 2025.
What is the average Airbnb occupancy rate in Ban Khao Pi Lai?
The average Airbnb occupancy rate in Ban Khao Pi Lai is 26.8%. May is the strongest month and November is the softest, so hosts should expect demand to move meaningfully throughout the year rather than stay flat.
What is the average Airbnb daily rate in Ban Khao Pi Lai?
Listings in Ban Khao Pi Lai average $2,032 per night. The broader pricing spread also matters: lower-performing listings cluster closer to the lower quartiles, while premium homes can price materially above the city average when demand spikes or listing quality stands out.
How many Airbnb listings are active in Ban Khao Pi Lai?
Ban Khao Pi Lai currently has about 19 active Airbnb listings in AirROI's market dataset. That supply count helps explain how competitive the market is, how much depth there is for benchmarking, and whether the market behaves like a niche destination or a scaled urban market.
How strict are short-term rental regulations in Ban Khao Pi Lai?
AirROI currently classifies the short-term rental regulation level in Ban Khao Pi Lai as Low. The dataset also shows about 0.0% of listings with registration evidence. That is a market signal, not legal advice, so hosts should still confirm current licensing and compliance rules locally before listing.
What is the RevPAR for Airbnb in Ban Khao Pi Lai?
RevPAR in Ban Khao Pi Lai is about N/A. That metric combines pricing and occupancy into one efficiency number, so it is often a better quick benchmark than ADR alone when investors want to compare how well listings convert nightly rates into realized revenue.
Is Airbnb profitable in Ban Khao Pi Lai?
Occupancy of 26.8% means Ban Khao Pi Lai is a more selective market. Profitability is achievable but requires careful cost management, premium positioning, or targeting longer stays to reduce turnover. Average annual revenue is $240,203, but individual returns depend on property type, location within the city, and the host's operating efficiency.
How far in advance do guests book Airbnb in Ban Khao Pi Lai?
The average booking lead time in Ban Khao Pi Lai is about 39 days — a moderate lead time that gives hosts planning visibility while still benefiting from last-minute bookings. Hosts who understand their market's booking cadence can adjust minimum stays and pricing windows accordingly.
What are the best neighborhoods for Airbnb in Ban Khao Pi Lai?
Based on AirROI's analysis, some of the top neighborhoods for short-term rentals in Ban Khao Pi Lai include Khao Lak, Phang Nga Bay, Bang Niang Beach. Each area attracts different guest profiles — from business travelers to leisure visitors — so the best location depends on the property type and target audience a host is aiming for. See the full neighborhood breakdown above.
What type of property performs best on Airbnb in Ban Khao Pi Lai?
entire_home listings make up 100.0% of the active supply in Ban Khao Pi Lai. The most common configuration does not always mean the most profitable — operators who identify underserved property types or bedroom counts can sometimes outperform the market average by filling a gap in local supply.
How does Ban Khao Pi Lai compare to nearby Airbnb markets?
Among neighboring markets, Pa Khlok posts $75,522 in average annual revenue with 28.8% occupancy, compared to Ban Khao Pi Lai's $240,203 and 26.8%. Comparing nearby markets helps investors understand whether a destination's performance reflects local demand or broader regional trends.
When is the peak season for Airbnb in Ban Khao Pi Lai?
May is the highest-revenue month in Ban Khao Pi Lai, while November is the softest. The revenue spread between them indicates a highly seasonal market — revenue in the peak month is more than double the low month, so cash-flow planning and pricing automation are critical.
About AirROI Market Data
AirROI tracks over 20 million properties across 190+ countries and maintains 15+ years of historical performance data, making it one of the deepest Airbnb and STR intelligence platforms available. The analytics pipeline aggregates listing-level data monthly — revenue, occupancy, nightly rates, RevPAR, guest demographics, booking patterns, and competitive supply — so investors and operators can benchmark any market against its own history and against neighboring destinations.
Real estate investors, property managers, financial institutions, hedge funds, tourism boards, hospitality consultants, tech platforms, and academic researchers rely on AirROI data to underwrite acquisitions, optimize pricing, model macro trends, and conduct peer-reviewed research. Data is available through in-depth market reports like this one and the Airbnb API with 22 endpoints and an Airbnb MCP Server for AI agents.
AirROI proprietary analytics as of 2025-03-31. Metrics reflect trailing twelve-month aggregates from active listings. Revenue figures are market averages, not projections. Neighborhood descriptions are AI-generated and reviewed for accuracy. For full methodology, see the data methodology page.