San Bernardino, Cordillera Airbnb Market Data 2025: STR Report & Statistics
How much can you earn on Airbnb in San Bernardino, Cordillera? Based on AirROI's 2025 dataset (June 2024 – May 2025), the short answer is $5,591 per year — at a $153 nightly rate, 21.7% occupancy, and a N/A RevPAR.
With just 32 active listings, San Bernardino is a micro-market where selective demand that rewards strong listing quality and pricing strategy. Supply grew 100.0% and nightly rates have risen, creating an environment where the most bookable listings stand to capture outsized share. Hosts who pair competitive pricing with strong guest experience are well-positioned to convert the growing traveler base into consistent bookings.
Regulation is low with minimal registration requirements, pointing to an operator-friendly environment. In a market this size, differentiated listings with strong reviews can capture outsized returns relative to the competition.

Table of Contents [hide] [show]
What Are the Key Airbnb Metrics in San Bernardino?
In San Bernardino, the headline Airbnb metrics are $5,591 in average annual revenue,21.7% occupancy, $153 ADR, and $0 in RevPAR, and guests book about 29 days in advance.
How Much Do Airbnb Hosts Earn Monthly in San Bernardino?
Understanding the monthly revenue variations for Airbnb listings in San Bernardino is key to maximizing your short term rental income potential. Seasonality significantly impacts earnings. Our analysis, based on data from the past 12 months, shows that the peak revenue month for STRs in San Bernardino is typically January, while June often presents the lowest earnings, highlighting opportunities for strategic pricing adjustments during shoulder and low seasons. Explore the typical Airbnb income in San Bernardino across different performance tiers:
- Best-in-class properties (Top 10%) achieve $2,409+ monthly, often utilizing dynamic pricing and superior guest experiences.
- Strong performing properties (Top 25%) earn $1,313 or more, indicating effective management and desirable locations/amenities.
- Typical properties (Median) generate around $519 per month, representing the average market performance.
- Entry-level properties (Bottom 25%) see earnings around $287, often with potential for optimization.
Average Monthly Airbnb Earnings Trend in San Bernardino
What Is the Monthly Airbnb Occupancy Rate in San Bernardino?
Maximize your bookings by understanding the San Bernardino STR occupancy trends. Seasonal demand shifts significantly influence how often properties are booked. Typically, Januarysees the highest demand (peak season occupancy), while June experiences the lowest (low season). Effective strategies, like adjusting minimum stays or offering promotions, can boost occupancy during slower periods. Here's how different property tiers perform in San Bernardino:
- Best-in-class properties (Top 10%) achieve 43%+ occupancy, indicating high desirability and potentially optimized availability.
- Strong performing properties (Top 25%) maintain 27% or higher occupancy, suggesting good market fit and guest satisfaction.
- Typical properties (Median) have an occupancy rate around 13%.
- Entry-level properties (Bottom 25%) average 7% occupancy, potentially facing higher vacancy.
Average Monthly Occupancy Rate Trend in San Bernardino
What Is the Average Airbnb Nightly Rate in San Bernardino?
Effective short term rental pricing strategy in San Bernardino involves understanding monthly ADR fluctuations. The Average Daily Rate (ADR) for Airbnb in San Bernardino typically peaks in January and dips lowest during September. Leveraging Airbnb dynamic pricing tools or strategies based on this seasonality can significantly boost revenue. Here's a look at the typical nightly rates achieved:
- Best-in-class properties (Top 10%) command rates of $260+ per night, often due to premium features or locations.
- Strong performing properties (Top 25%) achieve nightly rates of $187 or more.
- Typical properties (Median) charge around $131 per night.
- Entry-level properties (Bottom 25%) earn around $84 per night.
Average Daily Rate (ADR) Trend by Month in San Bernardino
What Is the RevPAR for Airbnb in San Bernardino?
RevPAR in San Bernardino is currently N/A. Because RevPAR combines nightly rates with realized occupancy, it is one of the cleanest ways to compare how efficiently listings turn demand into revenue across the market.
- Entry-level properties (Bottom 25%) see N/A RevPAR.
- Typical properties (Median) generate N/A RevPAR.
- Strong performers (Top 25%) earn N/A RevPAR.
- Best-in-class (Top 10%) achieve N/A RevPAR.
Average Monthly RevPAR Trend in San Bernardino
RevPAR Insights for San Bernardino
- RevPAR peaks in Jan and bottoms out in Jan, mirroring the broader seasonal demand pattern and suggesting opportunities for dynamic pricing.
Recommendations for Hosts
- Track your own RevPAR monthly against these San Bernardino benchmarks. If your RevPAR falls below the median of N/A, examine whether low occupancy or low ADR is the primary drag.
- Use RevPAR rather than revenue alone when comparing properties of different sizes — it normalizes for available nights and gives a more accurate picture of performance.
Get Live San Bernardino Market Intelligence 👇
Explore Real-time Analytics
When Is the Peak Season for Airbnb in San Bernardino?
San Bernardino's peak Airbnb season falls in January, March, April, while the softest stretch is June, August, September. Overall, the market shows highly seasonal trends requiring careful strategy, which should guide pricing, minimum stays, and cash-flow planning.
Peak Season (January, March, April)
- Revenue averages $1,486 per month
- Occupancy rates average 27.6%
- Daily rates average $168
Shoulder Season
- Revenue averages $876 per month
- Occupancy maintains around 21.1%
- Daily rates hold near $154
Low Season (June, August, September)
- Revenue drops to average $432 per month
- Occupancy decreases to average 10.6%
- Daily rates adjust to average $145
Seasonality Insights for San Bernardino
- Airbnb seasonality in San Bernardino is pronounced. Revenue swings sharply between peak and low months, which means pricing strategy, minimum-stay settings, and cash reserves all need to account for extended slower periods.
- During the high season, the absolute peak month showcases San Bernardino's highest earning potential, with monthly revenues climbing to $2,204, occupancy reaching 34.6%, and ADRs peaking at $180.
- Conversely, the slowest single month marks the market's lowest point — revenue may dip to $182, occupancy could drop to 3.3%, and ADRs may adjust to $144.
- Lower occupancy paired with meaningful seasonality means hosts in San Bernardino need to maximize every peak-season booking and seriously consider whether off-season pricing adjustments or minimum-stay changes can capture incremental revenue.
Seasonal Strategies for Maximizing Profit
- Peak Season: Maximize revenue through premium pricing and potentially longer minimum stays. Ensure high availability and consider tightening cancellation policies to reduce last-minute gaps.
- Low Season: Offer competitive pricing, extended-stay discounts, and flexible cancellation policies. Target off-season travelers like remote workers, budget-conscious guests, and travelers with flexible schedules.
- Shoulder Seasons: Implement dynamic pricing that bridges peak and low rates. Target weekend travelers, local events, and business visitors. Slightly more flexible terms than peak season can help maintain occupancy without deep discounting.
- In a highly seasonal market like San Bernardino, building a cash reserve during the top months is essential for covering fixed costs during the slow period. Automated pricing tools can help capture demand shifts in real time.
Do You Need a License for Airbnb in San Bernardino?
Low regulation and minimal registration activity in San Bernardino, Cordillera, Paraguay point to an operator-friendly environment. That said, even low-regulation markets may have tax collection requirements, safety standards, or HOA rules that affect short-term rental operations. Always verify the latest short-term rental regulations and Airbnb license requirements directly with local government authorities for San Bernardino to ensure full compliance before hosting.
(Source: AirROI data, 2026, based on 3% licensed listings)
What Are the Best Neighborhoods for Airbnb in San Bernardino?
With a compact short-term rental market, San Bernardino gives early-mover hosts an advantage in the right neighborhoods. The areas listed below are where guest demand and local attractions converge — a useful lens for investors evaluating whether to enter this market and where to position their listing.
| Neighborhood / Area | Why Host Here? (Target Guests & Appeal) | Key Attractions & Landmarks |
|---|---|---|
| San Bernardino City | The city offers a mix of urban amenities and outdoor attractions, making it appealing to both families and adventure seekers. It's a gateway to nearby national parks and mountains, drawing visitors year-round. | Lake Arrowhead, Big Bear Lake, San Bernardino National Forest, Route 66, California Theatre of the Performing Arts, Glen Helen Regional Park |
| Highland | Highland provides a suburban feel with easy access to outdoor recreation. Its proximity to San Bernardino City and several parks makes it attractive for families and outdoor enthusiasts. | Glen Helen Regional Park, San Manuel Amphitheater, Highland Woods, Santa Ana River Trail, Highland Plaza Shopping Center |
| Redlands | Known for its historic charm and citrus groves, Redlands attracts visitors seeking a quaint, picturesque experience, along with a vibrant downtown and frequent community events. | Redlands Historic District, Kimberly Crest House and Gardens, University of Redlands, Redlands Farmer's Market, Citrus Historical Park |
| Loma Linda | Home to several health institutions, Loma Linda attracts medical professionals and families visiting for healthcare reasons, as well as those interested in the nearby outdoor activities. | Loma Linda University, Loma Linda University Medical Center, San Timoteo Canyon, Great Oak Park, Loma Linda Veteran's Hospital |
| Yucaipa | Yucaipa is known for its natural beauty and outdoor activities, making it a great spot for vacationers looking for hiking and nature experiences, along with a charming small-town feel. | Yucaipa Regional Park, Oak Glen Nature Preserve, Cajon Pass, Wildwood Park, Yucaipa Valley Golf Club |
| Fontana | This city offers affordable lodging and is close to major attractions, making it appealing for budget travelers looking for convenient access to various nearby destinations. | Fontana Park, Auto Club Speedway, Mary Vagle Nature Center, Civic Center Park, The Lewis Library and Technology Center |
| Victorville | Victorville has a growing economy and is strategically located near major highways, making it ideal for transient travelers and business visitors alike, with several family-friendly activities. | Calico Ghost Town, Victor Valley Museum, The Mall of Victor Valley, Route 66 Museum, Southern California Logistics Airport |
| Apple Valley | This area is popular for its desert ambiance and outdoor recreation, appealing to travelers looking for unique landscapes and activities such as hiking and off-roading. | Jess Ranch Marketplace, Apple Valley Lake, Mojave Narrows Regional Park, Apple Valley Golf Course, Stater Bros. Markets |
With 8 distinct neighborhoods showing meaningful short-term rental activity, San Bernardino offers diversification within a single market. Investors can tailor their strategy — from high-turnover tourist zones to quieter residential areas that attract longer stays and remote workers.
What Types of Properties Are on Airbnb in San Bernardino?
Room Type Distribution
Property Type Distribution
Market Composition Insights for San Bernardino
- The San Bernardino Airbnb market composition is heavily skewed towards Entire Home/Apt listings, which make up 81.3% of the 32 active rentals. This indicates strong guest preference for privacy and space.
- Looking at the property type distribution in San Bernardino, House properties are the most common (71.9%), reflecting the local real estate landscape.
- Houses represent a significant 71.9% portion, catering likely to families or larger groups.
- Smaller segments like hotel/boutique (combined 3.1%) offer potential for unique stay experiences.
San Bernardino Airbnb Room Capacity Analysis (2026): Bedroom Distribution
Distribution of Listings by Number of Bedrooms
Room Capacity Insights for San Bernardino
- The dominant room capacity in San Bernardino is 3 bedrooms listings, making up 28.1% of the market. This suggests a strong demand for properties suitable for families or small groups.
- Together, 3 bedrooms and 1 bedroom properties represent 53.1% of the active Airbnb listings in San Bernardino, indicating a high concentration in these sizes.
- A significant 50.0% of listings offer 3+ bedrooms, catering to larger groups and families seeking more space in San Bernardino.
San Bernardino Vacation Rental Guest Capacity Trends (2026)
Distribution of Listings by Guest Capacity
Guest Capacity Insights for San Bernardino
- The most common guest capacity trend in San Bernardino vacation rentals is listings accommodating 8+ guests (40.6%). This suggests the primary traveler segment is likely larger groups.
- Properties designed for 8+ guests and 6 guests dominate the San Bernardino STR market, accounting for 56.2% of listings.
- 68.7% of properties accommodate 6+ guests, serving the market segment for larger families or group travel in San Bernardino.
- On average, properties in San Bernardino are equipped to host 6.0 guests.
What Amenities Do Airbnb Guests Expect in San Bernardino?
Amenity Prevalence
Amenity Insights for San Bernardino
- Essential amenities in San Bernardino that guests expect include: Free parking on premises, BBQ grill, Air conditioning, Kitchen. Lacking these (any) could significantly impact bookings.
- Popular amenities like Pool, Wifi, TV are common but not universal. Offering these can provide a competitive edge.
- A pool is a highly desired but not standard amenity, making it a key feature for attracting guests seeking leisure in San Bernardino.
- Warning: Wifi is not universally provided but is considered essential globally. Ensure reliable Wifi is offered.
Recommendations for Hosts
- Ensure your listing includes all essential amenities for San Bernardino: Free parking on premises, BBQ grill, Air conditioning, Kitchen.
- Prioritize adding missing essentials: BBQ grill, Air conditioning, Kitchen.
- Consider adding popular differentiators like Pool or Wifi to increase appeal.
- Highlight unique or less common amenities you offer (e.g., hot tub, dedicated workspace, EV charger) in your listing description and photos.
- Regularly check competitor amenities in San Bernardino to stay competitive.
Dive Deeper: Advanced San Bernardino STR Market Data (2026)
Ready to unlock more insights? AirROI provides access to advanced metrics and comprehensive Airbnb data for San Bernardino. Explore detailed analytics beyond this report to refine your investment strategy, optimize pricing, and maximize your vacation rental profits.
Explore Advanced MetricsSan Bernardino Airbnb Guest Demographics & Profile Analysis (2026)
Guest Profile Summary for San Bernardino
- The typical guest profile for Airbnb in San Bernardino consists of primarily domestic travelers (65%), often arriving from nearby Asunción, typically belonging to the Post-2000s (Gen Z/Alpha) group (50%), primarily speaking Spanish or English.
- Domestic travelers account for 65.1% of guests.
- Key international markets include Paraguay (65.1%) and Argentina (11.6%).
- Top languages spoken are Spanish (43.6%) followed by English (27.3%).
- A significant demographic segment is the Post-2000s (Gen Z/Alpha) group, representing 50% of guests.
Recommendations for Hosts
- Target domestic marketing efforts towards travelers from Asunción and Asuncion.
- Tailor amenities and listing descriptions to appeal to the dominant Post-2000s (Gen Z/Alpha) demographic (e.g., highlight fast WiFi, smart home features, local guides).
- Highlight unique local experiences or amenities relevant to the primary guest profile.
- Consider seasonal promotions aligned with peak travel times for key origin markets.
San Bernardino Airbnb Booking Patterns (2026): Available vs. Booked Days
Available Days Distribution
Booked Days Distribution
Booking Pattern Insights for San Bernardino
- The most common availability pattern in San Bernardino falls within the 271-366 days range, representing 90.6% of listings. This suggests many properties have significant open periods on their calendars.
- Approximately 100.0% of listings show high availability (181+ days open annually), indicating potential for increased bookings or specific owner usage patterns.
- For booked days, the 1-30 days range is most frequent in San Bernardino (46.9%), reflecting common guest stay durations or potential owner blocking patterns.
How Far in Advance Do Guests Book Airbnb in San Bernardino?
Average Booking Lead Time by Month
Booking Lead Time Insights for San Bernardino
- The overall average booking lead time for vacation rentals in San Bernardino is 29 days.
- Guests book furthest in advance for stays during January (average 37 days), likely coinciding with peak travel demand or local events.
- The shortest booking windows occur for stays in June (average 0 days), indicating more last-minute travel plans during this time.
- Seasonally, Winter (32 days avg.) sees the longest lead times, while Summer (5 days avg.) has the shortest, reflecting typical travel planning cycles.
Recommendations for Hosts
- Use the overall average lead time (29 days) as a baseline for your pricing and availability strategy in San Bernardino.
- During June, focus on last-minute booking availability and promotions, as guests book with very short notice (0 days avg.).
- Target marketing efforts for the Winter season well in advance (at least 32 days) to capture early planners.
- Monitor your own booking lead times against these San Bernardino averages to identify opportunities for dynamic pricing adjustments.
San Bernardino Airbnb Minimum Stay Requirements Analysis
Distribution of Listings by Minimum Night Requirement
1 Night
11 listings
34.4% of total
2 Nights
6 listings
18.8% of total
3 Nights
4 listings
12.5% of total
7-29 Nights
2 listings
6.3% of total
30+ Nights
9 listings
28.1% of total
Key Insights
- The most prevalent minimum stay requirement in San Bernardino is 1 Night, adopted by 34.4% of listings. This highlights the market's preference for shorter, flexible bookings.
- A significant segment (28.1%) caters to monthly stays (30+ nights) in San Bernardino, pointing to opportunities in the extended-stay market.
Recommendations
- Align with the market by considering a 1 Night minimum stay, as 34.4% of San Bernardino hosts use this setting.
- Explore offering discounts for stays of 30+ nights to attract the 28.1% of the market seeking extended stays.
- Adjust minimum nights based on seasonality – potentially shorter during low season and longer during peak demand periods in San Bernardino.
San Bernardino Airbnb Cancellation Policy Trends Analysis (2026)
Flexible
7 listings
31.8% of total
Moderate
9 listings
40.9% of total
Firm
2 listings
9.1% of total
Strict
4 listings
18.2% of total
Cancellation Policy Insights for San Bernardino
- The prevailing Airbnb cancellation policy trend in San Bernardino is Moderate, used by 40.9% of listings.
- The market strongly favors guest-friendly terms, with 72.7% of listings offering Flexible or Moderate policies. This suggests guests in San Bernardino may expect booking flexibility.
Recommendations for Hosts
- Consider adopting a Moderate policy to align with the 40.9% market standard in San Bernardino.
- Regularly review your cancellation policy against competitors and market demand shifts in San Bernardino.
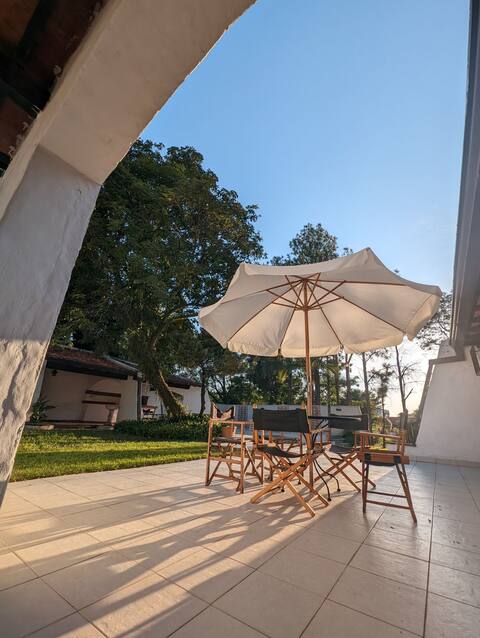
What Do the Top Airbnb Listings in San Bernardino Look Like?
Benchmark your potential! Explore examples of top-performing Airbnb properties in San Bernardinobased on Trailing Twelve Month (TTM) revenue. Analyze their characteristics, revenue, occupancy rate, and ADR to understand what drives success in this market.

Family Residential Resort
Entire Place • 8 bedrooms

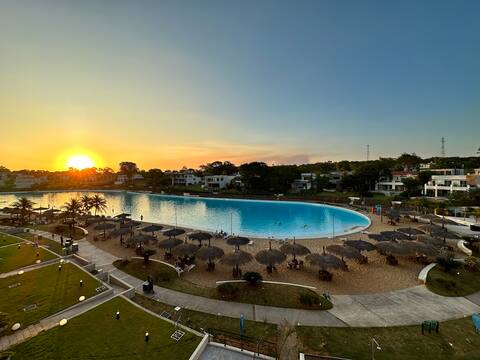
Cozy Alquilo Dpto. en Paraíso Aqua Village
Entire Place • 2 bedrooms
Casa estilo Mediterraneo en San Bernardino
Entire Place • 4 bedrooms
Nuevo Aquavillage Apartment
Entire Place • 3 bedrooms

cabaña grupal
Private Room • 1 bedroom
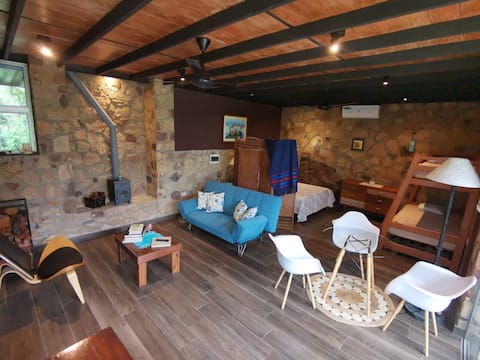
House on the Rock
Entire Place • 2 bedrooms
Note: Performance varies based on location, size, amenities, seasonality, and management quality. Data reflects the past 12 months.
Who Are the Top Airbnb Hosts in San Bernardino?
Learn from the best! This table showcases top-performing Airbnb hosts in San Bernardino based on the number of properties managed and estimated total revenue over the past year. Analyze their scale and performance metrics.
| Host Name | Properties | Grossing Revenue | Stay Reviews | Avg Rating |
|---|---|---|---|---|
| Carolina | 1 | $28,393 | 7 | 5.00/5.0 |
| Estefania | 1 | $19,272 | 64 | 5.00/5.0 |
| Host #11147569 | 3 | $17,087 | 0 | Not Rated |
| Host #509922474 | 1 | $12,951 | 2 | Not Rated |
| Oscar | 1 | $12,809 | 4 | 5.00/5.0 |
| Cinthia | 1 | $8,839 | 3 | 5.00/5.0 |
| Daniel Jose | 1 | $7,321 | 6 | 5.00/5.0 |
| Rodolfo Nicolas | 1 | $5,637 | 14 | 5.00/5.0 |
| Nathalia | 1 | $5,366 | 7 | 5.00/5.0 |
| Franko | 1 | $5,306 | 0 | Not Rated |
Analyzing the strategies of top hosts, such as their property selection, pricing, and guest communication, can offer valuable lessons for optimizing your own Airbnb operations in San Bernardino.
How Does San Bernardino's Airbnb Market Compare to Nearby Cities?
How does the San Bernardino Airbnb market stack up against its neighbors? Compare key performance metrics like average monthly revenue, ADR, and occupancy rates in surrounding areas to understand the broader regional STR landscape.
Compared with Asuncion, San Bernardino has 24 percentage points lower occupancy and about $105 higher ADR. That helps frame whether this market is winning more on demand, pricing, or both.
| Market | Active Properties | Monthly Revenue | Daily Rate | Avg. Occupancy |
|---|---|---|---|---|
| San Bernardino | 207 | $697 | $199.02 | 22% |
| Altos | 17 | $553 | $108.69 | 25% |
| Asuncion | 1,322 | $455 | $48.35 | 46% |
| Ypacarai District | 32 | $387 | $119.32 | 24% |
| District of Itauguá | 16 | $331 | $131.74 | 25% |
| Areguá | 25 | $330 | $113.66 | 22% |
| Paraguari district | 25 | $314 | $124.99 | 18% |
| Caaguazú | 14 | $245 | $54.23 | 14% |
| San Lorenzo | 45 | $242 | $46.49 | 35% |
| Luque | 111 | $238 | $44.50 | 30% |
Frequently Asked Questions About Airbnb in San Bernardino
These quick answers summarize the most common investor and operator questions using AirROI's latest market data for San Bernardino.
How much do Airbnb hosts make in San Bernardino?
San Bernardino hosts earn about $5,591 per year on average, with an average nightly rate of $153 and RevPAR of N/A. Those figures describe the typical revenue environment for active listings in San Bernardino, Cordillera, not the ceiling for the best operators. Source: AirROI 2025 data, San Bernardino market, June 2024 to May 2025.
What is the average Airbnb occupancy rate in San Bernardino?
The average Airbnb occupancy rate in San Bernardino is 21.7%. January is the strongest month and June is the softest, so hosts should expect demand to move meaningfully throughout the year rather than stay flat.
What is the average Airbnb daily rate in San Bernardino?
Listings in San Bernardino average $153 per night. The broader pricing spread also matters: lower-performing listings cluster closer to the lower quartiles, while premium homes can price materially above the city average when demand spikes or listing quality stands out.
How many Airbnb listings are active in San Bernardino?
San Bernardino currently has about 32 active Airbnb listings in AirROI's market dataset. That supply count helps explain how competitive the market is, how much depth there is for benchmarking, and whether the market behaves like a niche destination or a scaled urban market.
How strict are short-term rental regulations in San Bernardino?
AirROI currently classifies the short-term rental regulation level in San Bernardino as Low. The dataset also shows about 3.1% of listings with registration evidence. That is a market signal, not legal advice, so hosts should still confirm current licensing and compliance rules locally before listing.
What is the RevPAR for Airbnb in San Bernardino?
RevPAR in San Bernardino is about N/A. That metric combines pricing and occupancy into one efficiency number, so it is often a better quick benchmark than ADR alone when investors want to compare how well listings convert nightly rates into realized revenue.
Is Airbnb profitable in San Bernardino?
Occupancy of 21.7% means San Bernardino is a more selective market. Profitability is achievable but requires careful cost management, premium positioning, or targeting longer stays to reduce turnover. Average annual revenue is $5,591, but individual returns depend on property type, location within the city, and the host's operating efficiency.
How far in advance do guests book Airbnb in San Bernardino?
The average booking lead time in San Bernardino is about 29 days — a moderate lead time that gives hosts planning visibility while still benefiting from last-minute bookings. Hosts who understand their market's booking cadence can adjust minimum stays and pricing windows accordingly.
What are the best neighborhoods for Airbnb in San Bernardino?
Based on AirROI's analysis, some of the top neighborhoods for short-term rentals in San Bernardino include San Bernardino City, Highland, Redlands. Each area attracts different guest profiles — from business travelers to leisure visitors — so the best location depends on the property type and target audience a host is aiming for. See the full neighborhood breakdown above.
What type of property performs best on Airbnb in San Bernardino?
entire_home listings make up 81.3% of the active supply in San Bernardino. The most common configuration does not always mean the most profitable — operators who identify underserved property types or bedroom counts can sometimes outperform the market average by filling a gap in local supply.
How does San Bernardino compare to nearby Airbnb markets?
Among neighboring markets, San Bernardino posts $8,368 in average annual revenue with 21.6% occupancy, compared to San Bernardino's $5,591 and 21.7%. Comparing nearby markets helps investors understand whether a destination's performance reflects local demand or broader regional trends.
When is the peak season for Airbnb in San Bernardino?
January is the highest-revenue month in San Bernardino, while June is the softest. The revenue spread between them indicates a highly seasonal market — revenue in the peak month is more than double the low month, so cash-flow planning and pricing automation are critical.
About AirROI Market Data
AirROI tracks over 20 million properties across 190+ countries and maintains 15+ years of historical performance data, making it one of the deepest Airbnb and STR intelligence platforms available. The analytics pipeline aggregates listing-level data monthly — revenue, occupancy, nightly rates, RevPAR, guest demographics, booking patterns, and competitive supply — so investors and operators can benchmark any market against its own history and against neighboring destinations.
Real estate investors, property managers, financial institutions, hedge funds, tourism boards, hospitality consultants, tech platforms, and academic researchers rely on AirROI data to underwrite acquisitions, optimize pricing, model macro trends, and conduct peer-reviewed research. Data is available through in-depth market reports like this one and the Airbnb API with 22 endpoints and an Airbnb MCP Server for AI agents.
AirROI proprietary analytics as of 2025-05-31. Metrics reflect trailing twelve-month aggregates from active listings. Revenue figures are market averages, not projections. Neighborhood descriptions are AI-generated and reviewed for accuracy. For full methodology, see the data methodology page.