Chuo Ward, Fukuoka Airbnb Market Data 2026: STR Report & Statistics
How much can you earn on Airbnb in Chuo Ward, Fukuoka? Based on AirROI's 2026 dataset (July 2025 – June 2026), the short answer is $29,965 per year — at a $168 nightly rate, 63.2% occupancy, and a $114 RevPAR that reflects strong rate-to-revenue efficiency across the market.
At 79 active listings, Chuo Ward is a boutique market where solid booking activity throughout the year.
Regulation is high and 100% of listings show active registration — compliance is the cost of entry. In a market this size, differentiated listings with strong reviews can capture outsized returns relative to the competition.
Table of Contents [hide] [show]
What Are the Key Airbnb Metrics in Chuo Ward?
In Chuo Ward, the headline Airbnb metrics are $29,965 in average annual revenue,63.2% occupancy, $168 ADR, and $114 in RevPAR, and guests book about 41 days in advance.
How Much Do Airbnb Hosts Earn Monthly in Chuo Ward?
Understanding the monthly revenue variations for Airbnb listings in Chuo Ward is key to maximizing your short term rental income potential. Seasonality significantly impacts earnings. Our analysis, based on data from the past 12 months, shows that the peak revenue month for STRs in Chuo Ward is typically March, while June often presents the lowest earnings, highlighting opportunities for strategic pricing adjustments during shoulder and low seasons. Explore the typical Airbnb income in Chuo Ward across different performance tiers:
- Best-in-class properties (Top 10%) achieve $6,523+ monthly, often utilizing dynamic pricing and superior guest experiences.
- Strong performing properties (Top 25%) earn $4,154 or more, indicating effective management and desirable locations/amenities.
- Typical properties (Median) generate around $2,691 per month, representing the average market performance.
- Entry-level properties (Bottom 25%) see earnings around $1,725, often with potential for optimization.
Average Monthly Airbnb Earnings Trend in Chuo Ward
What Is the Monthly Airbnb Occupancy Rate in Chuo Ward?
Maximize your bookings by understanding the Chuo Ward STR occupancy trends. Seasonal demand shifts significantly influence how often properties are booked. Typically, Decembersees the highest demand (peak season occupancy), while June experiences the lowest (low season). Effective strategies, like adjusting minimum stays or offering promotions, can boost occupancy during slower periods. Here's how different property tiers perform in Chuo Ward:
- Best-in-class properties (Top 10%) achieve 89%+ occupancy, indicating high desirability and potentially optimized availability.
- Strong performing properties (Top 25%) maintain 80% or higher occupancy, suggesting good market fit and guest satisfaction.
- Typical properties (Median) have an occupancy rate around 67%.
- Entry-level properties (Bottom 25%) average 50% occupancy, potentially facing higher vacancy.
Average Monthly Occupancy Rate Trend in Chuo Ward
What Is the Average Airbnb Nightly Rate in Chuo Ward?
Effective short term rental pricing strategy in Chuo Ward involves understanding monthly ADR fluctuations. The Average Daily Rate (ADR) for Airbnb in Chuo Ward typically peaks in May and dips lowest during January. Leveraging Airbnb dynamic pricing tools or strategies based on this seasonality can significantly boost revenue. Here's a look at the typical nightly rates achieved:
- Best-in-class properties (Top 10%) command rates of $311+ per night, often due to premium features or locations.
- Strong performing properties (Top 25%) achieve nightly rates of $205 or more.
- Typical properties (Median) charge around $135 per night.
- Entry-level properties (Bottom 25%) earn around $100 per night.
Average Daily Rate (ADR) Trend by Month in Chuo Ward
What Is the RevPAR for Airbnb in Chuo Ward?
RevPAR in Chuo Ward is currently $114. Because RevPAR combines nightly rates with realized occupancy, it is one of the cleanest ways to compare how efficiently listings turn demand into revenue across the market.
- Entry-level properties (Bottom 25%) see $58 RevPAR.
- Typical properties (Median) generate $92 RevPAR.
- Strong performers (Top 25%) earn $136 RevPAR.
- Best-in-class (Top 10%) achieve $242 RevPAR.
Average Monthly RevPAR Trend in Chuo Ward
RevPAR Insights for Chuo Ward
- The average RevPAR in Chuo Ward is $114. This metric combines nightly rates with realized occupancy, making it one of the best single-number indicators of market efficiency.
- The gap between the top 10% ($242) and bottom 25% ($58) is $184, indicating significant performance disparity driven by property quality, pricing strategy, and location.
- RevPAR peaks in Feb and bottoms out in Jun, mirroring the broader seasonal demand pattern and suggesting opportunities for dynamic pricing.
Recommendations for Hosts
- Track your own RevPAR monthly against these Chuo Ward benchmarks. If your RevPAR falls below the median of $92, examine whether low occupancy or low ADR is the primary drag.
- Top-quartile listings achieve $136+ RevPAR through a combination of competitive pricing, strong reviews, and strategic amenities. Target this tier through incremental improvements.
- Use RevPAR rather than revenue alone when comparing properties of different sizes — it normalizes for available nights and gives a more accurate picture of performance.
Get Live Chuo Ward Market Intelligence 👇
Explore Real-time Analytics
When Is the Peak Season for Airbnb in Chuo Ward?
Chuo Ward's peak Airbnb season falls in March, May, April, while the softest stretch is January, June, July. Overall, the market shows moderate seasonality with distinct peak and low periods, which should guide pricing, minimum stays, and cash-flow planning.
Peak Season (March, May, April)
- Revenue averages $4,048 per month
- Occupancy rates average 66.3%
- Daily rates average $191
Shoulder Season
- Revenue averages $3,457 per month
- Occupancy maintains around 66.9%
- Daily rates hold near $159
Low Season (January, June, July)
- Revenue drops to average $2,695 per month
- Occupancy decreases to average 52.5%
- Daily rates adjust to average $160
Seasonality Insights for Chuo Ward
- The Airbnb seasonality pattern in Chuo Ward shows moderate seasonality with distinct peak and low periods. While the sections above show seasonal averages, it is also insightful to look at the extremes:
- During the high season, the absolute peak month showcases Chuo Ward's highest earning potential, with monthly revenues climbing to $4,232, occupancy reaching 73.0%, and ADRs peaking at $198.
- Conversely, the slowest single month marks the market's lowest point — revenue may dip to $2,497, occupancy could drop to 43.2%, and ADRs may adjust to $142.
- Understanding both the seasonal averages and these monthly peaks and troughs in revenue, occupancy, and ADR is crucial for maximizing your Airbnb profit potential in Chuo Ward.
Seasonal Strategies for Maximizing Profit
- Peak Season: Maximize revenue through premium pricing. In a high-regulation market like Chuo Ward, ensure your permit covers the number of nights you plan to book — some jurisdictions cap annual rental days.
- Low Season: Even in a market with solid annual occupancy, the slower months benefit from competitive pricing and flexible check-in/check-out windows. Target remote workers and extended-stay travelers who value value over peak-season amenities.
- Shoulder Seasons: Implement dynamic pricing that bridges peak and low rates. Target weekend travelers, local events, and business visitors. Slightly more flexible terms than peak season can help maintain occupancy without deep discounting.
- Regularly analyze your own performance against these Chuo Ward seasonality benchmarks and adjust your pricing and availability strategy accordingly.
Do You Need a License for Airbnb in Chuo Ward?
Yes, Chuo Ward, Fukuoka, Japan enforces high STR regulations and 100% of active listings show registration evidence — indicating that enforcement is active and compliance is a prerequisite for operating legally. Hosts entering this market should budget for permit fees, inspections, and potential occupancy tax obligations as part of their startup costs. Always verify the latest short-term rental regulations and Airbnb license requirements directly with local government authorities for Chuo Ward to ensure full compliance before hosting.
(Source: AirROI data, 2026, based on 100% licensed listings)
What Are the Best Neighborhoods for Airbnb in Chuo Ward?
Chuo Ward is a smaller vacation rental market where a handful of neighborhoods drive most of the booking activity. Choosing the right area is especially important in boutique markets — there is less room for a mediocre location to succeed on volume alone. The areas below highlight where short-term rental demand is strongest and why.
| Neighborhood / Area | Why Host Here? (Target Guests & Appeal) | Key Attractions & Landmarks |
|---|---|---|
| Tenjin | Chuo Ward's commercial and shopping hub, ideal for tourists and locals alike. Known for its vibrant atmosphere, it offers a variety of shopping, dining, and entertainment options. | Tenjin Underground Shopping Mall, Tenjin Core, ACROS Fukuoka, Tenjin Central Park, Fukuoka Asian Art Museum |
| Canal City Hakata | A large shopping and entertainment complex that attracts both tourists and locals. Perfect for travelers looking for dining, shopping, and cultural experiences all in one place. | Canal City Shopping Mall, Fukuoka Tower, theater shows at Canal City, Ramen Stadium, Fukuoka City Museum |
| Ohori Park | A beautiful urban park that provides a tranquil escape from the city. It's popular with families and nature lovers, ideal for those seeking relaxation during their stay. | Ohori Park Lake, Japanese Garden, Nishi Park, Fukuoka Art Museum, running and cycling paths |
| Maizuru Park | Home to historical sites and scenic walking paths, this area is key for culture enthusiasts. Visitors can explore the ruins of Fukuoka Castle and enjoy seasonal festivities. | Fukuoka Castle Ruins, Maizuru Park, Nishi Park, Cherry Blossom Viewing, Fukuoka City Museum |
| Yakuin | A trendy, upscale neighborhood well-known for its dining scene and nightlife. Easily accessible via public transport and with a mix of modern and traditional attractions. | Yakuin Shopping Street, Kego Shrine, bars and izakayas, fashion boutiques, Cafe Culture |
| Kego | A bustling area with a mix of shopping options and gourmet food. Known for Kego Park, it's a lively zone that draws both residents and visitors looking for a vibrant experience. | Kego Park, Kego Shrine, Shopping malls, Gourmet restaurants, Street performances |
| Hakata River | The riverside offers serene views and is a popular spot for festivals and events. An ideal location for guests looking for scenic walks and cultural experiences. | Hakata River Cruise, Hakata Bay, Festivals on the river, Walking paths, Cherry blossoms in spring |
| Fukuoka Tower | An iconic landmark that provides breathtaking views of the city and is close to the beach. Attracts tourists seeking both excitement and beautiful sights. | Fukuoka Tower Observation Deck, Momochi Seaside Park, Marinoa City Fukuoka, Fukuoka Dome, Waterfront activities |
Because Chuo Ward has a high regulation profile, confirming that short-term rental permits are available in your target neighborhood is a critical first step before committing to a property purchase. Regulation can vary at the neighborhood or district level even within the same city.
What Types of Properties Are on Airbnb in Chuo Ward?
Room Type Distribution
Property Type Distribution
Market Composition Insights for Chuo Ward
- The Chuo Ward Airbnb market composition is heavily skewed towards Entire Home/Apt listings, which make up 65.8% of the 79 active rentals. This indicates strong guest preference for privacy and space.
- However, a notable 34.2% share for Private Rooms suggests opportunities for budget-conscious travelers or hosts renting out spare rooms.
- Looking at the property type distribution in Chuo Ward, Apartment/Condo properties are the most common (78.5%), reflecting the local real estate landscape.
- The presence of 7.6% Hotel/Boutique listings indicates integration with traditional hospitality.
- Smaller segments like others (combined 1.3%) offer potential for unique stay experiences.
Chuo Ward Airbnb Room Capacity Analysis (2026): Bedroom Distribution
Distribution of Listings by Number of Bedrooms
Room Capacity Insights for Chuo Ward
- The dominant room capacity in Chuo Ward is 1 bedroom listings, making up 50.6% of the market. This suggests a strong demand for properties suitable for couples or solo travelers.
- Together, 1 bedroom and 2 bedrooms properties represent 64.5% of the active Airbnb listings in Chuo Ward, indicating a high concentration in these sizes.
- With over half the market (50.6%) consisting of studios or 1-bedroom units, Chuo Ward is particularly well-suited for individuals or couples.
Chuo Ward Vacation Rental Guest Capacity Trends (2026)
Distribution of Listings by Guest Capacity
Guest Capacity Insights for Chuo Ward
- The most common guest capacity trend in Chuo Ward vacation rentals is listings accommodating 4 guests (21.5%). This suggests the primary traveler segment is likely small families or groups.
- Properties designed for 4 guests and 8+ guests dominate the Chuo Ward STR market, accounting for 38.0% of listings.
- 29.1% of properties accommodate 6+ guests, serving the market segment for larger families or group travel in Chuo Ward.
- On average, properties in Chuo Ward are equipped to host 3.8 guests.
How Do Listings in Chuo Ward Compare on Quality?
Listing quality in Chuo Ward can be approximated through presentation depth, bedroom count, and how often hosts disclose exact locations. These signals show how professionally the local supply base is merchandised.
Listing Quality Insights for Chuo Ward
- At 38.7 photos per listing on average, Chuo Ward hosts invest well in visual presentation. Listings with 20+ photos consistently outperform in search ranking and conversion.
- 51.9% of listings show their exact location. Lower disclosure rates can increase booking hesitation — guests want to know exactly where they are staying.
Recommendations for Hosts
- Enable exact location if possible — it removes a common source of guest uncertainty and can improve your listing's position in map-based searches.
- Use these quality indicators as a self-audit checklist. Listings that exceed the Chuo Ward averages across all three metrics are better positioned for premium pricing.
What Amenities Do Airbnb Guests Expect in Chuo Ward?
Amenity Prevalence
Amenity Insights for Chuo Ward
- Essential amenities in Chuo Ward that guests expect include: Wifi, Smoke alarm, Air conditioning, Hair dryer. Lacking these (any) could significantly impact bookings.
- Popular amenities like Shampoo, Hangers, Conditioner are common but not universal. Offering these can provide a competitive edge.
Recommendations for Hosts
- Ensure your listing includes all essential amenities for Chuo Ward: Wifi, Smoke alarm, Air conditioning, Hair dryer.
- Prioritize adding missing essentials: Wifi.
- Consider adding popular differentiators like Shampoo or Hangers to increase appeal.
- Highlight unique or less common amenities you offer (e.g., hot tub, dedicated workspace, EV charger) in your listing description and photos.
- Regularly check competitor amenities in Chuo Ward to stay competitive.
Which Airbnb Amenities Boost Revenue in Chuo Ward?
Not every amenity matters equally. This table focuses on the amenities most associated with higher revenue in Chuo Ward, which makes it more useful for prioritizing upgrades than a simple popularity list alone.
| Amenity | Prevalence | Revenue With | Revenue Without | Revenue Uplift |
|---|---|---|---|---|
Baby bathHigh opportunity | 6.3% | $78,560 | $26,682 | 194.4% |
Refrigerator | 88.6% | $32,316 | $11,683 | 176.6% |
Children’s books and toysHigh opportunity | 6.3% | $72,847 | $27,068 | 169.1% |
Free parking on premises | 10.1% | $66,924 | $25,801 | 159.4% |
High chair | 11.4% | $65,336 | $25,417 | 157.1% |
Conditioner | 92.4% | $31,366 | $12,925 | 142.7% |
Children’s dinnerware | 12.7% | $58,305 | $25,858 | 125.5% |
Wine glasses | 17.7% | $52,436 | $25,125 | 108.7% |
Kitchen | 77.2% | $33,844 | $16,820 | 101.2% |
Microwave | 89.9% | $31,551 | $15,891 | 98.5% |
Revenue Impact Insights for Chuo Ward
- Baby bath tops the revenue impact list with a 194.4% uplift — listings with this amenity earn $78,560 vs. $26,682 without it.
- High-opportunity amenities — Baby bath, Children’s books and toys — combine revenue uplift above 100% with prevalence under 10%, meaning most competitors haven't adopted them yet.
- Refrigerator, Conditioner, Microwave — while widespread — still correlate with meaningful revenue gains, making them table stakes rather than true differentiators.
Recommendations for Hosts
- Prioritize adding Baby bath — it has the best combination of high revenue impact and low market saturation in Chuo Ward.
- Focus your upgrade budget on amenities in the top half of this table. Below-median amenities may improve guest experience but contribute less to revenue growth.
- Highlight revenue-impacting amenities prominently in your listing title, photos, and description — guests can't value what they don't notice.
Dive Deeper: Advanced Chuo Ward STR Market Data (2026)
Ready to unlock more insights? AirROI provides access to advanced metrics and comprehensive Airbnb data for Chuo Ward. Explore detailed analytics beyond this report to refine your investment strategy, optimize pricing, and maximize your vacation rental profits.
Explore Advanced MetricsChuo Ward Airbnb Guest Demographics & Profile Analysis (2026)
Guest Profile Summary for Chuo Ward
- The typical guest profile for Airbnb in Chuo Ward consists of predominantly international visitors (89%), with top international origins including Japan, typically belonging to the Post-2000s (Gen Z/Alpha) group (50%), primarily speaking English or Chinese.
- Domestic travelers account for 11.0% of guests.
- Key international markets include South Korea (32%) and Japan (11%).
- Top languages spoken are English (39.5%) followed by Chinese (18.3%).
- A significant demographic segment is the Post-2000s (Gen Z/Alpha) group, representing 50% of guests.
Recommendations for Hosts
- Focus marketing internationally, particularly towards travelers from Japan.
- Tailor amenities and listing descriptions to appeal to the dominant Post-2000s (Gen Z/Alpha) demographic (e.g., highlight fast WiFi, smart home features, local guides).
- Highlight unique local experiences or amenities relevant to the primary guest profile.
- Consider seasonal promotions aligned with peak travel times for key origin markets.
What Are Airbnb Guest Ratings in Chuo Ward?
Listings in Chuo Ward average 4.81 out of 5 overall, with about 60.7 reviews per active listing and 39.2% of listings carrying the Guest Favorite badge.
Rating Breakdown by Category
Guest Rating Insights for Chuo Ward
- With an overall rating of 4.81, Chuo Ward listings meet an exceptionally high bar. Guests consistently report strong satisfaction, which drives repeat bookings and referral traffic.
- The strongest subcategory is Communication (4.87), while Value (4.72) trails behind — a useful signal for hosts looking to prioritize upgrades.
- 39.2% of listings carry the Guest Favorite badge, a strong trust signal that can meaningfully lift click-through and booking rates.
Recommendations for Hosts
- Focus improvement efforts on Value — even small gains in the weakest subcategory can lift overall ratings and search ranking.
- Encourage guests to leave reviews after checkout. Listings with more reviews rank higher in search results and convert browsers into bookers more effectively.
Chuo Ward Airbnb Booking Patterns (2026): Available vs. Booked Days
Available Days Distribution
Booked Days Distribution
Booking Pattern Insights for Chuo Ward
- The most common availability pattern in Chuo Ward falls within the 181-270 days range, representing 46.8% of listings. This suggests many properties have significant open periods on their calendars.
- Approximately 63.3% of listings show high availability (181+ days open annually), indicating potential for increased bookings or specific owner usage patterns.
- For booked days, the 91-180 days range is most frequent in Chuo Ward (46.8%), reflecting common guest stay durations or potential owner blocking patterns.
- A notable 38.0% of properties secure long booking periods (181+ days booked per year), highlighting successful long-term rental strategies or significant owner usage.
How Far in Advance Do Guests Book Airbnb in Chuo Ward?
Average Booking Lead Time by Month
Booking Lead Time Insights for Chuo Ward
- The overall average booking lead time for vacation rentals in Chuo Ward is 41 days.
- Guests book furthest in advance for stays during May (average 53 days), likely coinciding with peak travel demand or local events.
- The shortest booking windows occur for stays in July (average 28 days), indicating more last-minute travel plans during this time.
- Seasonally, Spring (49 days avg.) sees the longest lead times, while Summer (34 days avg.) has the shortest, reflecting typical travel planning cycles.
Recommendations for Hosts
- Use the overall average lead time (41 days) as a baseline for your pricing and availability strategy in Chuo Ward.
- For May stays, consider implementing length-of-stay discounts or slightly higher rates for bookings made less than 53 days out to capitalize on advance planning.
- Target marketing efforts for the Spring season well in advance (at least 49 days) to capture early planners.
- Monitor your own booking lead times against these Chuo Ward averages to identify opportunities for dynamic pricing adjustments.
What Is the Average Length of Stay for Airbnb in Chuo Ward?
Guests in Chuo Ward stay about 3.1 nights on average, generating roughly 3,233 reservations and 40.9 bookings per listing in the latest AirROI dataset. The most common check-in time is 4:00 PM and check-out is 11:00 AM.
Monthly Length of Stay in Chuo Ward
Check-in Time Distribution
Check-out Time Distribution
Stay Pattern Insights for Chuo Ward
- A mid-range stay length points to leisure-driven demand — weekend getaways and short vacations. Hosts should optimize for quick turnover efficiency while keeping the guest experience smooth.
- At 40.9 bookings per listing, the turnover rate is high. Hosts with streamlined operations (self-check-in, automated messaging, reliable cleaners) have a structural advantage.
- Stay lengths peak in Dec (5.9 nights) and shorten in Jul (2.1 nights). Adjust minimum-night requirements seasonally to match.
Recommendations for Hosts
- With shorter average stays, focus on streamlining turnover. Self-check-in, reliable cleaning crews, and pre-staged amenities can reduce per-booking operational costs.
- Set your check-in time to match or beat the market standard of 4:00 PM. Offering early check-in flexibility can be a low-cost differentiator.
- Monitor length-of-stay seasonality to adjust minimum-night requirements — longer minimums during peak periods maximize revenue while shorter minimums fill gaps in shoulder seasons.
Chuo Ward Airbnb Minimum Stay Requirements Analysis
Distribution of Listings by Minimum Night Requirement
1 Night
57 listings
72.2% of total
2 Nights
4 listings
5.1% of total
7-29 Nights
1 listings
1.3% of total
30+ Nights
17 listings
21.5% of total
Key Insights
- The most prevalent minimum stay requirement in Chuo Ward is 1 Night, adopted by 72.2% of listings. This highlights the market's preference for shorter, flexible bookings.
- A strong majority (77.3%) of the Chuo Ward Airbnb data shows acceptance of very short stays (1-2 nights), indicating a dynamic, high-turnover market.
- A significant segment (21.5%) caters to monthly stays (30+ nights) in Chuo Ward, pointing to opportunities in the extended-stay market.
Recommendations
- Align with the market by considering a 1 Night minimum stay, as 72.2% of Chuo Ward hosts use this setting.
- Explore offering discounts for stays of 30+ nights to attract the 21.5% of the market seeking extended stays.
- Adjust minimum nights based on seasonality – potentially shorter during low season and longer during peak demand periods in Chuo Ward.
Chuo Ward Airbnb Cancellation Policy Trends Analysis (2026)
Limited
6 listings
7.6% of total
Flexible
4 listings
5.1% of total
Moderate
19 listings
24.1% of total
Firm
49 listings
62% of total
Strict
1 listings
1.3% of total
Cancellation Policy Insights for Chuo Ward
- The prevailing Airbnb cancellation policy trend in Chuo Ward is Firm, used by 62% of listings.
- A majority (63.3%) of hosts in Chuo Ward utilize Firm or Strict policies, indicating a market where hosts prioritize booking security.
- Strict cancellation policies are quite rare (1.3%), potentially making listings with this policy less competitive unless justified by high demand or property type.
Recommendations for Hosts
- Consider adopting a Firm policy to align with the 62% market standard in Chuo Ward.
- Using a Strict policy might deter some guests, as only 1.3% of listings use it. Evaluate if potential revenue protection outweighs possible lower booking rates.
- Regularly review your cancellation policy against competitors and market demand shifts in Chuo Ward.
How Much Are Airbnb Cleaning Fees in Chuo Ward?
Cleaning fees in Chuo Ward are meaningful operating levers, not just pass-through charges. What matters most is how often hosts charge them, how high they run relative to market norms, and how large a share of gross revenue they consume.
Cleaning Fee Insights for Chuo Ward
- About 69.6% of Chuo Ward listings charge a cleaning fee — a mixed market where some hosts absorb the cost into nightly rates while others break it out.
- The gap between the average ($2,805) and median ($25) cleaning fee indicates some high-end properties are pulling the average up considerably.
- Cleaning fees represent 5.0% of gross revenue on average — a modest component of the overall booking price.
Recommendations for Hosts
- Price your cleaning fee competitively against the Chuo Ward median of $25. Fees significantly above market norms can deter bookings, especially for shorter stays.
- Monitor competitor cleaning fees regularly. Airbnb's search algorithm factors in total price, so a well-calibrated cleaning fee can improve your listing's ranking.
What Do the Top Airbnb Listings in Chuo Ward Look Like?
Benchmark your potential! Explore examples of top-performing Airbnb properties in Chuo Wardbased on Trailing Twelve Month (TTM) revenue. Analyze their characteristics, revenue, occupancy rate, and ADR to understand what drives success in this market.
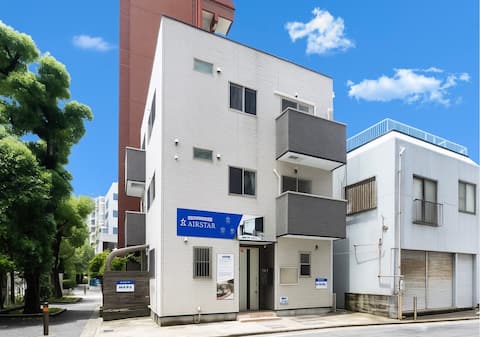
AIRSTAR | Up to 25 guests! 7LDK 3-story house for rent & free parking for 2 cars
Entire Place • 6 bedrooms
![Tenjin Minami/Kiyokawa [Free parking for 2 cars/2 toilets] Maximum 6 people/2 single beds 2 double b](https://a0.muscache.com/im/pictures/hosting/Hosting-U3RheVN1cHBseUxpc3Rpbmc6MTM0OTY3NTQwNjU5MzIwOTAwOQ==/original/59b6dffd-5aa1-45f5-ac0c-3d36adc6dfa3.png?im_w=480&im_format=avif)
Tenjin Minami/Kiyokawa [Free parking for 2 cars/2 toilets] Maximum 6 people/2 single beds 2 double b
Entire Place • 3 bedrooms
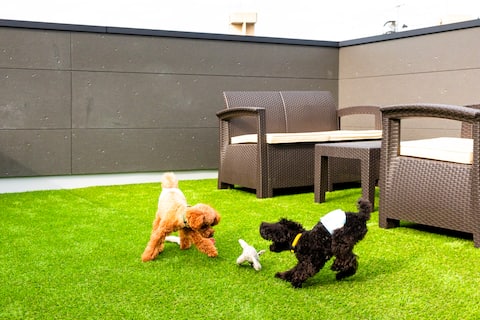
- Amp Flat HEC 01 - Private lodging that can be enjoyed with pets/Maximum 8 people/Free parking/10-m
Entire Place • 3 bedrooms
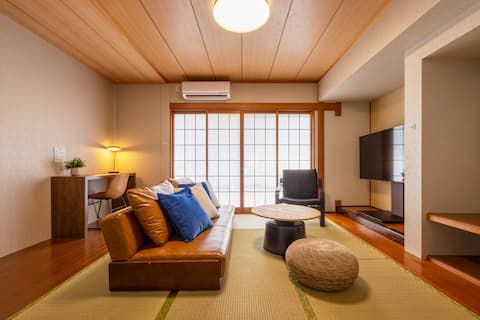
Center of DaimyoYurah Tenjin | 105㎡ | 12p 2 Floors
Entire Place • 3 bedrooms
Sleeps 7 /300㎡ / 4 min subway/Top floor/Ohori Park
Private Room • 3 bedrooms
No. 203/7 mins walk from Tenjin Minami Station and Yakuin Station/New building 50㎡/1LDK/Max 6 people
Private Room • 2 bedrooms
Note: Performance varies based on location, size, amenities, seasonality, and management quality. Data reflects the past 12 months.
Who Are the Top Airbnb Hosts in Chuo Ward?
Learn from the best! This table showcases top-performing Airbnb hosts in Chuo Ward based on the number of properties managed and estimated total revenue over the past year. Analyze their scale and performance metrics.
| Host Name | Properties | Grossing Revenue | Stay Reviews | Avg Rating |
|---|---|---|---|---|
| Hoshino Rin | 4 | $244,151 | 139 | 4.58/5.0 |
| モク | 8 | $193,670 | 374 | 4.91/5.0 |
| 唯 | 3 | $154,444 | 176 | 4.94/5.0 |
| Mai | 9 | $147,507 | 1001 | 4.71/5.0 |
| アメニティーホテル | 2 | $111,159 | 211 | 4.91/5.0 |
| Ionstay | 1 | $101,569 | 64 | 4.98/5.0 |
| Mg | 3 | $100,362 | 54 | 4.83/5.0 |
| Kanako | 2 | $96,440 | 175 | 4.96/5.0 |
| Ayaka | 3 | $90,662 | 119 | 4.95/5.0 |
| Amp Flat | 2 | $89,319 | 114 | 4.83/5.0 |
Analyzing the strategies of top hosts, such as their property selection, pricing, and guest communication, can offer valuable lessons for optimizing your own Airbnb operations in Chuo Ward.
Who Are the Airbnb Hosts in Chuo Ward?
Chuo Ward is a quality-focused market, with a high Superhost share and fairly mature operating standards.
Host Profile Insights for Chuo Ward
- With 65.8% Superhosts, Chuo Ward has an experienced host base that sets high guest expectations. New entrants should plan for competitive quality standards.
- 17.7% of listings have Instant Book enabled. Lower Instant Book adoption means many guests must request approval, which can slow conversions.
- 93.7% of listings use Airbnb's simplified pricing (host-only fee), where the host pays the entire platform service fee and the guest sees one all-in price with no separate Airbnb service charge. High adoption signals a professional, PMS-connected host base — Airbnb mandates simplified pricing for software-connected listings.
Recommendations for Hosts
- Consider enabling Instant Book — it reduces booking friction and Airbnb's algorithm tends to favor Instant Book listings in search results.
- With 38.0% cohosted listings, there may be a growing local market for property management services.
- Benchmark your host metrics against these Chuo Ward averages regularly and adjust your hosting strategy based on what top performers do differently.
How Does Chuo Ward's Airbnb Market Compare to Nearby Cities?
How does the Chuo Ward Airbnb market stack up against its neighbors? Compare key performance metrics like average monthly revenue, ADR, and occupancy rates in surrounding areas to understand the broader regional STR landscape.
Compared with Shime, Chuo Ward has 6 percentage points lower occupancy and about $37 lower ADR. That helps frame whether this market is winning more on demand, pricing, or both.
| Market | Active Properties | Monthly Revenue | Daily Rate | Avg. Occupancy |
|---|---|---|---|---|
| Minamioguni | 22 | $3,248 | $269.59 | 41% |
| Shime | 12 | $3,217 | $204.98 | 69% |
| Yufu | 157 | $2,858 | $239.69 | 47% |
| Itoshima | 103 | $2,206 | $220.63 | 42% |
| Dazaifu | 55 | $2,152 | $160.35 | 45% |
| Minamiaso | 35 | $2,066 | $170.72 | 46% |
| Aso | 57 | $2,036 | $177.65 | 47% |
| Asakura | 12 | $2,025 | $179.88 | 40% |
| Fukuoka | 1,706 | $1,988 | $147.86 | 51% |
| Hagi | 18 | $1,723 | $141.88 | 43% |
Frequently Asked Questions About Airbnb in Chuo Ward
These quick answers summarize the most common investor and operator questions using AirROI's latest market data for Chuo Ward.
How much do Airbnb hosts make in Chuo Ward?
Chuo Ward hosts earn about $29,965 per year on average, with an average nightly rate of $168 and RevPAR of $114. Those figures describe the typical revenue environment for active listings in Chuo Ward, Fukuoka, not the ceiling for the best operators. Source: AirROI 2026 data, Chuo Ward market, July 2025 to June 2026.
What is the average Airbnb occupancy rate in Chuo Ward?
The average Airbnb occupancy rate in Chuo Ward is 63.2%. March is the strongest month and June is the softest, so hosts should expect demand to move meaningfully throughout the year rather than stay flat.
What is the average Airbnb daily rate in Chuo Ward?
Listings in Chuo Ward average $168 per night. The broader pricing spread also matters: lower-performing listings cluster closer to the lower quartiles, while premium homes can price materially above the city average when demand spikes or listing quality stands out.
How many Airbnb listings are active in Chuo Ward?
Chuo Ward currently has about 79 active Airbnb listings in AirROI's market dataset. That supply count helps explain how competitive the market is, how much depth there is for benchmarking, and whether the market behaves like a niche destination or a scaled urban market.
How strict are short-term rental regulations in Chuo Ward?
AirROI currently classifies the short-term rental regulation level in Chuo Ward as High. The dataset also shows about 100.0% of listings with registration evidence. That is a market signal, not legal advice, so hosts should still confirm current licensing and compliance rules locally before listing.
What is the RevPAR for Airbnb in Chuo Ward?
RevPAR in Chuo Ward is about $114. That metric combines pricing and occupancy into one efficiency number, so it is often a better quick benchmark than ADR alone when investors want to compare how well listings convert nightly rates into realized revenue.
Is Airbnb profitable in Chuo Ward?
With 63.2% occupancy and a RevPAR that captures more than half of the nightly rate, Chuo Ward shows strong signs of profitability for well-run listings. Average annual revenue is $29,965, but individual returns depend on property type, location within the city, and the host's operating efficiency.
How far in advance do guests book Airbnb in Chuo Ward?
The average booking lead time in Chuo Ward is about 41 days — a moderate lead time that gives hosts planning visibility while still benefiting from last-minute bookings. Hosts who understand their market's booking cadence can adjust minimum stays and pricing windows accordingly.
What are the best neighborhoods for Airbnb in Chuo Ward?
Based on AirROI's analysis, some of the top neighborhoods for short-term rentals in Chuo Ward include Tenjin, Canal City Hakata, Ohori Park. Each area attracts different guest profiles — from business travelers to leisure visitors — so the best location depends on the property type and target audience a host is aiming for. See the full neighborhood breakdown above.
What type of property performs best on Airbnb in Chuo Ward?
entire_home listings make up 65.8% of the active supply in Chuo Ward. The most common configuration does not always mean the most profitable — operators who identify underserved property types or bedroom counts can sometimes outperform the market average by filling a gap in local supply.
How does Chuo Ward compare to nearby Airbnb markets?
Among neighboring markets, Minamioguni posts $38,977 in average annual revenue with 41.4% occupancy, compared to Chuo Ward's $29,965 and 63.2%. Comparing nearby markets helps investors understand whether a destination's performance reflects local demand or broader regional trends.
What is the average length of stay in Chuo Ward?
The average Airbnb stay length in Chuo Ward is about 3.1 nights. That matters for turnover, cleaning operations, and pricing strategy because shorter stays increase changeovers while longer stays can smooth occupancy and reduce operational friction.
What is the average Airbnb guest rating in Chuo Ward?
Airbnb listings in Chuo Ward average 4.81 out of 5 overall. About 39.2% of listings carry the guest favorite badge, which suggests a meaningful share of inventory is competing on review quality rather than price alone.
Which amenities boost Airbnb revenue in Chuo Ward?
Baby bath and Refrigerator are among the strongest revenue-linked amenities in Chuo Ward. In AirROI's latest dataset, listings with these amenities outperform those without on average revenue, which makes amenities analysis useful for prioritizing investment and listing upgrades.
Do Airbnb hosts charge cleaning fees in Chuo Ward?
Yes. About 69.6% of active Airbnb listings in Chuo Ward charge a cleaning fee, and the average fee is $2,805. The more important operating benchmark is how much of gross revenue that fee consumes, not just the absolute dollar amount.
What percentage of Airbnb hosts are Superhosts in Chuo Ward?
A 65.8% Superhost rate signals a highly competitive market where review quality and responsiveness are table stakes, not differentiators.
About AirROI Market Data
AirROI tracks over 20 million properties across 190+ countries and maintains 15+ years of historical performance data, making it one of the deepest Airbnb and STR intelligence platforms available. The analytics pipeline aggregates listing-level data monthly — revenue, occupancy, nightly rates, RevPAR, guest demographics, booking patterns, and competitive supply — so investors and operators can benchmark any market against its own history and against neighboring destinations.
Real estate investors, property managers, financial institutions, hedge funds, tourism boards, hospitality consultants, tech platforms, and academic researchers rely on AirROI data to underwrite acquisitions, optimize pricing, model macro trends, and conduct peer-reviewed research. Data is available through in-depth market reports like this one and the Airbnb API with 22 endpoints and an Airbnb MCP Server for AI agents.
AirROI proprietary analytics as of 2026-06-30. Metrics reflect trailing twelve-month aggregates from active listings. Revenue figures are market averages, not projections. Neighborhood descriptions are AI-generated and reviewed for accuracy. For full methodology, see the data methodology page.