Sa Pa Airbnb Market Analysis 2026: Short Term Rental Data & Vacation Rental Statistics in Lào Cai Province, Vietnam
Is Airbnb profitable in Sa Pa in 2026? Explore comprehensive Airbnb analytics for Sa Pa, Lào Cai Province, Vietnam to uncover income potential. This 2026 STR market report for Sa Pa, based on AirROI data from February 2025 to January 2026, reveals key trends in the market of 257 active listings.
Whether you're considering an Airbnb investment in Sa Pa, optimizing your existing vacation rental, or exploring rental arbitrage opportunities, understanding the Sa Pa Airbnb data is crucial. Leveraging the low regulation environment is key to maximizing your short term rental income potential. Let's dive into the specifics.
Key Sa Pa Airbnb Performance Metrics Overview
Monthly Airbnb Revenue Variations & Income Potential in Sa Pa (2026)
Understanding the monthly revenue variations for Airbnb listings in Sa Pa is key to maximizing your short term rental income potential. Seasonality significantly impacts earnings. Our analysis, based on data from the past 12 months, shows that the peak revenue month for STRs in Sa Pa is typically December, while June often presents the lowest earnings, highlighting opportunities for strategic pricing adjustments during shoulder and low seasons. Explore the typical Airbnb income in Sa Pa across different performance tiers:
- Best-in-class properties (Top 10%) achieve $1,007+ monthly, often utilizing dynamic pricing and superior guest experiences.
- Strong performing properties (Top 25%) earn $557 or more, indicating effective management and desirable locations/amenities.
- Typical properties (Median) generate around $251 per month, representing the average market performance.
- Entry-level properties (Bottom 25%) see earnings around $100, often with potential for optimization.
Average Monthly Airbnb Earnings Trend in Sa Pa
Sa Pa Airbnb Occupancy Rate Trends (2026)
Maximize your bookings by understanding the Sa Pa STR occupancy trends. Seasonal demand shifts significantly influence how often properties are booked. Typically, Novembersees the highest demand (peak season occupancy), while June experiences the lowest (low season). Effective strategies, like adjusting minimum stays or offering promotions, can boost occupancy during slower periods. Here's how different property tiers perform in Sa Pa:
- Best-in-class properties (Top 10%) achieve 63%+ occupancy, indicating high desirability and potentially optimized availability.
- Strong performing properties (Top 25%) maintain 43% or higher occupancy, suggesting good market fit and guest satisfaction.
- Typical properties (Median) have an occupancy rate around 23%.
- Entry-level properties (Bottom 25%) average 10% occupancy, potentially facing higher vacancy.
Average Monthly Occupancy Rate Trend in Sa Pa
Average Daily Rate (ADR) Airbnb Trends in Sa Pa (2026)
Effective short term rental pricing strategy in Sa Pa involves understanding monthly ADR fluctuations. The Average Daily Rate (ADR) for Airbnb in Sa Pa typically peaks in August and dips lowest during March. Leveraging Airbnb dynamic pricing tools or strategies based on this seasonality can significantly boost revenue. Here's a look at the typical nightly rates achieved:
- Best-in-class properties (Top 10%) command rates of $98+ per night, often due to premium features or locations.
- Strong performing properties (Top 25%) achieve nightly rates of $56 or more.
- Typical properties (Median) charge around $33 per night.
- Entry-level properties (Bottom 25%) earn around $21 per night.
Average Daily Rate (ADR) Trend by Month in Sa Pa
Get Live Sa Pa Market Intelligence 👇

Explore Real-time Analytics
Airbnb Seasonality Analysis & Trends in Sa Pa (2026)
Peak Season (December, November, July)
- Revenue averages $504 per month
- Occupancy rates average 31.6%
- Daily rates average $58
Shoulder Season
- Revenue averages $448 per month
- Occupancy maintains around 30.7%
- Daily rates hold near $54
Low Season (May, June, September)
- Revenue drops to average $375 per month
- Occupancy decreases to average 24.4%
- Daily rates adjust to average $53
Seasonality Insights for Sa Pa
- The Airbnb seasonality in Sa Pa shows moderate seasonality with distinct peak and low periods. While the sections above show seasonal averages, it's also insightful to look at the extremes:
- During the high season, the absolute peak month showcases Sa Pa's highest earning potential, with monthly revenues capable of climbing to $516, occupancy reaching a high of 35.6%, and ADRs peaking at $61.
- Conversely, the slowest single month of the year, typically falling within the low season, marks the market's lowest point. In this month, revenue might dip to $364, occupancy could drop to 22.8%, and ADRs may adjust down to $50.
- Understanding both the seasonal averages and these monthly peaks and troughs in revenue, occupancy, and ADR is crucial for maximizing your Airbnb profit potential in Sa Pa.
Seasonal Strategies for Maximizing Profit
- Peak Season: Maximize revenue through premium pricing and potentially longer minimum stays. Ensure high availability.
- Low Season: Offer competitive pricing, special promotions (e.g., extended stay discounts), and flexible cancellation policies. Target off-season travelers like remote workers or budget-conscious guests.
- Shoulder Seasons: Implement dynamic pricing that balances peak and low rates. Target weekend travelers or specific events. Offer slightly more flexible terms than peak season.
- Regularly analyze your own performance against these Sa Pa seasonality benchmarks and adjust your pricing and availability strategy accordingly.
Best Areas for Airbnb Investment in Sa Pa (2026)
Exploring the top neighborhoods for short-term rentals in Sa Pa? This section highlights key areas, outlining why they are attractive for hosts and guests, along with notable local attractions. Consider these locations based on your target guest profile and investment strategy.
| Neighborhood / Area | Why Host Here? (Target Guests & Appeal) | Key Attractions & Landmarks |
|---|---|---|
| Fansipan Mountain | Known as the highest mountain in Vietnam, Fansipan is a major attraction for trekkers and nature lovers. Hosts can cater to adventurers seeking stunning mountain views and hiking opportunities. | Fansipan Cable Car, Fansipan Trekking Trails, Silver Waterfall, Rice Terraces, Local Ethnic Villages |
| Sa Pa Town Center | The hustle and bustle of Sa Pa's town center offers a blend of local culture, shopping, and dining. Ideal for visitors wanting to explore the local lifestyle and enjoy a vibrant atmosphere. | Sa Pa Market, Our Lady of Rosary Church, Cultural Center, Local Food Stalls, Shopping Streets |
| Cat Cat Village | A picturesque traditional village of the H'Mong ethnic group, attracting tourists interested in cultural experiences and scenic landscapes. Great for hosting guests seeking authenticity. | Cat Cat Waterfall, Traditional H'Mong Houses, Local Handicrafts, Rice Fields, Scenic Hiking Paths |
| Ta Van Village | Famous for its terraced rice fields and peaceful rural environment. A lovely spot for guests looking for tranquility and nature experiences. | Terraced Rice Fields, Local Ethnic Homestays, Muong Hoa Valley, Traditional Farming Experience, Hiking Trails |
| Lao Chai Village | This village is known for its stunning views and connections to local ethnic minorities, ideal for visitors wanting to immerse in local culture and nature. | Lao Chai Rice Fields, Black H'Mong Culture, Stunning Valley Views, Local Craft Workshops, Hiking Opportunities |
| Ham Rong Mountain | A scenic spot within Sa Pa that offers beautiful gardens and views of the town and mountains, popular among travelers looking for nature and relaxation. | Ham Rong Flower Garden, Cloud Yard, Cultural Shows, Viewing Platforms, Walking Trails |
| Muong Hoa Valley | Renowned for its breathtaking landscapes and ancient stone carvings, this area attracts visitors interested in history and outdoor activities. | Ancient Stone Field, Hiking Routes, Breathtaking Views, Cultural Exploration, Campsites |
| O Quy Ho Pass | One of the highest mountain passes in Vietnam, offering breathtaking views and adventure opportunities for motorcycle enthusiasts and photographers. | Panoramic Views, Adventure Sports, Photography Spots, Cultural Exchange, Local Cuisine |
Understanding Airbnb License Requirements & STR Laws in Sa Pa (2026)
While Sa Pa, Lào Cai Province, Vietnam currently shows low STR regulations, specific Airbnb license requirements might still exist or change. Always verify the latest short term rental regulations and Airbnb license requirements directly with local government authorities for Sa Pa to ensure full compliance before hosting.
(Source: AirROI data, 2026, based on 0% licensed listings)
Top Performing Airbnb Properties in Sa Pa (2026)
Benchmark your potential! Explore examples of top-performing Airbnb properties in Sa Pabased on Trailing Twelve Month (TTM) revenue. Analyze their characteristics, revenue, occupancy rate, and ADR to understand what drives success in this market.
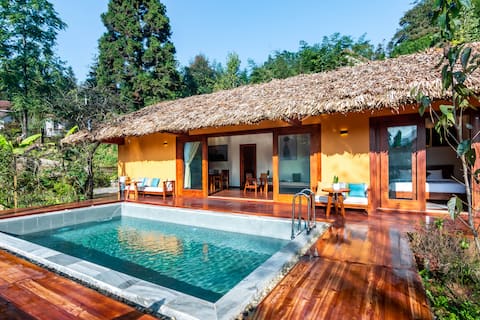
Chapa Hill Villa Sapa
Entire Place • 3 bedrooms
Full căn Deja Vu
Entire Place • 9 bedrooms

Ham Rong Moutain Sa Pa-03 bedroom
Entire Place • 3 bedrooms
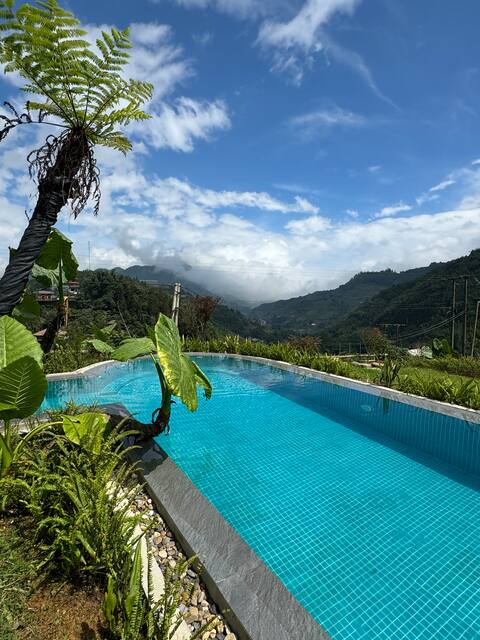
Private house with swimming pool
Entire Place • 4 bedrooms
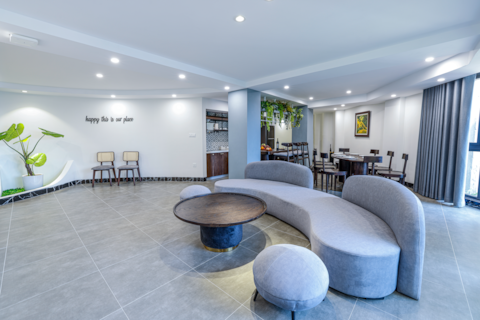
Nui Sa Pa -02 Bedroom- Sapa center
Entire Place • 2 bedrooms

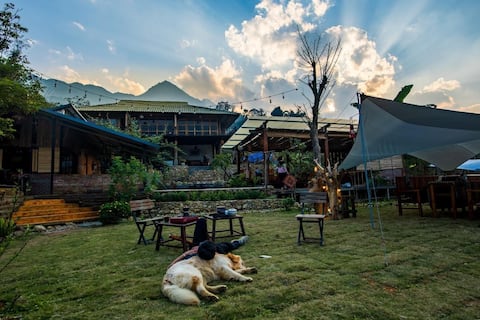
Phansi - Glamping, Coffee & BBQ - Sapa Town
Private Room • N/A
Note: Performance varies based on location, size, amenities, seasonality, and management quality. Data reflects the past 12 months.
Top Performing Airbnb Hosts in Sa Pa (2026)
Learn from the best! This table showcases top-performing Airbnb hosts in Sa Pa based on the number of properties managed and estimated total revenue over the past year. Analyze their scale and performance metrics.
| Host Name | Properties | Grossing Revenue | Stay Reviews | Avg Rating |
|---|---|---|---|---|
| Minh | 8 | $148,745 | 382 | 4.80/5.0 |
| Hoat | 7 | $65,206 | 272 | 4.90/5.0 |
| Thanh | 16 | $53,684 | 513 | 4.60/5.0 |
| Huong | 3 | $53,329 | 163 | 4.92/5.0 |
| Jungle | 9 | $45,669 | 643 | 4.91/5.0 |
| Dieu Tran | 9 | $34,520 | 1627 | 4.85/5.0 |
| Mo | 4 | $33,224 | 6 | Not Rated |
| Jenny | 3 | $28,982 | 77 | 4.82/5.0 |
| Duc Dung | 5 | $28,927 | 8 | 5.00/5.0 |
| Thanh | 6 | $28,098 | 220 | 4.78/5.0 |
Analyzing the strategies of top hosts, such as their property selection, pricing, and guest communication, can offer valuable lessons for optimizing your own Airbnb operations in Sa Pa.
Dive Deeper: Advanced Sa Pa STR Market Data (2026)
Ready to unlock more insights? AirROI provides access to advanced metrics and comprehensive Airbnb data for Sa Pa. Explore detailed analytics beyond this report to refine your investment strategy, optimize pricing, and maximize your vacation rental profits.
Explore Advanced MetricsSa Pa Short-Term Rental Market Composition (2026): Property & Room Types
Room Type Distribution
Property Type Distribution
Market Composition Insights for Sa Pa
- The Sa Pa Airbnb market composition is heavily skewed towards Private Room listings, which make up 68.9% of the 257 active rentals. This indicates strong guest preference for privacy and space.
- Looking at the property type distribution in Sa Pa, House properties are the most common (43.6%), reflecting the local real estate landscape.
- Houses represent a significant 43.6% portion, catering likely to families or larger groups.
- The presence of 35.8% Hotel/Boutique listings indicates integration with traditional hospitality.
- Smaller segments like unique stays (combined 3.5%) offer potential for unique stay experiences.
Sa Pa Airbnb Room Capacity Analysis (2026): Bedroom Distribution
Distribution of Listings by Number of Bedrooms
Room Capacity Insights for Sa Pa
- The dominant room capacity in Sa Pa is 1 bedroom listings, making up 48.6% of the market. This suggests a strong demand for properties suitable for couples or solo travelers.
- Together, 1 bedroom and 5+ bedrooms properties represent 57.2% of the active Airbnb listings in Sa Pa, indicating a high concentration in these sizes.
Sa Pa Vacation Rental Guest Capacity Trends (2026)
Distribution of Listings by Guest Capacity
Guest Capacity Insights for Sa Pa
- The most common guest capacity trend in Sa Pa vacation rentals is listings accommodating 2 guests (30.4%). This suggests the primary traveler segment is likely couples or solo travelers.
- Properties designed for 2 guests and 8+ guests dominate the Sa Pa STR market, accounting for 44.8% of listings.
- 18.3% of properties accommodate 6+ guests, serving the market segment for larger families or group travel in Sa Pa.
- On average, properties in Sa Pa are equipped to host 2.8 guests.
Sa Pa Airbnb Booking Patterns (2026): Available vs. Booked Days
Available Days Distribution
Booked Days Distribution
Booking Pattern Insights for Sa Pa
- The most common availability pattern in Sa Pa falls within the 271-366 days range, representing 72.4% of listings. This suggests many properties have significant open periods on their calendars.
- Approximately 91.5% of listings show high availability (181+ days open annually), indicating potential for increased bookings or specific owner usage patterns.
- For booked days, the 31-90 days range is most frequent in Sa Pa (38.1%), reflecting common guest stay durations or potential owner blocking patterns.
- A notable 9.7% of properties secure long booking periods (181+ days booked per year), highlighting successful long-term rental strategies or significant owner usage.
Sa Pa Airbnb Minimum Stay Requirements Analysis
Distribution of Listings by Minimum Night Requirement
1 Night
249 listings
96.9% of total
4-6 Nights
1 listings
0.4% of total
30+ Nights
7 listings
2.7% of total
Key Insights
- The most prevalent minimum stay requirement in Sa Pa is 1 Night, adopted by 96.9% of listings. This highlights the market's preference for shorter, flexible bookings.
- A strong majority (96.9%) of the Sa Pa Airbnb data shows acceptance of very short stays (1-2 nights), indicating a dynamic, high-turnover market.
- Dedicated monthly rentals (30+ nights) represent a small niche (2.7%), possibly an untapped area for hosts.
Recommendations
- Align with the market by considering a 1 Night minimum stay, as 96.9% of Sa Pa hosts use this setting.
- Adjust minimum nights based on seasonality – potentially shorter during low season and longer during peak demand periods in Sa Pa.
Sa Pa Airbnb Cancellation Policy Trends Analysis (2026)
Flexible
126 listings
49.6% of total
Moderate
93 listings
36.6% of total
Firm
32 listings
12.6% of total
Strict
3 listings
1.2% of total
Cancellation Policy Insights for Sa Pa
- The prevailing Airbnb cancellation policy trend in Sa Pa is Flexible, used by 49.6% of listings.
- The market strongly favors guest-friendly terms, with 86.2% of listings offering Flexible or Moderate policies. This suggests guests in Sa Pa may expect booking flexibility.
- Strict cancellation policies are quite rare (1.2%), potentially making listings with this policy less competitive unless justified by high demand or property type.
Recommendations for Hosts
- Consider adopting a Flexible policy to align with the 49.6% market standard in Sa Pa.
- Using a Strict policy might deter some guests, as only 1.2% of listings use it. Evaluate if potential revenue protection outweighs possible lower booking rates.
- Regularly review your cancellation policy against competitors and market demand shifts in Sa Pa.
Sa Pa STR Booking Lead Time Analysis (2026)
Average Booking Lead Time by Month
Booking Lead Time Insights for Sa Pa
- The overall average booking lead time for vacation rentals in Sa Pa is 35 days.
- Guests book furthest in advance for stays during November (average 42 days), likely coinciding with peak travel demand or local events.
- The shortest booking windows occur for stays in July (average 24 days), indicating more last-minute travel plans during this time.
- Seasonally, Fall (40 days avg.) sees the longest lead times, while Spring (29 days avg.) has the shortest, reflecting typical travel planning cycles.
Recommendations for Hosts
- Use the overall average lead time (35 days) as a baseline for your pricing and availability strategy in Sa Pa.
- Target marketing efforts for the Fall season well in advance (at least 40 days) to capture early planners.
- Monitor your own booking lead times against these Sa Pa averages to identify opportunities for dynamic pricing adjustments.
Popular & Essential Airbnb Amenities in Sa Pa (2026)
Amenity Prevalence
Amenity Insights for Sa Pa
- Essential amenities in Sa Pa that guests expect include: Wifi. Lacking these (this) could significantly impact bookings.
- Popular amenities like Hair dryer, Free parking on premises, Fire extinguisher are common but not universal. Offering these can provide a competitive edge.
Recommendations for Hosts
- Ensure your listing includes all essential amenities for Sa Pa: Wifi.
- Prioritize adding missing essentials: Wifi.
- Consider adding popular differentiators like Hair dryer or Free parking on premises to increase appeal.
- Highlight unique or less common amenities you offer (e.g., hot tub, dedicated workspace, EV charger) in your listing description and photos.
- Regularly check competitor amenities in Sa Pa to stay competitive.
Sa Pa Airbnb Guest Demographics & Profile Analysis (2026)
Guest Profile Summary for Sa Pa
- The typical guest profile for Airbnb in Sa Pa consists of predominantly international visitors (99%), with top international origins including France, typically belonging to the Post-2000s (Gen Z/Alpha) group (50%), primarily speaking English or French.
- Domestic travelers account for 1.0% of guests.
- Key international markets include United States (12.5%) and France (8.7%).
- Top languages spoken are English (47.4%) followed by French (9.1%).
- A significant demographic segment is the Post-2000s (Gen Z/Alpha) group, representing 50% of guests.
Recommendations for Hosts
- Focus marketing internationally, particularly towards travelers from France.
- Tailor amenities and listing descriptions to appeal to the dominant Post-2000s (Gen Z/Alpha) demographic (e.g., highlight fast WiFi, smart home features, local guides).
- Highlight unique local experiences or amenities relevant to the primary guest profile.
- Consider seasonal promotions aligned with peak travel times for key origin markets.
Nearby Short-Term Rental Market Comparison
How does the Sa Pa Airbnb market stack up against its neighbors? Compare key performance metrics like average monthly revenue, ADR, and occupancy rates in surrounding areas to understand the broader regional STR landscape.
| Market | Active Properties | Monthly Revenue | Daily Rate | Avg. Occupancy |
|---|---|---|---|---|
| Xã Mường Hoa | 34 | $367 | $57.60 | 25% |
| Xã Hoàng Liên | 13 | $209 | $57.83 | 23% |
| Tả Van | 75 | $150 | $32.84 | 22% |
| Yên Bái | 11 | $137 | $27.89 | 22% |
| Hà Giang | 32 | $71 | $31.95 | 12% |