Williams Bay Airbnb Market Analysis 2026: Short Term Rental Data & Vacation Rental Statistics in Wisconsin, United States
Is Airbnb profitable in Williams Bay in 2026? Explore comprehensive Airbnb analytics for Williams Bay, Wisconsin, United States to uncover income potential. This 2026 STR market report for Williams Bay, based on AirROI data from February 2025 to January 2026, reveals key trends in the niche market of 53 active listings.
Whether you're considering an Airbnb investment in Williams Bay, optimizing your existing vacation rental, or exploring rental arbitrage opportunities, understanding the Williams Bay Airbnb data is crucial. Leveraging the low regulation environment is key to maximizing your short term rental income potential. Let's dive into the specifics.
Key Williams Bay Airbnb Performance Metrics Overview
Monthly Airbnb Revenue Variations & Income Potential in Williams Bay (2026)
Understanding the monthly revenue variations for Airbnb listings in Williams Bay is key to maximizing your short term rental income potential. Seasonality significantly impacts earnings. Our analysis, based on data from the past 12 months, shows that the peak revenue month for STRs in Williams Bay is typically July, while February often presents the lowest earnings, highlighting opportunities for strategic pricing adjustments during shoulder and low seasons. Explore the typical Airbnb income in Williams Bay across different performance tiers:
- Best-in-class properties (Top 10%) achieve $8,058+ monthly, often utilizing dynamic pricing and superior guest experiences.
- Strong performing properties (Top 25%) earn $5,917 or more, indicating effective management and desirable locations/amenities.
- Typical properties (Median) generate around $3,730 per month, representing the average market performance.
- Entry-level properties (Bottom 25%) see earnings around $1,994, often with potential for optimization.
Average Monthly Airbnb Earnings Trend in Williams Bay
Williams Bay Airbnb Occupancy Rate Trends (2026)
Maximize your bookings by understanding the Williams Bay STR occupancy trends. Seasonal demand shifts significantly influence how often properties are booked. Typically, Julysees the highest demand (peak season occupancy), while January experiences the lowest (low season). Effective strategies, like adjusting minimum stays or offering promotions, can boost occupancy during slower periods. Here's how different property tiers perform in Williams Bay:
- Best-in-class properties (Top 10%) achieve 62%+ occupancy, indicating high desirability and potentially optimized availability.
- Strong performing properties (Top 25%) maintain 50% or higher occupancy, suggesting good market fit and guest satisfaction.
- Typical properties (Median) have an occupancy rate around 33%.
- Entry-level properties (Bottom 25%) average 19% occupancy, potentially facing higher vacancy.
Average Monthly Occupancy Rate Trend in Williams Bay
Average Daily Rate (ADR) Airbnb Trends in Williams Bay (2026)
Effective short term rental pricing strategy in Williams Bay involves understanding monthly ADR fluctuations. The Average Daily Rate (ADR) for Airbnb in Williams Bay typically peaks in June and dips lowest during February. Leveraging Airbnb dynamic pricing tools or strategies based on this seasonality can significantly boost revenue. Here's a look at the typical nightly rates achieved:
- Best-in-class properties (Top 10%) command rates of $564+ per night, often due to premium features or locations.
- Strong performing properties (Top 25%) achieve nightly rates of $469 or more.
- Typical properties (Median) charge around $349 per night.
- Entry-level properties (Bottom 25%) earn around $249 per night.
Average Daily Rate (ADR) Trend by Month in Williams Bay
Get Live Williams Bay Market Intelligence 👇

Explore Real-time Analytics
Airbnb Seasonality Analysis & Trends in Williams Bay (2026)
Peak Season (July, August, June)
- Revenue averages $7,354 per month
- Occupancy rates average 54.2%
- Daily rates average $426
Shoulder Season
- Revenue averages $3,792 per month
- Occupancy maintains around 32.9%
- Daily rates hold near $374
Low Season (January, February, April)
- Revenue drops to average $2,170 per month
- Occupancy decreases to average 22.7%
- Daily rates adjust to average $339
Seasonality Insights for Williams Bay
- The Airbnb seasonality in Williams Bay shows highly seasonal trends requiring careful strategy. While the sections above show seasonal averages, it's also insightful to look at the extremes:
- During the high season, the absolute peak month showcases Williams Bay's highest earning potential, with monthly revenues capable of climbing to $8,866, occupancy reaching a high of 63.0%, and ADRs peaking at $427.
- Conversely, the slowest single month of the year, typically falling within the low season, marks the market's lowest point. In this month, revenue might dip to $1,805, occupancy could drop to 20.0%, and ADRs may adjust down to $322.
- Understanding both the seasonal averages and these monthly peaks and troughs in revenue, occupancy, and ADR is crucial for maximizing your Airbnb profit potential in Williams Bay.
Seasonal Strategies for Maximizing Profit
- Peak Season: Maximize revenue through premium pricing and potentially longer minimum stays. Ensure high availability.
- Low Season: Offer competitive pricing, special promotions (e.g., extended stay discounts), and flexible cancellation policies. Target off-season travelers like remote workers or budget-conscious guests.
- Shoulder Seasons: Implement dynamic pricing that balances peak and low rates. Target weekend travelers or specific events. Offer slightly more flexible terms than peak season.
- Regularly analyze your own performance against these Williams Bay seasonality benchmarks and adjust your pricing and availability strategy accordingly.
Best Areas for Airbnb Investment in Williams Bay (2026)
Exploring the top neighborhoods for short-term rentals in Williams Bay? This section highlights key areas, outlining why they are attractive for hosts and guests, along with notable local attractions. Consider these locations based on your target guest profile and investment strategy.
| Neighborhood / Area | Why Host Here? (Target Guests & Appeal) | Key Attractions & Landmarks |
|---|---|---|
| Lake Geneva | Popular tourist destination known for its beautiful lake, beaches, and luxury resorts. Ideal for vacation rentals, especially in summer. | Geneva Lake, The Geneva Lake Museum, Big Foot Beach State Park, Imagine Exhibitions Museum, Noble Horizons |
| Bristol Lake | A serene area for nature lovers and families seeking a peaceful retreat. Great for outdoor activities such as fishing and hiking. | Bristol Lake, Kettle Moraine State Forest, Nearby hiking trails, Bird watching spots |
| Fontana-on-Geneva Lake | A charming village with waterfront property and access to Geneva Lake. Popular among tourists for boating and lake activities. | Fontana Beach, Abbey Resort, Lake Geneva Boat Tours, Village Park |
| Williams Bay | A small, picturesque village offering a quaint atmosphere and proximity to artisan shops and nature trails, appealing to vacationers. | Yerkes Observatory, Williams Bay Beach, Kettle Moraine State Forest, Local wineries |
| East Troy | Offers a unique blend of history and outdoor activities. Great for families and those interested in local culture. | East Troy Electric Railroad, Alpine Valley Music Theatre, Local parks and trails |
| Delavan Lake | Known for its scenic beauty and recreational activities. A great investment for swim and boating enthusiasts. | Delavan Lake, White River County Park, Delavan Lake Festival, Fishing spots |
| Perkins Park | A neighborhood with family-friendly attractions, parks, and quiet streets, making it ideal for long-term rentals and families. | Local parks, Community events, Nearby nature trails |
| Lake Como | A hidden gem known for its peaceful atmosphere and outdoor activities, perfect for those looking to escape the hustle and bustle. | Lake Como Beach, Outdoor recreational areas, Hiking trails |
Understanding Airbnb License Requirements & STR Laws in Williams Bay (2026)
While Williams Bay, Wisconsin, United States currently shows low STR regulations, specific Airbnb license requirements might still exist or change. Always verify the latest short term rental regulations and Airbnb license requirements directly with local government authorities for Williams Bay to ensure full compliance before hosting.
(Source: AirROI data, 2026, finding no licensed listings among those analyzed)
Top Performing Airbnb Properties in Williams Bay (2026)
Benchmark your potential! Explore examples of top-performing Airbnb properties in Williams Baybased on Trailing Twelve Month (TTM) revenue. Analyze their characteristics, revenue, occupancy rate, and ADR to understand what drives success in this market.
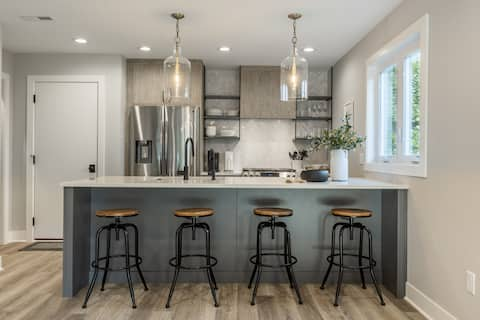
The perfect long weekend getaway! (Unit #1)
Entire Place • 3 bedrooms
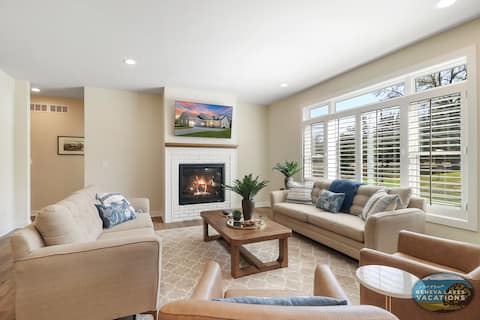
The Bay Constellation |Yerkes |Firepit |Pool Table
Entire Place • 5 bedrooms
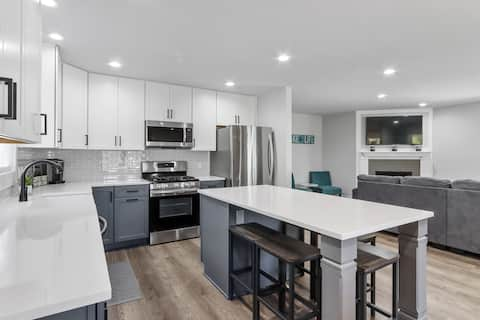
Cherry Street Retreat, 4BR 4BA Sleeps 14!
Entire Place • 4 bedrooms

Luxury Lake Geneva retreat (hot tub, Sauna) 2-Acre
Entire Place • 4 bedrooms

Bay Family Getaway (Hot tub/Theater)
Entire Place • 4 bedrooms

Cozy Home 5 min walk to lake w/ spacious yard
Entire Place • 4 bedrooms
Note: Performance varies based on location, size, amenities, seasonality, and management quality. Data reflects the past 12 months.
Top Performing Airbnb Hosts in Williams Bay (2026)
Learn from the best! This table showcases top-performing Airbnb hosts in Williams Bay based on the number of properties managed and estimated total revenue over the past year. Analyze their scale and performance metrics.
| Host Name | Properties | Grossing Revenue | Stay Reviews | Avg Rating |
|---|---|---|---|---|
| Maggie | 6 | $353,846 | 230 | 4.99/5.0 |
| Geneva Lakes Vacations | 7 | $331,991 | 86 | 4.80/5.0 |
| Tim And Bethany | 2 | $145,565 | 66 | 4.83/5.0 |
| Brian | 1 | $93,006 | 344 | 4.95/5.0 |
| Diya | 1 | $92,523 | 63 | 4.90/5.0 |
| Corie | 1 | $88,273 | 65 | 4.92/5.0 |
| Dean | 3 | $86,633 | 74 | 4.99/5.0 |
| Lacey And Ben | 1 | $78,277 | 78 | 4.83/5.0 |
| Holly | 1 | $59,792 | 358 | 4.87/5.0 |
| Jason | 1 | $54,825 | 68 | 5.00/5.0 |
Analyzing the strategies of top hosts, such as their property selection, pricing, and guest communication, can offer valuable lessons for optimizing your own Airbnb operations in Williams Bay.
Dive Deeper: Advanced Williams Bay STR Market Data (2026)
Ready to unlock more insights? AirROI provides access to advanced metrics and comprehensive Airbnb data for Williams Bay. Explore detailed analytics beyond this report to refine your investment strategy, optimize pricing, and maximize your vacation rental profits.
Explore Advanced MetricsWilliams Bay Short-Term Rental Market Composition (2026): Property & Room Types
Room Type Distribution
Property Type Distribution
Market Composition Insights for Williams Bay
- The Williams Bay Airbnb market composition is heavily skewed towards Entire Home/Apt listings, which make up 94.3% of the 53 active rentals. This indicates strong guest preference for privacy and space.
- Looking at the property type distribution in Williams Bay, House properties are the most common (83%), reflecting the local real estate landscape.
- Houses represent a significant 83% portion, catering likely to families or larger groups.
- Smaller segments like hotel/boutique, others (combined 3.8%) offer potential for unique stay experiences.
Williams Bay Airbnb Room Capacity Analysis (2026): Bedroom Distribution
Distribution of Listings by Number of Bedrooms
Room Capacity Insights for Williams Bay
- The dominant room capacity in Williams Bay is 3 bedrooms listings, making up 43.4% of the market. This suggests a strong demand for properties suitable for families or small groups.
- Together, 3 bedrooms and 2 bedrooms properties represent 69.8% of the active Airbnb listings in Williams Bay, indicating a high concentration in these sizes.
- A significant 66.1% of listings offer 3+ bedrooms, catering to larger groups and families seeking more space in Williams Bay.
Williams Bay Vacation Rental Guest Capacity Trends (2026)
Distribution of Listings by Guest Capacity
Guest Capacity Insights for Williams Bay
- The most common guest capacity trend in Williams Bay vacation rentals is listings accommodating 8+ guests (52.8%). This suggests the primary traveler segment is likely larger groups.
- Properties designed for 8+ guests and 6 guests dominate the Williams Bay STR market, accounting for 66.0% of listings.
- 77.3% of properties accommodate 6+ guests, serving the market segment for larger families or group travel in Williams Bay.
- On average, properties in Williams Bay are equipped to host 6.6 guests.
Williams Bay Airbnb Booking Patterns (2026): Available vs. Booked Days
Available Days Distribution
Booked Days Distribution
Booking Pattern Insights for Williams Bay
- The most common availability pattern in Williams Bay falls within the 181-270 days range, representing 49.1% of listings. This suggests many properties have significant open periods on their calendars.
- Approximately 94.4% of listings show high availability (181+ days open annually), indicating potential for increased bookings or specific owner usage patterns.
- For booked days, the 91-180 days range is most frequent in Williams Bay (50.9%), reflecting common guest stay durations or potential owner blocking patterns.
- A notable 5.7% of properties secure long booking periods (181+ days booked per year), highlighting successful long-term rental strategies or significant owner usage.
Williams Bay Airbnb Minimum Stay Requirements Analysis
Distribution of Listings by Minimum Night Requirement
1 Night
2 listings
3.8% of total
2 Nights
14 listings
26.4% of total
3 Nights
1 listings
1.9% of total
4-6 Nights
6 listings
11.3% of total
7-29 Nights
1 listings
1.9% of total
30+ Nights
29 listings
54.7% of total
Key Insights
- The most prevalent minimum stay requirement in Williams Bay is 30+ Nights, adopted by 54.7% of listings. This highlights the market's preference for longer commitments.
- A significant segment (54.7%) caters to monthly stays (30+ nights) in Williams Bay, pointing to opportunities in the extended-stay market.
Recommendations
- Align with the market by considering a 30+ Nights minimum stay, as 54.7% of Williams Bay hosts use this setting.
- If feasible, allowing 1-night stays, especially midweek or during low season, could capture last-minute bookings, as only 3.8% currently do.
- Explore offering discounts for stays of 30+ nights to attract the 54.7% of the market seeking extended stays.
- Adjust minimum nights based on seasonality – potentially shorter during low season and longer during peak demand periods in Williams Bay.
Williams Bay Airbnb Cancellation Policy Trends Analysis (2026)
Super Strict 60 Days
1 listings
1.9% of total
Super Strict 30 Days
2 listings
3.8% of total
Flexible
5 listings
9.4% of total
Moderate
10 listings
18.9% of total
Firm
31 listings
58.5% of total
Strict
4 listings
7.5% of total
Cancellation Policy Insights for Williams Bay
- The prevailing Airbnb cancellation policy trend in Williams Bay is Firm, used by 58.5% of listings.
- A majority (66.0%) of hosts in Williams Bay utilize Firm or Strict policies, indicating a market where hosts prioritize booking security.
- Strict cancellation policies are quite rare (7.5%), potentially making listings with this policy less competitive unless justified by high demand or property type.
Recommendations for Hosts
- Consider adopting a Firm policy to align with the 58.5% market standard in Williams Bay.
- Using a Strict policy might deter some guests, as only 7.5% of listings use it. Evaluate if potential revenue protection outweighs possible lower booking rates.
- Regularly review your cancellation policy against competitors and market demand shifts in Williams Bay.
Williams Bay STR Booking Lead Time Analysis (2026)
Average Booking Lead Time by Month
Booking Lead Time Insights for Williams Bay
- The overall average booking lead time for vacation rentals in Williams Bay is 61 days.
- Guests book furthest in advance for stays during July (average 109 days), likely coinciding with peak travel demand or local events.
- The shortest booking windows occur for stays in November (average 26 days), indicating more last-minute travel plans during this time.
- Seasonally, Summer (95 days avg.) sees the longest lead times, while Winter (32 days avg.) has the shortest, reflecting typical travel planning cycles.
Recommendations for Hosts
- Use the overall average lead time (61 days) as a baseline for your pricing and availability strategy in Williams Bay.
- For July stays, consider implementing length-of-stay discounts or slightly higher rates for bookings made less than 109 days out to capitalize on advance planning.
- Target marketing efforts for the Summer season well in advance (at least 95 days) to capture early planners.
- Monitor your own booking lead times against these Williams Bay averages to identify opportunities for dynamic pricing adjustments.
Popular & Essential Airbnb Amenities in Williams Bay (2026)
Amenity Prevalence
Amenity Insights for Williams Bay
- Essential amenities in Williams Bay that guests expect include: Carbon monoxide alarm, Free parking on premises, Heating, TV, Wifi, Coffee maker, Smoke alarm, Air conditioning. Lacking these (any) could significantly impact bookings.
- Popular amenities like Kitchen, Dishes and silverware are common but not universal. Offering these can provide a competitive edge.
Recommendations for Hosts
- Ensure your listing includes all essential amenities for Williams Bay: Carbon monoxide alarm, Free parking on premises, Heating, TV, Wifi, Coffee maker, Smoke alarm, Air conditioning.
- Prioritize adding missing essentials: Heating, TV, Wifi, Coffee maker, Smoke alarm, Air conditioning.
- Consider adding popular differentiators like Kitchen or Dishes and silverware to increase appeal.
- Highlight unique or less common amenities you offer (e.g., hot tub, dedicated workspace, EV charger) in your listing description and photos.
- Regularly check competitor amenities in Williams Bay to stay competitive.
Williams Bay Airbnb Guest Demographics & Profile Analysis (2026)
Guest Profile Summary for Williams Bay
- The typical guest profile for Airbnb in Williams Bay consists of primarily domestic travelers (98%), often arriving from nearby Chicago, typically belonging to the Post-2000s (Gen Z/Alpha) group (50%), primarily speaking English or Spanish.
- Domestic travelers account for 97.5% of guests.
- Key international markets include United States (97.5%) and Germany (0.7%).
- Top languages spoken are English (80.2%) followed by Spanish (11%).
- A significant demographic segment is the Post-2000s (Gen Z/Alpha) group, representing 50% of guests.
Recommendations for Hosts
- Target domestic marketing efforts towards travelers from Chicago and Naperville.
- Tailor amenities and listing descriptions to appeal to the dominant Post-2000s (Gen Z/Alpha) demographic (e.g., highlight fast WiFi, smart home features, local guides).
- Highlight unique local experiences or amenities relevant to the primary guest profile.
- Consider seasonal promotions aligned with peak travel times for key origin markets.
Nearby Short-Term Rental Market Comparison
How does the Williams Bay Airbnb market stack up against its neighbors? Compare key performance metrics like average monthly revenue, ADR, and occupancy rates in surrounding areas to understand the broader regional STR landscape.
| Market | Active Properties | Monthly Revenue | Daily Rate | Avg. Occupancy |
|---|---|---|---|---|
| Town of Sugar Creek | 18 | $9,830 | $662.90 | 53% |
| Monona | 29 | $6,957 | $648.65 | 49% |
| Twin Lakes | 35 | $6,152 | $547.55 | 43% |
| Lake Geneva | 209 | $5,014 | $473.36 | 41% |
| Town of Geneva | 63 | $5,012 | $448.89 | 43% |
| McHenry | 32 | $4,982 | $463.12 | 44% |
| Town of Marion | 47 | $4,817 | $364.51 | 43% |
| Town of Greenfield | 14 | $4,740 | $355.57 | 42% |
| City of Pewaukee | 11 | $4,657 | $510.14 | 44% |
| Salem Lakes | 23 | $4,513 | $330.45 | 49% |