Two Rivers Airbnb Market Analysis 2026: Short Term Rental Data & Vacation Rental Statistics in Wisconsin, United States
Is Airbnb profitable in Two Rivers in 2026? Explore comprehensive Airbnb analytics for Two Rivers, Wisconsin, United States to uncover income potential. This 2026 STR market report for Two Rivers, based on AirROI data from February 2025 to January 2026, reveals key trends in the niche market of 36 active listings.
Whether you're considering an Airbnb investment in Two Rivers, optimizing your existing vacation rental, or exploring rental arbitrage opportunities, understanding the Two Rivers Airbnb data is crucial. Leveraging the low regulation environment is key to maximizing your short term rental income potential. Let's dive into the specifics.
Key Two Rivers Airbnb Performance Metrics Overview
Monthly Airbnb Revenue Variations & Income Potential in Two Rivers (2026)
Understanding the monthly revenue variations for Airbnb listings in Two Rivers is key to maximizing your short term rental income potential. Seasonality significantly impacts earnings. Our analysis, based on data from the past 12 months, shows that the peak revenue month for STRs in Two Rivers is typically July, while February often presents the lowest earnings, highlighting opportunities for strategic pricing adjustments during shoulder and low seasons. Explore the typical Airbnb income in Two Rivers across different performance tiers:
- Best-in-class properties (Top 10%) achieve $6,010+ monthly, often utilizing dynamic pricing and superior guest experiences.
- Strong performing properties (Top 25%) earn $3,828 or more, indicating effective management and desirable locations/amenities.
- Typical properties (Median) generate around $2,388 per month, representing the average market performance.
- Entry-level properties (Bottom 25%) see earnings around $1,468, often with potential for optimization.
Average Monthly Airbnb Earnings Trend in Two Rivers
Two Rivers Airbnb Occupancy Rate Trends (2026)
Maximize your bookings by understanding the Two Rivers STR occupancy trends. Seasonal demand shifts significantly influence how often properties are booked. Typically, Julysees the highest demand (peak season occupancy), while January experiences the lowest (low season). Effective strategies, like adjusting minimum stays or offering promotions, can boost occupancy during slower periods. Here's how different property tiers perform in Two Rivers:
- Best-in-class properties (Top 10%) achieve 75%+ occupancy, indicating high desirability and potentially optimized availability.
- Strong performing properties (Top 25%) maintain 61% or higher occupancy, suggesting good market fit and guest satisfaction.
- Typical properties (Median) have an occupancy rate around 45%.
- Entry-level properties (Bottom 25%) average 26% occupancy, potentially facing higher vacancy.
Average Monthly Occupancy Rate Trend in Two Rivers
Average Daily Rate (ADR) Airbnb Trends in Two Rivers (2026)
Effective short term rental pricing strategy in Two Rivers involves understanding monthly ADR fluctuations. The Average Daily Rate (ADR) for Airbnb in Two Rivers typically peaks in April and dips lowest during February. Leveraging Airbnb dynamic pricing tools or strategies based on this seasonality can significantly boost revenue. Here's a look at the typical nightly rates achieved:
- Best-in-class properties (Top 10%) command rates of $383+ per night, often due to premium features or locations.
- Strong performing properties (Top 25%) achieve nightly rates of $262 or more.
- Typical properties (Median) charge around $173 per night.
- Entry-level properties (Bottom 25%) earn around $123 per night.
Average Daily Rate (ADR) Trend by Month in Two Rivers
Get Live Two Rivers Market Intelligence 👇

Explore Real-time Analytics
Airbnb Seasonality Analysis & Trends in Two Rivers (2026)
Peak Season (July, August, June)
- Revenue averages $5,009 per month
- Occupancy rates average 64.3%
- Daily rates average $223
Shoulder Season
- Revenue averages $2,961 per month
- Occupancy maintains around 43.8%
- Daily rates hold near $216
Low Season (January, February, December)
- Revenue drops to average $1,802 per month
- Occupancy decreases to average 26.8%
- Daily rates adjust to average $202
Seasonality Insights for Two Rivers
- The Airbnb seasonality in Two Rivers shows highly seasonal trends requiring careful strategy. While the sections above show seasonal averages, it's also insightful to look at the extremes:
- During the high season, the absolute peak month showcases Two Rivers's highest earning potential, with monthly revenues capable of climbing to $5,793, occupancy reaching a high of 72.6%, and ADRs peaking at $258.
- Conversely, the slowest single month of the year, typically falling within the low season, marks the market's lowest point. In this month, revenue might dip to $1,394, occupancy could drop to 23.4%, and ADRs may adjust down to $171.
- Understanding both the seasonal averages and these monthly peaks and troughs in revenue, occupancy, and ADR is crucial for maximizing your Airbnb profit potential in Two Rivers.
Seasonal Strategies for Maximizing Profit
- Peak Season: Maximize revenue through premium pricing and potentially longer minimum stays. Ensure high availability.
- Low Season: Offer competitive pricing, special promotions (e.g., extended stay discounts), and flexible cancellation policies. Target off-season travelers like remote workers or budget-conscious guests.
- Shoulder Seasons: Implement dynamic pricing that balances peak and low rates. Target weekend travelers or specific events. Offer slightly more flexible terms than peak season.
- Regularly analyze your own performance against these Two Rivers seasonality benchmarks and adjust your pricing and availability strategy accordingly.
Best Areas for Airbnb Investment in Two Rivers (2026)
Exploring the top neighborhoods for short-term rentals in Two Rivers? This section highlights key areas, outlining why they are attractive for hosts and guests, along with notable local attractions. Consider these locations based on your target guest profile and investment strategy.
| Neighborhood / Area | Why Host Here? (Target Guests & Appeal) | Key Attractions & Landmarks |
|---|---|---|
| Downtown Two Rivers | Charming and historic downtown area with local shops and restaurants. Attracts visitors interested in exploring the local culture and history of Two Rivers. | Point Beach State Forest, Two Rivers Historical Society, Neshotah Park, The Historic Thompson Blacksmith Shop, Lake Michigan shoreline |
| Two Rivers Beaches | Beautiful beach areas along Lake Michigan, perfect for summer vacations and family outings. Offers a relaxing atmosphere and recreational activities. | Neshotah Beach, East Twin River, Pioneer Park, Waterfront Trail, Fishing opportunities |
| Historic Main Street | Quaint street lined with shops, cafes, and historic buildings. Great for tourists who appreciate local history and arts. | Local art galleries, Café conversations, Annual events and fairs, Historic architecture, Community shops |
| Parks and Nature Areas | Surrounding nature parks and trails that appeal to outdoor enthusiasts and families. Great for those looking to enjoy nature and recreational activities. | Point Beach State Park, Riverside Park, Biking and hiking trails, Nature reserves, Wildlife watching |
| Lighthouse District | Unique area featuring the iconic Two Rivers lighthouse and waterfront views. Attractive for those interested in maritime history and scenic views. | Two Rivers Lighthouse, Mariner's Trail, Waterfront events, Fishing piers, Scenic views of Lake Michigan |
| Family-Friendly Locations | Areas catering to families with children, offering recreational facilities and activities. Popular for family vacations and gatherings. | Playground areas, Local family events, Splash pads, Community sports, Youth programs |
| Art and Culture District | Emerging area focused on local artists and cultural events. Draws in tourists and locals interested in the arts scene. | Art galleries, Local music events, Cultural festivals, Workshops, Performance spaces |
| Nearby Attractions | Access to nearby attractions such as museums and scenic destinations. Provides additional options for visitors looking to explore more. | Riverview Museum, Extended outdoor activities, Scenic drives, Nearby wineries, Local festivals |
Understanding Airbnb License Requirements & STR Laws in Two Rivers (2026)
While Two Rivers, Wisconsin, United States currently shows low STR regulations, specific Airbnb license requirements might still exist or change. Always verify the latest short term rental regulations and Airbnb license requirements directly with local government authorities for Two Rivers to ensure full compliance before hosting.
(Source: AirROI data, 2026, based on 3% licensed listings)
Top Performing Airbnb Properties in Two Rivers (2026)
Benchmark your potential! Explore examples of top-performing Airbnb properties in Two Riversbased on Trailing Twelve Month (TTM) revenue. Analyze their characteristics, revenue, occupancy rate, and ADR to understand what drives success in this market.
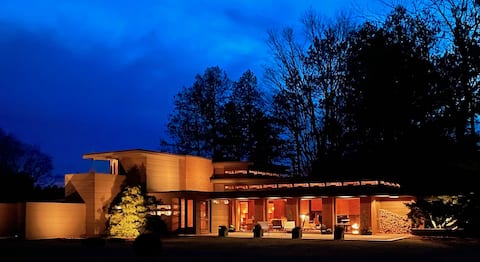
Still Bend/Frank Lloyd Wright's Schwartz House
Entire Place • 4 bedrooms

Cedar Soaking Hot Tub ~King BED ~No Cleaning Fee
Entire Place • 2 bedrooms
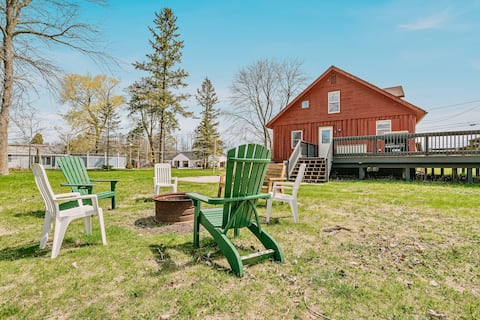
Smiling Bear Cabin | spacious retreat w/ lake view
Entire Place • 4 bedrooms

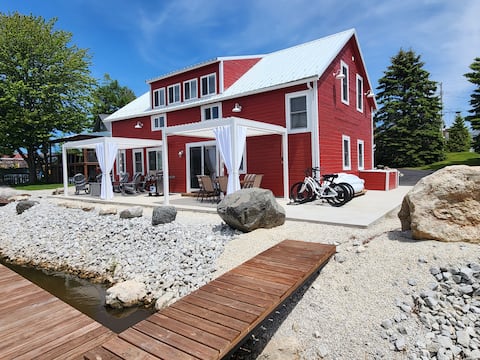
Riverfront Getaway
Entire Place • 5 bedrooms
Serene Riverfront Escape – Modern & Spacious
Entire Place • 4 bedrooms

Turn of the Century Craftsman Home
Entire Place • 3 bedrooms
Note: Performance varies based on location, size, amenities, seasonality, and management quality. Data reflects the past 12 months.
Top Performing Airbnb Hosts in Two Rivers (2026)
Learn from the best! This table showcases top-performing Airbnb hosts in Two Rivers based on the number of properties managed and estimated total revenue over the past year. Analyze their scale and performance metrics.
| Host Name | Properties | Grossing Revenue | Stay Reviews | Avg Rating |
|---|---|---|---|---|
| Michael | 1 | $171,588 | 378 | 4.94/5.0 |
| Rosalee | 3 | $158,608 | 529 | 4.93/5.0 |
| Annie & Joe | 8 | $144,237 | 1087 | 4.74/5.0 |
| Cherry A | 1 | $85,836 | 128 | 4.99/5.0 |
| Monika | 1 | $60,148 | 24 | 5.00/5.0 |
| Holli & Terry | 1 | $57,228 | 42 | 5.00/5.0 |
| Lora | 1 | $54,906 | 32 | 5.00/5.0 |
| Jeff | 1 | $41,905 | 71 | 4.96/5.0 |
| Amanda | 1 | $37,176 | 63 | 4.98/5.0 |
| Patrick J. | 1 | $36,722 | 308 | 4.95/5.0 |
Analyzing the strategies of top hosts, such as their property selection, pricing, and guest communication, can offer valuable lessons for optimizing your own Airbnb operations in Two Rivers.
Dive Deeper: Advanced Two Rivers STR Market Data (2026)
Ready to unlock more insights? AirROI provides access to advanced metrics and comprehensive Airbnb data for Two Rivers. Explore detailed analytics beyond this report to refine your investment strategy, optimize pricing, and maximize your vacation rental profits.
Explore Advanced MetricsTwo Rivers Short-Term Rental Market Composition (2026): Property & Room Types
Room Type Distribution
Property Type Distribution
Market Composition Insights for Two Rivers
- The Two Rivers Airbnb market composition is heavily skewed towards Entire Home/Apt listings, which make up 100% of the 36 active rentals. This indicates strong guest preference for privacy and space.
- Looking at the property type distribution in Two Rivers, House properties are the most common (88.9%), reflecting the local real estate landscape.
- Houses represent a significant 88.9% portion, catering likely to families or larger groups.
- Smaller segments like outdoor/unique (combined 2.8%) offer potential for unique stay experiences.
Two Rivers Airbnb Room Capacity Analysis (2026): Bedroom Distribution
Distribution of Listings by Number of Bedrooms
Room Capacity Insights for Two Rivers
- The dominant room capacity in Two Rivers is 3 bedrooms listings, making up 38.9% of the market. This suggests a strong demand for properties suitable for families or small groups.
- Together, 3 bedrooms and 2 bedrooms properties represent 69.5% of the active Airbnb listings in Two Rivers, indicating a high concentration in these sizes.
- A significant 58.4% of listings offer 3+ bedrooms, catering to larger groups and families seeking more space in Two Rivers.
Two Rivers Vacation Rental Guest Capacity Trends (2026)
Distribution of Listings by Guest Capacity
Guest Capacity Insights for Two Rivers
- The most common guest capacity trend in Two Rivers vacation rentals is listings accommodating 8+ guests (27.8%). This suggests the primary traveler segment is likely larger groups.
- Properties designed for 8+ guests and 6 guests dominate the Two Rivers STR market, accounting for 55.6% of listings.
- 61.2% of properties accommodate 6+ guests, serving the market segment for larger families or group travel in Two Rivers.
- On average, properties in Two Rivers are equipped to host 5.9 guests.
Two Rivers Airbnb Booking Patterns (2026): Available vs. Booked Days
Available Days Distribution
Booked Days Distribution
Booking Pattern Insights for Two Rivers
- The most common availability pattern in Two Rivers falls within the 181-270 days range, representing 47.2% of listings. This suggests many properties have significant open periods on their calendars.
- Approximately 69.4% of listings show high availability (181+ days open annually), indicating potential for increased bookings or specific owner usage patterns.
- For booked days, the 91-180 days range is most frequent in Two Rivers (47.2%), reflecting common guest stay durations or potential owner blocking patterns.
- A notable 33.4% of properties secure long booking periods (181+ days booked per year), highlighting successful long-term rental strategies or significant owner usage.
Two Rivers Airbnb Minimum Stay Requirements Analysis
Distribution of Listings by Minimum Night Requirement
1 Night
7 listings
19.4% of total
2 Nights
15 listings
41.7% of total
3 Nights
2 listings
5.6% of total
30+ Nights
12 listings
33.3% of total
Key Insights
- The most prevalent minimum stay requirement in Two Rivers is 2 Nights, adopted by 41.7% of listings. This highlights the market's preference for shorter, flexible bookings.
- A strong majority (61.1%) of the Two Rivers Airbnb data shows acceptance of very short stays (1-2 nights), indicating a dynamic, high-turnover market.
- A significant segment (33.3%) caters to monthly stays (30+ nights) in Two Rivers, pointing to opportunities in the extended-stay market.
Recommendations
- Align with the market by considering a 2 Nights minimum stay, as 41.7% of Two Rivers hosts use this setting.
- If feasible, allowing 1-night stays, especially midweek or during low season, could capture last-minute bookings, as only 19.4% currently do.
- A 2-night minimum appears standard (41.7%). Consider this for weekends or peak periods.
- Explore offering discounts for stays of 30+ nights to attract the 33.3% of the market seeking extended stays.
- Adjust minimum nights based on seasonality – potentially shorter during low season and longer during peak demand periods in Two Rivers.
Two Rivers Airbnb Cancellation Policy Trends Analysis (2026)
Flexible
8 listings
22.2% of total
Moderate
8 listings
22.2% of total
Firm
12 listings
33.3% of total
Strict
8 listings
22.2% of total
Cancellation Policy Insights for Two Rivers
- The prevailing Airbnb cancellation policy trend in Two Rivers is Firm, used by 33.3% of listings.
- A majority (55.5%) of hosts in Two Rivers utilize Firm or Strict policies, indicating a market where hosts prioritize booking security.
Recommendations for Hosts
- Consider adopting a Firm policy to align with the 33.3% market standard in Two Rivers.
- Regularly review your cancellation policy against competitors and market demand shifts in Two Rivers.
Two Rivers STR Booking Lead Time Analysis (2026)
Average Booking Lead Time by Month
Booking Lead Time Insights for Two Rivers
- The overall average booking lead time for vacation rentals in Two Rivers is 65 days.
- Guests book furthest in advance for stays during July (average 132 days), likely coinciding with peak travel demand or local events.
- The shortest booking windows occur for stays in January (average 20 days), indicating more last-minute travel plans during this time.
- Seasonally, Summer (111 days avg.) sees the longest lead times, while Winter (33 days avg.) has the shortest, reflecting typical travel planning cycles.
Recommendations for Hosts
- Use the overall average lead time (65 days) as a baseline for your pricing and availability strategy in Two Rivers.
- For July stays, consider implementing length-of-stay discounts or slightly higher rates for bookings made less than 132 days out to capitalize on advance planning.
- Target marketing efforts for the Summer season well in advance (at least 111 days) to capture early planners.
- Monitor your own booking lead times against these Two Rivers averages to identify opportunities for dynamic pricing adjustments.
Popular & Essential Airbnb Amenities in Two Rivers (2026)
Amenity Prevalence
No amenities with partial availability (less than 100%) were found to display in the chart. All essential amenities might be present in all listings. Check insights below.
Amenity Insights for Two Rivers
- Essential amenities in Two Rivers that guests expect include: Carbon monoxide alarm, Hot water, Coffee maker, Free parking on premises, Essentials, Refrigerator, Smoke alarm, TV, Heating, Dishes and silverware. Lacking these (any) could significantly impact bookings.
Recommendations for Hosts
- Ensure your listing includes all essential amenities for Two Rivers: Carbon monoxide alarm, Hot water, Coffee maker, Free parking on premises, Essentials, Refrigerator, Smoke alarm, TV, Heating, Dishes and silverware.
- Highlight unique or less common amenities you offer (e.g., hot tub, dedicated workspace, EV charger) in your listing description and photos.
- Regularly check competitor amenities in Two Rivers to stay competitive.
Two Rivers Airbnb Guest Demographics & Profile Analysis (2026)
Guest Profile Summary for Two Rivers
- The typical guest profile for Airbnb in Two Rivers consists of primarily domestic travelers (97%), often arriving from nearby Chicago, typically belonging to the Post-2000s (Gen Z/Alpha) group (50%), primarily speaking English or Spanish.
- Domestic travelers account for 97.3% of guests.
- Key international markets include United States (97.3%) and United Kingdom (0.8%).
- Top languages spoken are English (77.8%) followed by Spanish (11.4%).
- A significant demographic segment is the Post-2000s (Gen Z/Alpha) group, representing 50% of guests.
Recommendations for Hosts
- Target domestic marketing efforts towards travelers from Chicago and Madison.
- Tailor amenities and listing descriptions to appeal to the dominant Post-2000s (Gen Z/Alpha) demographic (e.g., highlight fast WiFi, smart home features, local guides).
- Highlight unique local experiences or amenities relevant to the primary guest profile.
- Consider seasonal promotions aligned with peak travel times for key origin markets.
Nearby Short-Term Rental Market Comparison
How does the Two Rivers Airbnb market stack up against its neighbors? Compare key performance metrics like average monthly revenue, ADR, and occupancy rates in surrounding areas to understand the broader regional STR landscape.
| Market | Active Properties | Monthly Revenue | Daily Rate | Avg. Occupancy |
|---|---|---|---|---|
| Town of Newton | 11 | $6,557 | $770.72 | 42% |
| Town of Wilson | 16 | $6,450 | $620.70 | 43% |
| Town of Jacksonport | 13 | $5,677 | $517.68 | 44% |
| Rowleys Bay | 19 | $5,182 | $416.60 | 48% |
| Suamico | 13 | $4,905 | $473.88 | 44% |
| Town of Nasewaupee | 34 | $4,843 | $412.94 | 46% |
| Town of Sturgeon Bay | 17 | $4,833 | $437.66 | 49% |
| Town of Liberty Grove | 55 | $4,774 | $402.24 | 50% |
| Sister Bay | 97 | $4,681 | $428.67 | 45% |
| City of Pewaukee | 11 | $4,657 | $510.14 | 44% |