Town of Linn Airbnb Market Analysis 2026: Short Term Rental Data & Vacation Rental Statistics in Wisconsin, United States
Is Airbnb profitable in Town of Linn in 2026? Explore comprehensive Airbnb analytics for Town of Linn, Wisconsin, United States to uncover income potential. This 2026 STR market report for Town of Linn, based on AirROI data from February 2025 to January 2026, reveals key trends in the niche market of 20 active listings.
Whether you're considering an Airbnb investment in Town of Linn, optimizing your existing vacation rental, or exploring rental arbitrage opportunities, understanding the Town of Linn Airbnb data is crucial. Leveraging the low regulation environment is key to maximizing your short term rental income potential. Let's dive into the specifics.
Key Town of Linn Airbnb Performance Metrics Overview
Monthly Airbnb Revenue Variations & Income Potential in Town of Linn (2026)
Understanding the monthly revenue variations for Airbnb listings in Town of Linn is key to maximizing your short term rental income potential. Seasonality significantly impacts earnings. Our analysis, based on data from the past 12 months, shows that the peak revenue month for STRs in Town of Linn is typically July, while January often presents the lowest earnings, highlighting opportunities for strategic pricing adjustments during shoulder and low seasons. Explore the typical Airbnb income in Town of Linn across different performance tiers:
- Best-in-class properties (Top 10%) achieve $8,963+ monthly, often utilizing dynamic pricing and superior guest experiences.
- Strong performing properties (Top 25%) earn $5,502 or more, indicating effective management and desirable locations/amenities.
- Typical properties (Median) generate around $3,691 per month, representing the average market performance.
- Entry-level properties (Bottom 25%) see earnings around $2,202, often with potential for optimization.
Average Monthly Airbnb Earnings Trend in Town of Linn
Town of Linn Airbnb Occupancy Rate Trends (2026)
Maximize your bookings by understanding the Town of Linn STR occupancy trends. Seasonal demand shifts significantly influence how often properties are booked. Typically, Julysees the highest demand (peak season occupancy), while January experiences the lowest (low season). Effective strategies, like adjusting minimum stays or offering promotions, can boost occupancy during slower periods. Here's how different property tiers perform in Town of Linn:
- Best-in-class properties (Top 10%) achieve 62%+ occupancy, indicating high desirability and potentially optimized availability.
- Strong performing properties (Top 25%) maintain 48% or higher occupancy, suggesting good market fit and guest satisfaction.
- Typical properties (Median) have an occupancy rate around 34%.
- Entry-level properties (Bottom 25%) average 25% occupancy, potentially facing higher vacancy.
Average Monthly Occupancy Rate Trend in Town of Linn
Average Daily Rate (ADR) Airbnb Trends in Town of Linn (2026)
Effective short term rental pricing strategy in Town of Linn involves understanding monthly ADR fluctuations. The Average Daily Rate (ADR) for Airbnb in Town of Linn typically peaks in June and dips lowest during March. Leveraging Airbnb dynamic pricing tools or strategies based on this seasonality can significantly boost revenue. Here's a look at the typical nightly rates achieved:
- Best-in-class properties (Top 10%) command rates of $671+ per night, often due to premium features or locations.
- Strong performing properties (Top 25%) achieve nightly rates of $472 or more.
- Typical properties (Median) charge around $329 per night.
- Entry-level properties (Bottom 25%) earn around $223 per night.
Average Daily Rate (ADR) Trend by Month in Town of Linn
Get Live Town of Linn Market Intelligence 👇

Explore Real-time Analytics
Airbnb Seasonality Analysis & Trends in Town of Linn (2026)
Peak Season (July, June, August)
- Revenue averages $8,687 per month
- Occupancy rates average 61.9%
- Daily rates average $414
Shoulder Season
- Revenue averages $3,381 per month
- Occupancy maintains around 30.8%
- Daily rates hold near $382
Low Season (January, February, April)
- Revenue drops to average $2,162 per month
- Occupancy decreases to average 26.3%
- Daily rates adjust to average $343
Seasonality Insights for Town of Linn
- The Airbnb seasonality in Town of Linn shows highly seasonal trends requiring careful strategy. While the sections above show seasonal averages, it's also insightful to look at the extremes:
- During the high season, the absolute peak month showcases Town of Linn's highest earning potential, with monthly revenues capable of climbing to $10,516, occupancy reaching a high of 70.4%, and ADRs peaking at $422.
- Conversely, the slowest single month of the year, typically falling within the low season, marks the market's lowest point. In this month, revenue might dip to $1,722, occupancy could drop to 19.1%, and ADRs may adjust down to $325.
- Understanding both the seasonal averages and these monthly peaks and troughs in revenue, occupancy, and ADR is crucial for maximizing your Airbnb profit potential in Town of Linn.
Seasonal Strategies for Maximizing Profit
- Peak Season: Maximize revenue through premium pricing and potentially longer minimum stays. Ensure high availability.
- Low Season: Offer competitive pricing, special promotions (e.g., extended stay discounts), and flexible cancellation policies. Target off-season travelers like remote workers or budget-conscious guests.
- Shoulder Seasons: Implement dynamic pricing that balances peak and low rates. Target weekend travelers or specific events. Offer slightly more flexible terms than peak season.
- Regularly analyze your own performance against these Town of Linn seasonality benchmarks and adjust your pricing and availability strategy accordingly.
Best Areas for Airbnb Investment in Town of Linn (2026)
Exploring the top neighborhoods for short-term rentals in Town of Linn? This section highlights key areas, outlining why they are attractive for hosts and guests, along with notable local attractions. Consider these locations based on your target guest profile and investment strategy.
| Neighborhood / Area | Why Host Here? (Target Guests & Appeal) | Key Attractions & Landmarks |
|---|---|---|
| Lake Geneva | A popular resort town known for its beautiful lake, outdoor activities, and charming downtown area. Attracts visitors year-round for water sports, dining, and shopping. | Geneva Lake, Yerkes Observatory, Riviera Beach, Lake Geneva Canopy Tours, Downtown Lake Geneva |
| Skiing at Alpine Valley | A destination for winter sports enthusiasts, Alpine Valley offers skiing, snowboarding, and tubing. Attracts winter visitors looking for snow-related activities and cozy accommodations. | Alpine Valley Resort, Winter sports trails, Local restaurants and lodges |
| Kettle Moraine State Forest | A natural area ideal for outdoor activities such as hiking, camping, and wildlife watching, attracting nature lovers and adventure seekers. | Kettle Moraine trails, Camping sites, Wildflowers and wildlife viewing |
| Williams Bay | Set on the shores of Geneva Lake, Williams Bay offers a charming small-town feel with access to lake activities and nearby resorts, appealing to families and couples. | Fontana Beach, Williams Bay Public Library, Local dining options |
| Fontana-on-Geneva Lake | A quaint village known for its lakeside parks, beaches, and access to boating and fishing, making it a great spot for summer getaways. | Fontana Beach, Harold's Restaurant and Ice Cream, Boating and fishing docks |
| Delavan Lake | A scenic lake community known for summer vacations and water activities, attracting families and groups looking for relaxation and fun. | Delavan Lake, Local parks, Water sports rentals |
| East Troy | A small town with attractions like the East Troy Electric Railroad and nearby natural spots, appealing to visitors looking for quaint experiences and local charm. | East Troy Electric Railroad, Kettle Moraine State Forest, Local dining and shops |
| Palmyra | A quiet and historic village with access to outdoor activities and a peaceful atmosphere, ideal for travelers seeking a getaway from city life. | Palmyra Lake, Historic sites, Local festivals |
Understanding Airbnb License Requirements & STR Laws in Town of Linn (2026)
While Town of Linn, Wisconsin, United States currently shows low STR regulations, specific Airbnb license requirements might still exist or change. Always verify the latest short term rental regulations and Airbnb license requirements directly with local government authorities for Town of Linn to ensure full compliance before hosting.
(Source: AirROI data, 2026, finding no licensed listings among those analyzed)
Top Performing Airbnb Properties in Town of Linn (2026)
Benchmark your potential! Explore examples of top-performing Airbnb properties in Town of Linnbased on Trailing Twelve Month (TTM) revenue. Analyze their characteristics, revenue, occupancy rate, and ADR to understand what drives success in this market.
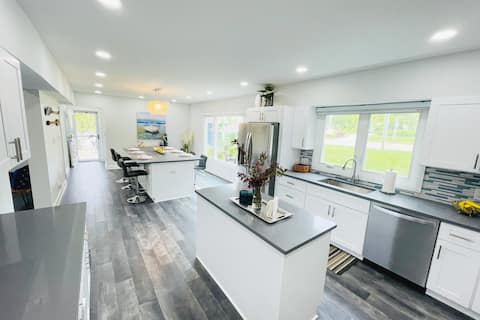
Beautiful lake house with views of Geneva Lake
Entire Place • 4 bedrooms

Lake Geneva Home w/ Pool near the Lake!
Entire Place • 3 bedrooms

4 Acres Retreat At Lake Geneva
Entire Place • 3 bedrooms
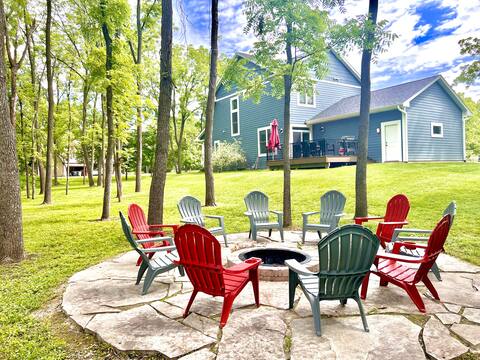
Black Point House, Fire Pit, Deck, 10 mins to LG
Entire Place • 4 bedrooms
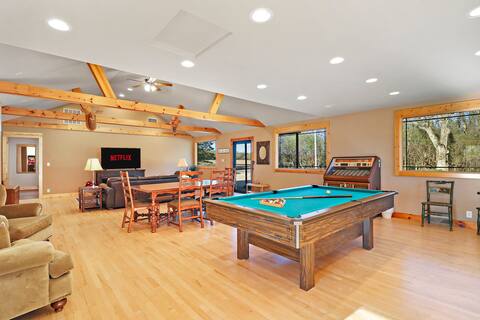
Beautiful 3 Bed .5 Mile from Lake
Entire Place • 3 bedrooms

The Peacock Cottage
Entire Place • 4 bedrooms
Note: Performance varies based on location, size, amenities, seasonality, and management quality. Data reflects the past 12 months.
Top Performing Airbnb Hosts in Town of Linn (2026)
Learn from the best! This table showcases top-performing Airbnb hosts in Town of Linn based on the number of properties managed and estimated total revenue over the past year. Analyze their scale and performance metrics.
| Host Name | Properties | Grossing Revenue | Stay Reviews | Avg Rating |
|---|---|---|---|---|
| Helen | 1 | $92,755 | 19 | 4.89/5.0 |
| Marissa | 1 | $86,801 | 21 | 5.00/5.0 |
| Sudi | 1 | $86,572 | 67 | 4.96/5.0 |
| Elite | 1 | $70,904 | 20 | 4.95/5.0 |
| Sarah | 1 | $55,728 | 59 | 4.88/5.0 |
| Benjamin | 1 | $52,956 | 109 | 4.92/5.0 |
| Gene | 1 | $50,646 | 22 | 5.00/5.0 |
| Bernice | 1 | $48,999 | 37 | 4.92/5.0 |
| Glenn | 1 | $47,570 | 102 | 4.92/5.0 |
| Jordan | 1 | $41,113 | 13 | 4.92/5.0 |
Analyzing the strategies of top hosts, such as their property selection, pricing, and guest communication, can offer valuable lessons for optimizing your own Airbnb operations in Town of Linn.
Dive Deeper: Advanced Town of Linn STR Market Data (2026)
Ready to unlock more insights? AirROI provides access to advanced metrics and comprehensive Airbnb data for Town of Linn. Explore detailed analytics beyond this report to refine your investment strategy, optimize pricing, and maximize your vacation rental profits.
Explore Advanced MetricsTown of Linn Short-Term Rental Market Composition (2026): Property & Room Types
Room Type Distribution
Property Type Distribution
Market Composition Insights for Town of Linn
- The Town of Linn Airbnb market composition is heavily skewed towards Entire Home/Apt listings, which make up 100% of the 20 active rentals. This indicates strong guest preference for privacy and space.
- Looking at the property type distribution in Town of Linn, House properties are the most common (85%), reflecting the local real estate landscape.
- Houses represent a significant 85% portion, catering likely to families or larger groups.
Town of Linn Airbnb Room Capacity Analysis (2026): Bedroom Distribution
Distribution of Listings by Number of Bedrooms
Room Capacity Insights for Town of Linn
- The dominant room capacity in Town of Linn is 4 bedrooms listings, making up 40% of the market. This suggests a strong demand for properties suitable for families or small groups.
- Together, 4 bedrooms and 3 bedrooms properties represent 80.0% of the active Airbnb listings in Town of Linn, indicating a high concentration in these sizes.
- A significant 80.0% of listings offer 3+ bedrooms, catering to larger groups and families seeking more space in Town of Linn.
Town of Linn Vacation Rental Guest Capacity Trends (2026)
Distribution of Listings by Guest Capacity
Guest Capacity Insights for Town of Linn
- The most common guest capacity trend in Town of Linn vacation rentals is listings accommodating 8+ guests (60%). This suggests the primary traveler segment is likely larger groups.
- Properties designed for 8+ guests and 6 guests dominate the Town of Linn STR market, accounting for 90.0% of listings.
- 90.0% of properties accommodate 6+ guests, serving the market segment for larger families or group travel in Town of Linn.
- On average, properties in Town of Linn are equipped to host 6.9 guests.
Town of Linn Airbnb Booking Patterns (2026): Available vs. Booked Days
Available Days Distribution
Booked Days Distribution
Booking Pattern Insights for Town of Linn
- The most common availability pattern in Town of Linn falls within the 181-270 days range, representing 60% of listings. This suggests many properties have significant open periods on their calendars.
- Approximately 95.0% of listings show high availability (181+ days open annually), indicating potential for increased bookings or specific owner usage patterns.
- For booked days, the 91-180 days range is most frequent in Town of Linn (60%), reflecting common guest stay durations or potential owner blocking patterns.
- A notable 5.0% of properties secure long booking periods (181+ days booked per year), highlighting successful long-term rental strategies or significant owner usage.
Town of Linn Airbnb Minimum Stay Requirements Analysis
Distribution of Listings by Minimum Night Requirement
1 Night
1 listings
5% of total
2 Nights
9 listings
45% of total
4-6 Nights
2 listings
10% of total
30+ Nights
8 listings
40% of total
Key Insights
- The most prevalent minimum stay requirement in Town of Linn is 2 Nights, adopted by 45% of listings. This highlights the market's preference for shorter, flexible bookings.
- A significant segment (40%) caters to monthly stays (30+ nights) in Town of Linn, pointing to opportunities in the extended-stay market.
Recommendations
- Align with the market by considering a 2 Nights minimum stay, as 45% of Town of Linn hosts use this setting.
- If feasible, allowing 1-night stays, especially midweek or during low season, could capture last-minute bookings, as only 5% currently do.
- A 2-night minimum appears standard (45%). Consider this for weekends or peak periods.
- Explore offering discounts for stays of 30+ nights to attract the 40% of the market seeking extended stays.
- Adjust minimum nights based on seasonality – potentially shorter during low season and longer during peak demand periods in Town of Linn.
Town of Linn Airbnb Cancellation Policy Trends Analysis (2026)
Super Strict 60 Days
1 listings
5% of total
Flexible
4 listings
20% of total
Moderate
5 listings
25% of total
Firm
9 listings
45% of total
Strict
1 listings
5% of total
Cancellation Policy Insights for Town of Linn
- The prevailing Airbnb cancellation policy trend in Town of Linn is Firm, used by 45% of listings.
- There's a relatively balanced mix between guest-friendly (45.0%) and stricter (50.0%) policies, offering choices for different guest needs.
- Strict cancellation policies are quite rare (5%), potentially making listings with this policy less competitive unless justified by high demand or property type.
Recommendations for Hosts
- Consider adopting a Firm policy to align with the 45% market standard in Town of Linn.
- Using a Strict policy might deter some guests, as only 5% of listings use it. Evaluate if potential revenue protection outweighs possible lower booking rates.
- Regularly review your cancellation policy against competitors and market demand shifts in Town of Linn.
Town of Linn STR Booking Lead Time Analysis (2026)
Average Booking Lead Time by Month
Booking Lead Time Insights for Town of Linn
- The overall average booking lead time for vacation rentals in Town of Linn is 63 days.
- Guests book furthest in advance for stays during July (average 124 days), likely coinciding with peak travel demand or local events.
- The shortest booking windows occur for stays in February (average 15 days), indicating more last-minute travel plans during this time.
- Seasonally, Summer (103 days avg.) sees the longest lead times, while Winter (42 days avg.) has the shortest, reflecting typical travel planning cycles.
Recommendations for Hosts
- Use the overall average lead time (63 days) as a baseline for your pricing and availability strategy in Town of Linn.
- For July stays, consider implementing length-of-stay discounts or slightly higher rates for bookings made less than 124 days out to capitalize on advance planning.
- Target marketing efforts for the Summer season well in advance (at least 103 days) to capture early planners.
- Monitor your own booking lead times against these Town of Linn averages to identify opportunities for dynamic pricing adjustments.
Popular & Essential Airbnb Amenities in Town of Linn (2026)
Amenity Prevalence
No amenities with partial availability (less than 100%) were found to display in the chart. All essential amenities might be present in all listings. Check insights below.
Amenity Insights for Town of Linn
- Essential amenities in Town of Linn that guests expect include: Refrigerator, Wifi, Smoke alarm, Fire extinguisher, Hot water, Kitchen, Heating, Carbon monoxide alarm, Coffee maker, Free parking on premises. Lacking these (any) could significantly impact bookings.
Recommendations for Hosts
- Ensure your listing includes all essential amenities for Town of Linn: Refrigerator, Wifi, Smoke alarm, Fire extinguisher, Hot water, Kitchen, Heating, Carbon monoxide alarm, Coffee maker, Free parking on premises.
- Highlight unique or less common amenities you offer (e.g., hot tub, dedicated workspace, EV charger) in your listing description and photos.
- Regularly check competitor amenities in Town of Linn to stay competitive.
Town of Linn Airbnb Guest Demographics & Profile Analysis (2026)
Guest Profile Summary for Town of Linn
- The typical guest profile for Airbnb in Town of Linn consists of primarily domestic travelers (98%), often arriving from nearby Chicago, typically belonging to the Post-2000s (Gen Z/Alpha) group (50%), primarily speaking English or Spanish.
- Domestic travelers account for 98.4% of guests.
- Key international markets include United States (98.4%) and DC (0.8%).
- Top languages spoken are English (76.2%) followed by Spanish (16.7%).
- A significant demographic segment is the Post-2000s (Gen Z/Alpha) group, representing 50% of guests.
Recommendations for Hosts
- Target domestic marketing efforts towards travelers from Chicago and Milwaukee.
- Tailor amenities and listing descriptions to appeal to the dominant Post-2000s (Gen Z/Alpha) demographic (e.g., highlight fast WiFi, smart home features, local guides).
- Highlight unique local experiences or amenities relevant to the primary guest profile.
- Consider seasonal promotions aligned with peak travel times for key origin markets.
Nearby Short-Term Rental Market Comparison
How does the Town of Linn Airbnb market stack up against its neighbors? Compare key performance metrics like average monthly revenue, ADR, and occupancy rates in surrounding areas to understand the broader regional STR landscape.
| Market | Active Properties | Monthly Revenue | Daily Rate | Avg. Occupancy |
|---|---|---|---|---|
| Town of Sugar Creek | 18 | $9,830 | $662.90 | 53% |
| Monona | 29 | $6,957 | $648.65 | 49% |
| Twin Lakes | 35 | $6,152 | $547.54 | 43% |
| Lake Geneva | 209 | $5,014 | $473.36 | 41% |
| Town of Geneva | 63 | $5,012 | $448.89 | 43% |
| McHenry | 32 | $4,982 | $463.12 | 44% |
| Town of Marion | 47 | $4,817 | $364.51 | 43% |
| Town of Greenfield | 14 | $4,740 | $355.57 | 42% |
| City of Pewaukee | 11 | $4,657 | $510.14 | 44% |
| Salem Lakes | 23 | $4,513 | $330.45 | 49% |