Town of Lake Airbnb Market Analysis 2026: Short Term Rental Data & Vacation Rental Statistics in Wisconsin, United States
Is Airbnb profitable in Town of Lake in 2026? Explore comprehensive Airbnb analytics for Town of Lake, Wisconsin, United States to uncover income potential. This 2026 STR market report for Town of Lake, based on AirROI data from February 2025 to January 2026, reveals key trends in the niche market of 20 active listings.
Whether you're considering an Airbnb investment in Town of Lake, optimizing your existing vacation rental, or exploring rental arbitrage opportunities, understanding the Town of Lake Airbnb data is crucial. Leveraging the low regulation environment is key to maximizing your short term rental income potential. Let's dive into the specifics.
Key Town of Lake Airbnb Performance Metrics Overview
Monthly Airbnb Revenue Variations & Income Potential in Town of Lake (2026)
Understanding the monthly revenue variations for Airbnb listings in Town of Lake is key to maximizing your short term rental income potential. Seasonality significantly impacts earnings. Our analysis, based on data from the past 12 months, shows that the peak revenue month for STRs in Town of Lake is typically August, while January often presents the lowest earnings, highlighting opportunities for strategic pricing adjustments during shoulder and low seasons. Explore the typical Airbnb income in Town of Lake across different performance tiers:
- Best-in-class properties (Top 10%) achieve $4,375+ monthly, often utilizing dynamic pricing and superior guest experiences.
- Strong performing properties (Top 25%) earn $3,145 or more, indicating effective management and desirable locations/amenities.
- Typical properties (Median) generate around $1,967 per month, representing the average market performance.
- Entry-level properties (Bottom 25%) see earnings around $874, often with potential for optimization.
Average Monthly Airbnb Earnings Trend in Town of Lake
Town of Lake Airbnb Occupancy Rate Trends (2026)
Maximize your bookings by understanding the Town of Lake STR occupancy trends. Seasonal demand shifts significantly influence how often properties are booked. Typically, Julysees the highest demand (peak season occupancy), while January experiences the lowest (low season). Effective strategies, like adjusting minimum stays or offering promotions, can boost occupancy during slower periods. Here's how different property tiers perform in Town of Lake:
- Best-in-class properties (Top 10%) achieve 63%+ occupancy, indicating high desirability and potentially optimized availability.
- Strong performing properties (Top 25%) maintain 44% or higher occupancy, suggesting good market fit and guest satisfaction.
- Typical properties (Median) have an occupancy rate around 26%.
- Entry-level properties (Bottom 25%) average 13% occupancy, potentially facing higher vacancy.
Average Monthly Occupancy Rate Trend in Town of Lake
Average Daily Rate (ADR) Airbnb Trends in Town of Lake (2026)
Effective short term rental pricing strategy in Town of Lake involves understanding monthly ADR fluctuations. The Average Daily Rate (ADR) for Airbnb in Town of Lake typically peaks in October and dips lowest during March. Leveraging Airbnb dynamic pricing tools or strategies based on this seasonality can significantly boost revenue. Here's a look at the typical nightly rates achieved:
- Best-in-class properties (Top 10%) command rates of $280+ per night, often due to premium features or locations.
- Strong performing properties (Top 25%) achieve nightly rates of $251 or more.
- Typical properties (Median) charge around $219 per night.
- Entry-level properties (Bottom 25%) earn around $184 per night.
Average Daily Rate (ADR) Trend by Month in Town of Lake
Get Live Town of Lake Market Intelligence 👇

Explore Real-time Analytics
Airbnb Seasonality Analysis & Trends in Town of Lake (2026)
Peak Season (August, July, October)
- Revenue averages $3,775 per month
- Occupancy rates average 47.1%
- Daily rates average $242
Shoulder Season
- Revenue averages $2,067 per month
- Occupancy maintains around 29.3%
- Daily rates hold near $233
Low Season (January, February, March)
- Revenue drops to average $1,095 per month
- Occupancy decreases to average 17.6%
- Daily rates adjust to average $219
Seasonality Insights for Town of Lake
- The Airbnb seasonality in Town of Lake shows highly seasonal trends requiring careful strategy. While the sections above show seasonal averages, it's also insightful to look at the extremes:
- During the high season, the absolute peak month showcases Town of Lake's highest earning potential, with monthly revenues capable of climbing to $4,005, occupancy reaching a high of 54.8%, and ADRs peaking at $249.
- Conversely, the slowest single month of the year, typically falling within the low season, marks the market's lowest point. In this month, revenue might dip to $977, occupancy could drop to 13.3%, and ADRs may adjust down to $206.
- Understanding both the seasonal averages and these monthly peaks and troughs in revenue, occupancy, and ADR is crucial for maximizing your Airbnb profit potential in Town of Lake.
Seasonal Strategies for Maximizing Profit
- Peak Season: Maximize revenue through premium pricing and potentially longer minimum stays. Ensure high availability.
- Low Season: Offer competitive pricing, special promotions (e.g., extended stay discounts), and flexible cancellation policies. Target off-season travelers like remote workers or budget-conscious guests.
- Shoulder Seasons: Implement dynamic pricing that balances peak and low rates. Target weekend travelers or specific events. Offer slightly more flexible terms than peak season.
- Regularly analyze your own performance against these Town of Lake seasonality benchmarks and adjust your pricing and availability strategy accordingly.
Best Areas for Airbnb Investment in Town of Lake (2026)
Exploring the top neighborhoods for short-term rentals in Town of Lake? This section highlights key areas, outlining why they are attractive for hosts and guests, along with notable local attractions. Consider these locations based on your target guest profile and investment strategy.
| Neighborhood / Area | Why Host Here? (Target Guests & Appeal) | Key Attractions & Landmarks |
|---|---|---|
| Lake Geneva | Popular vacation destination known for its beautiful lake and outdoor activities. It's a hub for tourists looking for recreation and relaxation, making it ideal for Airbnb hosting. | Lake Geneva Cruise Line, Geneva Lake Museum, Big Foot Beach State Park, Chateau Royale, Harrison's Hometown, Lake Geneva Balloon Company |
| Narrative Heights | This growing area features beautiful houses and is close to outdoor recreation spots, making it appealing for families and groups. The serene environment attracts those looking to escape city life. | Big Foot Beach State Park, Lake Como, Kettle Moraine State Forest, Virmond Park, Geneva National Golf Club, Honey Lake |
| Delavan Lake | People are drawn to this picturesque lake community for its recreational activities and family-friendly atmosphere. It's great for summer vacations and weekend getaways. | Delavan Lake, Lakeside Park, The Dancing Horses Theatre, Delavan Historical Society, Delavan Lake Golf Club, The Village of Delavan |
| Williams Bay | Tiny, charming village on the shores of Lake Geneva, perfect for summer getaways. Offers a quieter, quaint atmosphere with easy access to water activities. | Yerkes Observatory, Williams Bay Village Park, Geneva Lake, Kettle Moraine State Forest, Lakeside Park, Harold G. Smith museum |
| Elkhorn | A larger town that serves as a gateway to the nearby lakes and outdoor recreation. Attracts tourists looking for a base to explore the scenic Wisconsin countryside. | Elkhorn Antique Flea Market, Geneva Lake, Old World Wisconsin, Elkhorn Area Historical Society, Lauderdale Lakes, Kettle Moraine State Forest |
| Fontana | Known for its beach and family-friendly activities, this area is great for summer visitors who enjoy outdoor events, water sports, and relaxation. | Fontana Beach, Fontana Village Hall & Garden, Lake Geneva, Parkside Inn, Fontana Park, The Abbey Resort |
| Powers Lake | A residential area that’s popular during the summer for its lake activities. It’s a great spot for families looking for lakefront accommodations. | Powers Lake, Kustom Kulture, Park memberships for boating, Local parks and fishing spots, Racine County Fairgrounds, Local dining and shopping |
| Aspen Hills | A calm and beautiful area, attracting those who love nature and tranquility, ideal for Airbnb to host guests looking for serenity and scenic views. | Aspen Hills Meadow, Tranquil nature trails, Wildlife watching, Cross-country skiing, Fishing spots nearby, Community events and gatherings |
Understanding Airbnb License Requirements & STR Laws in Town of Lake (2026)
While Town of Lake, Wisconsin, United States currently shows low STR regulations, specific Airbnb license requirements might still exist or change. Always verify the latest short term rental regulations and Airbnb license requirements directly with local government authorities for Town of Lake to ensure full compliance before hosting.
(Source: AirROI data, 2026, finding no licensed listings among those analyzed)
Top Performing Airbnb Properties in Town of Lake (2026)
Benchmark your potential! Explore examples of top-performing Airbnb properties in Town of Lakebased on Trailing Twelve Month (TTM) revenue. Analyze their characteristics, revenue, occupancy rate, and ADR to understand what drives success in this market.
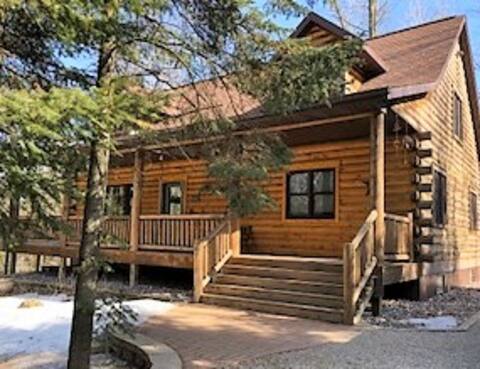
Large Crivitz Log House
Entire Place • 4 bedrooms

River's Edge Tiny Home | Expansive Deck
Entire Place • 1 bedroom
The Cottage on Schnur Lake
Entire Place • 3 bedrooms

Hidden Bay: Modern. Wild. Clean. Sunset Views.
Entire Place • 2 bedrooms
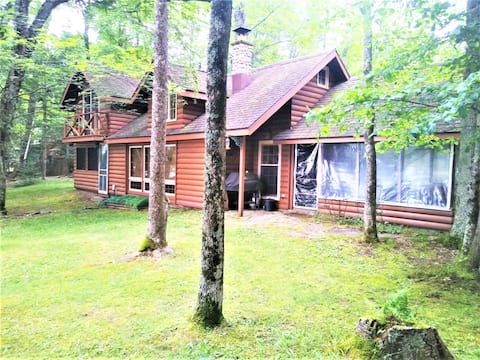
Butternut Lake Hideaway
Entire Place • 3 bedrooms

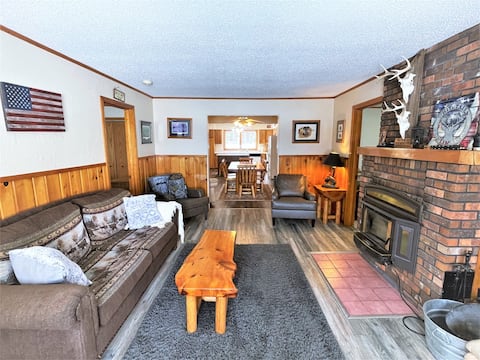
Lake Noquebay Home
Entire Place • 4 bedrooms
Note: Performance varies based on location, size, amenities, seasonality, and management quality. Data reflects the past 12 months.
Top Performing Airbnb Hosts in Town of Lake (2026)
Learn from the best! This table showcases top-performing Airbnb hosts in Town of Lake based on the number of properties managed and estimated total revenue over the past year. Analyze their scale and performance metrics.
| Host Name | Properties | Grossing Revenue | Stay Reviews | Avg Rating |
|---|---|---|---|---|
| Up North Vacation Lodging | 10 | $144,395 | 142 | 4.67/5.0 |
| Jeff & Sally | 1 | $37,327 | 72 | 4.99/5.0 |
| Tina | 1 | $35,263 | 23 | 4.78/5.0 |
| Samantha | 1 | $32,292 | 54 | 4.98/5.0 |
| Matthew Emil | 1 | $23,679 | 23 | 4.96/5.0 |
| Amanda | 3 | $21,913 | 15 | 5.00/5.0 |
| Melissa | 1 | $20,838 | 55 | 5.00/5.0 |
| Peter James | 1 | $7,047 | 14 | 4.86/5.0 |
| Peter | 1 | $2,294 | 3 | 5.00/5.0 |
Analyzing the strategies of top hosts, such as their property selection, pricing, and guest communication, can offer valuable lessons for optimizing your own Airbnb operations in Town of Lake.
Dive Deeper: Advanced Town of Lake STR Market Data (2026)
Ready to unlock more insights? AirROI provides access to advanced metrics and comprehensive Airbnb data for Town of Lake. Explore detailed analytics beyond this report to refine your investment strategy, optimize pricing, and maximize your vacation rental profits.
Explore Advanced MetricsTown of Lake Short-Term Rental Market Composition (2026): Property & Room Types
Room Type Distribution
Property Type Distribution
Market Composition Insights for Town of Lake
- The Town of Lake Airbnb market composition is heavily skewed towards Entire Home/Apt listings, which make up 100% of the 20 active rentals. This indicates strong guest preference for privacy and space.
- Looking at the property type distribution in Town of Lake, House properties are the most common (55%), reflecting the local real estate landscape.
- Houses represent a significant 55% portion, catering likely to families or larger groups.
Town of Lake Airbnb Room Capacity Analysis (2026): Bedroom Distribution
Distribution of Listings by Number of Bedrooms
Room Capacity Insights for Town of Lake
- The dominant room capacity in Town of Lake is 2 bedrooms listings, making up 45% of the market. This suggests a strong demand for properties suitable for couples or solo travelers.
- Together, 2 bedrooms and 3 bedrooms properties represent 85.0% of the active Airbnb listings in Town of Lake, indicating a high concentration in these sizes.
- A significant 50.0% of listings offer 3+ bedrooms, catering to larger groups and families seeking more space in Town of Lake.
Town of Lake Vacation Rental Guest Capacity Trends (2026)
Distribution of Listings by Guest Capacity
Guest Capacity Insights for Town of Lake
- The most common guest capacity trend in Town of Lake vacation rentals is listings accommodating 8+ guests (45%). This suggests the primary traveler segment is likely larger groups.
- Properties designed for 8+ guests and 4 guests dominate the Town of Lake STR market, accounting for 70.0% of listings.
- 65.0% of properties accommodate 6+ guests, serving the market segment for larger families or group travel in Town of Lake.
- On average, properties in Town of Lake are equipped to host 6.2 guests.
Town of Lake Airbnb Booking Patterns (2026): Available vs. Booked Days
Available Days Distribution
Booked Days Distribution
Booking Pattern Insights for Town of Lake
- The most common availability pattern in Town of Lake falls within the 271-366 days range, representing 70% of listings. This suggests many properties have significant open periods on their calendars.
- Approximately 95.0% of listings show high availability (181+ days open annually), indicating potential for increased bookings or specific owner usage patterns.
- For booked days, the 1-30 days range is most frequent in Town of Lake (40%), reflecting common guest stay durations or potential owner blocking patterns.
- A notable 5.0% of properties secure long booking periods (181+ days booked per year), highlighting successful long-term rental strategies or significant owner usage.
Town of Lake Airbnb Minimum Stay Requirements Analysis
Distribution of Listings by Minimum Night Requirement
2 Nights
4 listings
20% of total
3 Nights
5 listings
25% of total
4-6 Nights
2 listings
10% of total
30+ Nights
9 listings
45% of total
Key Insights
- The most prevalent minimum stay requirement in Town of Lake is 30+ Nights, adopted by 45% of listings. This highlights the market's preference for longer commitments.
- A significant segment (45%) caters to monthly stays (30+ nights) in Town of Lake, pointing to opportunities in the extended-stay market.
Recommendations
- Align with the market by considering a 30+ Nights minimum stay, as 45% of Town of Lake hosts use this setting.
- Explore offering discounts for stays of 30+ nights to attract the 45% of the market seeking extended stays.
- Adjust minimum nights based on seasonality – potentially shorter during low season and longer during peak demand periods in Town of Lake.
Town of Lake Airbnb Cancellation Policy Trends Analysis (2026)
Limited
1 listings
5% of total
Moderate
1 listings
5% of total
Firm
17 listings
85% of total
Strict
1 listings
5% of total
Cancellation Policy Insights for Town of Lake
- The prevailing Airbnb cancellation policy trend in Town of Lake is Firm, used by 85% of listings.
- A majority (90.0%) of hosts in Town of Lake utilize Firm or Strict policies, indicating a market where hosts prioritize booking security.
- Strict cancellation policies are quite rare (5%), potentially making listings with this policy less competitive unless justified by high demand or property type.
Recommendations for Hosts
- Consider adopting a Firm policy to align with the 85% market standard in Town of Lake.
- Using a Strict policy might deter some guests, as only 5% of listings use it. Evaluate if potential revenue protection outweighs possible lower booking rates.
- Regularly review your cancellation policy against competitors and market demand shifts in Town of Lake.
Town of Lake STR Booking Lead Time Analysis (2026)
Average Booking Lead Time by Month
Booking Lead Time Insights for Town of Lake
- The overall average booking lead time for vacation rentals in Town of Lake is 98 days.
- Guests book furthest in advance for stays during September (average 125 days), likely coinciding with peak travel demand or local events.
- The shortest booking windows occur for stays in March (average 40 days), indicating more last-minute travel plans during this time.
- Seasonally, Summer (109 days avg.) sees the longest lead times, while Spring (73 days avg.) has the shortest, reflecting typical travel planning cycles.
Recommendations for Hosts
- Use the overall average lead time (98 days) as a baseline for your pricing and availability strategy in Town of Lake.
- For September stays, consider implementing length-of-stay discounts or slightly higher rates for bookings made less than 125 days out to capitalize on advance planning.
- Target marketing efforts for the Summer season well in advance (at least 109 days) to capture early planners.
- Monitor your own booking lead times against these Town of Lake averages to identify opportunities for dynamic pricing adjustments.
Popular & Essential Airbnb Amenities in Town of Lake (2026)
Amenity Prevalence
Amenity Insights for Town of Lake
- Essential amenities in Town of Lake that guests expect include: Smoke alarm, Kitchen, Free parking on premises, Carbon monoxide alarm, BBQ grill. Lacking these (any) could significantly impact bookings.
- Popular amenities like Refrigerator, Coffee maker, Oven are common but not universal. Offering these can provide a competitive edge.
Recommendations for Hosts
- Ensure your listing includes all essential amenities for Town of Lake: Smoke alarm, Kitchen, Free parking on premises, Carbon monoxide alarm, BBQ grill.
- Prioritize adding missing essentials: BBQ grill.
- Consider adding popular differentiators like Refrigerator or Coffee maker to increase appeal.
- Highlight unique or less common amenities you offer (e.g., hot tub, dedicated workspace, EV charger) in your listing description and photos.
- Regularly check competitor amenities in Town of Lake to stay competitive.
Town of Lake Airbnb Guest Demographics & Profile Analysis (2026)
Guest Profile Summary for Town of Lake
- The typical guest profile for Airbnb in Town of Lake consists of primarily domestic travelers (100%), often arriving from nearby Chicago, typically belonging to the Post-2000s (Gen Z/Alpha) group (50%), primarily speaking English or German.
- Domestic travelers account for 100.0% of guests.
- Top languages spoken are English (85.7%) followed by German (7.1%).
- A significant demographic segment is the Post-2000s (Gen Z/Alpha) group, representing 50% of guests.
Recommendations for Hosts
- Target domestic marketing efforts towards travelers from Chicago and Milwaukee.
- Tailor amenities and listing descriptions to appeal to the dominant Post-2000s (Gen Z/Alpha) demographic (e.g., highlight fast WiFi, smart home features, local guides).
- Highlight unique local experiences or amenities relevant to the primary guest profile.
- Consider seasonal promotions aligned with peak travel times for key origin markets.
Nearby Short-Term Rental Market Comparison
How does the Town of Lake Airbnb market stack up against its neighbors? Compare key performance metrics like average monthly revenue, ADR, and occupancy rates in surrounding areas to understand the broader regional STR landscape.
| Market | Active Properties | Monthly Revenue | Daily Rate | Avg. Occupancy |
|---|---|---|---|---|
| Town of Newton | 11 | $6,557 | $770.72 | 42% |
| Town of Wilson | 16 | $6,450 | $620.70 | 43% |
| Suamico | 13 | $4,905 | $473.88 | 44% |
| Town of Osceola | 10 | $4,832 | $429.32 | 37% |
| Allouez | 20 | $4,141 | $459.86 | 35% |
| Green Bay | 427 | $3,858 | $459.47 | 38% |
| Town of Scott | 23 | $3,548 | $326.26 | 39% |
| Town of Mount Morris | 35 | $3,444 | $443.85 | 39% |
| Village of Rib Mountain | 14 | $3,435 | $397.28 | 39% |
| Town of Armenia | 12 | $3,409 | $485.58 | 35% |