Town of Dellona Airbnb Market Analysis 2026: Short Term Rental Data & Vacation Rental Statistics in Wisconsin, United States
Is Airbnb profitable in Town of Dellona in 2026? Explore comprehensive Airbnb analytics for Town of Dellona, Wisconsin, United States to uncover income potential. This 2026 STR market report for Town of Dellona, based on AirROI data from February 2025 to January 2026, reveals key trends in the niche market of 80 active listings.
Whether you're considering an Airbnb investment in Town of Dellona, optimizing your existing vacation rental, or exploring rental arbitrage opportunities, understanding the Town of Dellona Airbnb data is crucial. Leveraging the low regulation environment is key to maximizing your short term rental income potential. Let's dive into the specifics.
Key Town of Dellona Airbnb Performance Metrics Overview
Monthly Airbnb Revenue Variations & Income Potential in Town of Dellona (2026)
Understanding the monthly revenue variations for Airbnb listings in Town of Dellona is key to maximizing your short term rental income potential. Seasonality significantly impacts earnings. Our analysis, based on data from the past 12 months, shows that the peak revenue month for STRs in Town of Dellona is typically July, while October often presents the lowest earnings, highlighting opportunities for strategic pricing adjustments during shoulder and low seasons. Explore the typical Airbnb income in Town of Dellona across different performance tiers:
- Best-in-class properties (Top 10%) achieve $5,967+ monthly, often utilizing dynamic pricing and superior guest experiences.
- Strong performing properties (Top 25%) earn $4,378 or more, indicating effective management and desirable locations/amenities.
- Typical properties (Median) generate around $2,585 per month, representing the average market performance.
- Entry-level properties (Bottom 25%) see earnings around $1,137, often with potential for optimization.
Average Monthly Airbnb Earnings Trend in Town of Dellona
Town of Dellona Airbnb Occupancy Rate Trends (2026)
Maximize your bookings by understanding the Town of Dellona STR occupancy trends. Seasonal demand shifts significantly influence how often properties are booked. Typically, Augustsees the highest demand (peak season occupancy), while January experiences the lowest (low season). Effective strategies, like adjusting minimum stays or offering promotions, can boost occupancy during slower periods. Here's how different property tiers perform in Town of Dellona:
- Best-in-class properties (Top 10%) achieve 72%+ occupancy, indicating high desirability and potentially optimized availability.
- Strong performing properties (Top 25%) maintain 60% or higher occupancy, suggesting good market fit and guest satisfaction.
- Typical properties (Median) have an occupancy rate around 33%.
- Entry-level properties (Bottom 25%) average 16% occupancy, potentially facing higher vacancy.
Average Monthly Occupancy Rate Trend in Town of Dellona
Average Daily Rate (ADR) Airbnb Trends in Town of Dellona (2026)
Effective short term rental pricing strategy in Town of Dellona involves understanding monthly ADR fluctuations. The Average Daily Rate (ADR) for Airbnb in Town of Dellona typically peaks in December and dips lowest during April. Leveraging Airbnb dynamic pricing tools or strategies based on this seasonality can significantly boost revenue. Here's a look at the typical nightly rates achieved:
- Best-in-class properties (Top 10%) command rates of $342+ per night, often due to premium features or locations.
- Strong performing properties (Top 25%) achieve nightly rates of $284 or more.
- Typical properties (Median) charge around $221 per night.
- Entry-level properties (Bottom 25%) earn around $167 per night.
Average Daily Rate (ADR) Trend by Month in Town of Dellona
Get Live Town of Dellona Market Intelligence 👇

Explore Real-time Analytics
Airbnb Seasonality Analysis & Trends in Town of Dellona (2026)
Peak Season (July, August, June)
- Revenue averages $5,508 per month
- Occupancy rates average 58.0%
- Daily rates average $255
Shoulder Season
- Revenue averages $2,330 per month
- Occupancy maintains around 36.6%
- Daily rates hold near $224
Low Season (January, October, November)
- Revenue drops to average $1,657 per month
- Occupancy decreases to average 22.4%
- Daily rates adjust to average $256
Seasonality Insights for Town of Dellona
- The Airbnb seasonality in Town of Dellona shows highly seasonal trends requiring careful strategy. While the sections above show seasonal averages, it's also insightful to look at the extremes:
- During the high season, the absolute peak month showcases Town of Dellona's highest earning potential, with monthly revenues capable of climbing to $6,146, occupancy reaching a high of 61.6%, and ADRs peaking at $296.
- Conversely, the slowest single month of the year, typically falling within the low season, marks the market's lowest point. In this month, revenue might dip to $1,406, occupancy could drop to 18.3%, and ADRs may adjust down to $190.
- Understanding both the seasonal averages and these monthly peaks and troughs in revenue, occupancy, and ADR is crucial for maximizing your Airbnb profit potential in Town of Dellona.
Seasonal Strategies for Maximizing Profit
- Peak Season: Maximize revenue through premium pricing and potentially longer minimum stays. Ensure high availability.
- Low Season: Offer competitive pricing, special promotions (e.g., extended stay discounts), and flexible cancellation policies. Target off-season travelers like remote workers or budget-conscious guests.
- Shoulder Seasons: Implement dynamic pricing that balances peak and low rates. Target weekend travelers or specific events. Offer slightly more flexible terms than peak season.
- Regularly analyze your own performance against these Town of Dellona seasonality benchmarks and adjust your pricing and availability strategy accordingly.
Best Areas for Airbnb Investment in Town of Dellona (2026)
Exploring the top neighborhoods for short-term rentals in Town of Dellona? This section highlights key areas, outlining why they are attractive for hosts and guests, along with notable local attractions. Consider these locations based on your target guest profile and investment strategy.
| Neighborhood / Area | Why Host Here? (Target Guests & Appeal) | Key Attractions & Landmarks |
|---|---|---|
| Lake Wisconsin | A beautiful lake area perfect for summer activities such as fishing, boating, and swimming. Attracts families and outdoor enthusiasts looking for recreational opportunities. | Lake Wisconsin, Devil's Lake State Park, Wisconsin Dells, Babcock County Park, Fishing and boating spots |
| Downtown Dellona | The central hub of the Town of Dellona, providing close access to local eateries, shops, and community events. Ideal for visitors looking for convenience and local charm. | Community Center, Local Restaurants, Parks and Recreational Facilities, Farmers Market |
| Dellona Hills | A serene and scenic area with picturesque views of the surrounding landscapes, great for nature lovers and those seeking a peaceful retreat in nature. | Nature Trails, Hiking Spots, Wildlife Watching, Photography Opportunities |
| Nearby Wisconsin Dells | Known as the 'Water Park Capital of the World', this bustling tourist destination offers a variety of attractions making it a hotspot for Airbnb hosts and travelers. | Water Parks, Theme Parks, Shopping Outlets, Restaurants, Entertainment |
| Baraboo | A nearby town offering unique attractions such as the Circus World Museum and natural beauty, attracting families and history buffs. | Circus World Museum, Devil's Lake State Park, Historic Downtown Baraboo, Baraboo River |
| Sauk Prairie | A quaint area known for its historical significance and local attractions, providing a relaxed atmosphere for visitors. | Sauk Prairie Historical Society, Riverwalk, Parks and Recreational Areas |
| Spring Green | A charming village known for its artistry and cultural sites, perfect for hosting guests who appreciate art and nature. | Taliesin - Frank Lloyd Wright's home, Shakespeare Festival, Natural Beauty and Trails, Art Galleries |
| Reedsburg | A small town with a friendly atmosphere and access to local attractions, offering a quaint getaway for travelers. | Reedsburg Area Historical Society, Parks and Recreation, Fishing and Outdoor Activities |
Understanding Airbnb License Requirements & STR Laws in Town of Dellona (2026)
While Town of Dellona, Wisconsin, United States currently shows low STR regulations, specific Airbnb license requirements might still exist or change. Always verify the latest short term rental regulations and Airbnb license requirements directly with local government authorities for Town of Dellona to ensure full compliance before hosting.
(Source: AirROI data, 2026, finding no licensed listings among those analyzed)
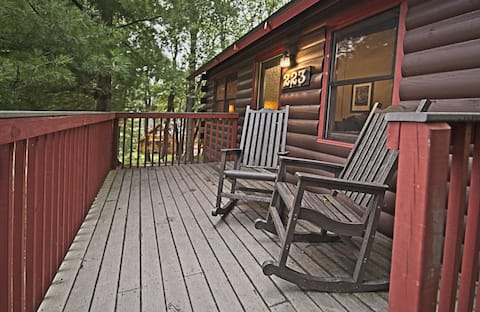
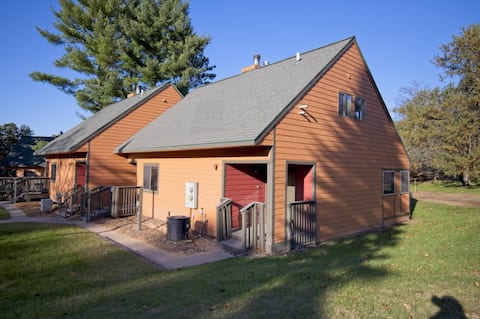
Top Performing Airbnb Properties in Town of Dellona (2026)
Benchmark your potential! Explore examples of top-performing Airbnb properties in Town of Dellonabased on Trailing Twelve Month (TTM) revenue. Analyze their characteristics, revenue, occupancy rate, and ADR to understand what drives success in this market.
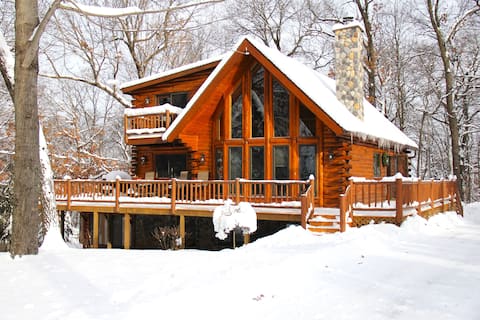
Home Sweet Log
Entire Place • 5 bedrooms

Welcome to Whiskey Woods!
Entire Place • 4 bedrooms

April's Christmas cottage, Sauna 4br, 3ba 10min DW
Entire Place • 4 bedrooms

Christmas Mountain Village - 2 Bedroom Villa
Private Room • 2 bedrooms
Christmas Mountain Village - 2 Bedroom Cabin
Private Room • 2 bedrooms
Christmas Mountain Village - 2 Bedroom Villa
Private Room • 2 bedrooms
Note: Performance varies based on location, size, amenities, seasonality, and management quality. Data reflects the past 12 months.
Top Performing Airbnb Hosts in Town of Dellona (2026)
Learn from the best! This table showcases top-performing Airbnb hosts in Town of Dellona based on the number of properties managed and estimated total revenue over the past year. Analyze their scale and performance metrics.
| Host Name | Properties | Grossing Revenue | Stay Reviews | Avg Rating |
|---|---|---|---|---|
| Simon | 43 | $892,871 | 313 | 4.59/5.0 |
| S & T | 12 | $180,048 | 420 | 4.70/5.0 |
| Darya | 2 | $82,899 | 33 | 4.91/5.0 |
| Oleg | 1 | $78,446 | 53 | 4.81/5.0 |
| Karla | 1 | $66,653 | 39 | 4.97/5.0 |
| Christine | 2 | $50,136 | 159 | 4.72/5.0 |
| Gary | 2 | $38,491 | 33 | 4.84/5.0 |
| Marlene | 1 | $33,942 | 76 | 4.72/5.0 |
| Amanda | 4 | $29,650 | 47 | 4.92/5.0 |
| Daniel | 1 | $27,691 | 56 | 4.86/5.0 |
Analyzing the strategies of top hosts, such as their property selection, pricing, and guest communication, can offer valuable lessons for optimizing your own Airbnb operations in Town of Dellona.
Dive Deeper: Advanced Town of Dellona STR Market Data (2026)
Ready to unlock more insights? AirROI provides access to advanced metrics and comprehensive Airbnb data for Town of Dellona. Explore detailed analytics beyond this report to refine your investment strategy, optimize pricing, and maximize your vacation rental profits.
Explore Advanced MetricsTown of Dellona Short-Term Rental Market Composition (2026): Property & Room Types
Room Type Distribution
Property Type Distribution
Market Composition Insights for Town of Dellona
- The Town of Dellona Airbnb market composition is heavily skewed towards Private Room listings, which make up 56.3% of the 80 active rentals. This indicates strong guest preference for privacy and space.
- Looking at the property type distribution in Town of Dellona, Hotel/Boutique properties are the most common (56.3%), reflecting the local real estate landscape.
- Houses represent a significant 26.3% portion, catering likely to families or larger groups.
- The presence of 56.3% Hotel/Boutique listings indicates integration with traditional hospitality.
- Smaller segments like apartment/condo (combined 1.3%) offer potential for unique stay experiences.
Town of Dellona Airbnb Room Capacity Analysis (2026): Bedroom Distribution
Distribution of Listings by Number of Bedrooms
Room Capacity Insights for Town of Dellona
- The dominant room capacity in Town of Dellona is 2 bedrooms listings, making up 81.3% of the market. This suggests a strong demand for properties suitable for couples or solo travelers.
- Together, 2 bedrooms and 1 bedroom properties represent 92.6% of the active Airbnb listings in Town of Dellona, indicating a high concentration in these sizes.
- Listings with 3+ bedrooms (7.6%) represent a smaller niche, potentially indicating an underserved market for larger group accommodations in Town of Dellona.
Town of Dellona Vacation Rental Guest Capacity Trends (2026)
Distribution of Listings by Guest Capacity
Guest Capacity Insights for Town of Dellona
- The most common guest capacity trend in Town of Dellona vacation rentals is listings accommodating 6 guests (78.8%). This suggests the primary traveler segment is likely larger groups.
- Properties designed for 6 guests and 4 guests dominate the Town of Dellona STR market, accounting for 90.1% of listings.
- 88.8% of properties accommodate 6+ guests, serving the market segment for larger families or group travel in Town of Dellona.
- On average, properties in Town of Dellona are equipped to host 6.0 guests.
Town of Dellona Airbnb Booking Patterns (2026): Available vs. Booked Days
Available Days Distribution
Booked Days Distribution
Booking Pattern Insights for Town of Dellona
- The most common availability pattern in Town of Dellona falls within the 271-366 days range, representing 60% of listings. This suggests many properties have significant open periods on their calendars.
- Approximately 100.0% of listings show high availability (181+ days open annually), indicating potential for increased bookings or specific owner usage patterns.
- For booked days, the 91-180 days range is most frequent in Town of Dellona (41.3%), reflecting common guest stay durations or potential owner blocking patterns.
- A notable 1.3% of properties secure long booking periods (181+ days booked per year), highlighting successful long-term rental strategies or significant owner usage.
Town of Dellona Airbnb Minimum Stay Requirements Analysis
Distribution of Listings by Minimum Night Requirement
2 Nights
55 listings
68.8% of total
3 Nights
6 listings
7.5% of total
4-6 Nights
3 listings
3.8% of total
7-29 Nights
2 listings
2.5% of total
30+ Nights
14 listings
17.5% of total
Key Insights
- The most prevalent minimum stay requirement in Town of Dellona is 2 Nights, adopted by 68.8% of listings. This highlights the market's preference for shorter, flexible bookings.
- A strong majority (68.8%) of the Town of Dellona Airbnb data shows acceptance of very short stays (1-2 nights), indicating a dynamic, high-turnover market.
- A significant segment (17.5%) caters to monthly stays (30+ nights) in Town of Dellona, pointing to opportunities in the extended-stay market.
Recommendations
- Align with the market by considering a 2 Nights minimum stay, as 68.8% of Town of Dellona hosts use this setting.
- A 2-night minimum appears standard (68.8%). Consider this for weekends or peak periods.
- Explore offering discounts for stays of 30+ nights to attract the 17.5% of the market seeking extended stays.
- Adjust minimum nights based on seasonality – potentially shorter during low season and longer during peak demand periods in Town of Dellona.
Town of Dellona Airbnb Cancellation Policy Trends Analysis (2026)
Flexible
6 listings
7.5% of total
Moderate
6 listings
7.5% of total
Firm
9 listings
11.3% of total
Strict
59 listings
73.8% of total
Cancellation Policy Insights for Town of Dellona
- The prevailing Airbnb cancellation policy trend in Town of Dellona is Strict, used by 73.8% of listings.
- A majority (85.1%) of hosts in Town of Dellona utilize Firm or Strict policies, indicating a market where hosts prioritize booking security.
Recommendations for Hosts
- Consider adopting a Strict policy to align with the 73.8% market standard in Town of Dellona.
- With 73.8% using Strict terms, this is a viable option in Town of Dellona, particularly for high-value properties or during peak demand periods.
- Regularly review your cancellation policy against competitors and market demand shifts in Town of Dellona.
Town of Dellona STR Booking Lead Time Analysis (2026)
Average Booking Lead Time by Month
Booking Lead Time Insights for Town of Dellona
- The overall average booking lead time for vacation rentals in Town of Dellona is 57 days.
- Guests book furthest in advance for stays during July (average 124 days), likely coinciding with peak travel demand or local events.
- The shortest booking windows occur for stays in January (average 20 days), indicating more last-minute travel plans during this time.
- Seasonally, Summer (91 days avg.) sees the longest lead times, while Winter (37 days avg.) has the shortest, reflecting typical travel planning cycles.
Recommendations for Hosts
- Use the overall average lead time (57 days) as a baseline for your pricing and availability strategy in Town of Dellona.
- For July stays, consider implementing length-of-stay discounts or slightly higher rates for bookings made less than 124 days out to capitalize on advance planning.
- Target marketing efforts for the Summer season well in advance (at least 91 days) to capture early planners.
- Monitor your own booking lead times against these Town of Dellona averages to identify opportunities for dynamic pricing adjustments.
Popular & Essential Airbnb Amenities in Town of Dellona (2026)
Amenity Prevalence
Amenity Insights for Town of Dellona
- Essential amenities in Town of Dellona that guests expect include: TV, Wifi, Kitchen, Free parking on premises, Heating, Air conditioning, Hangers, Iron, Fire extinguisher, Pool. Lacking these (any) could significantly impact bookings.
Recommendations for Hosts
- Ensure your listing includes all essential amenities for Town of Dellona: TV, Wifi, Kitchen, Free parking on premises, Heating, Air conditioning, Hangers, Iron, Fire extinguisher, Pool.
- Prioritize adding missing essentials: Heating, Air conditioning, Hangers, Iron, Fire extinguisher, Pool.
- Highlight unique or less common amenities you offer (e.g., hot tub, dedicated workspace, EV charger) in your listing description and photos.
- Regularly check competitor amenities in Town of Dellona to stay competitive.
Town of Dellona Airbnb Guest Demographics & Profile Analysis (2026)
Guest Profile Summary for Town of Dellona
- The typical guest profile for Airbnb in Town of Dellona consists of primarily domestic travelers (95%), often arriving from nearby Milwaukee, typically belonging to the Post-2000s (Gen Z/Alpha) group (50%), primarily speaking English or Ukrainian.
- Domestic travelers account for 94.6% of guests.
- Key international markets include United States (94.6%) and Mexico (2.7%).
- Top languages spoken are English (65.4%) followed by Ukrainian (7.7%).
- A significant demographic segment is the Post-2000s (Gen Z/Alpha) group, representing 50% of guests.
Recommendations for Hosts
- Target domestic marketing efforts towards travelers from Milwaukee and Chicago.
- Tailor amenities and listing descriptions to appeal to the dominant Post-2000s (Gen Z/Alpha) demographic (e.g., highlight fast WiFi, smart home features, local guides).
- Highlight unique local experiences or amenities relevant to the primary guest profile.
- Consider seasonal promotions aligned with peak travel times for key origin markets.
Nearby Short-Term Rental Market Comparison
How does the Town of Dellona Airbnb market stack up against its neighbors? Compare key performance metrics like average monthly revenue, ADR, and occupancy rates in surrounding areas to understand the broader regional STR landscape.
| Market | Active Properties | Monthly Revenue | Daily Rate | Avg. Occupancy |
|---|---|---|---|---|
| Town of Sugar Creek | 18 | $9,830 | $662.90 | 53% |
| Monona | 29 | $6,957 | $648.65 | 49% |
| Town of Newton | 11 | $6,557 | $770.72 | 42% |
| Town of Wilson | 16 | $6,450 | $620.70 | 43% |
| Twin Lakes | 35 | $6,152 | $547.55 | 43% |
| Town of Germantown | 66 | $5,208 | $527.82 | 37% |
| Lake Geneva | 209 | $5,014 | $473.36 | 41% |
| Town of Geneva | 63 | $5,012 | $448.89 | 43% |
| McHenry | 32 | $4,982 | $463.12 | 44% |
| Suamico | 13 | $4,905 | $473.88 | 44% |