Prescott Airbnb Market Analysis 2026: Short Term Rental Data & Vacation Rental Statistics in Wisconsin, United States
Is Airbnb profitable in Prescott in 2026? Explore comprehensive Airbnb analytics for Prescott, Wisconsin, United States to uncover income potential. This 2026 STR market report for Prescott, based on AirROI data from February 2025 to January 2026, reveals key trends in the niche market of 33 active listings.
Whether you're considering an Airbnb investment in Prescott, optimizing your existing vacation rental, or exploring rental arbitrage opportunities, understanding the Prescott Airbnb data is crucial. Leveraging the low regulation environment is key to maximizing your short term rental income potential. Let's dive into the specifics.
Key Prescott Airbnb Performance Metrics Overview
Monthly Airbnb Revenue Variations & Income Potential in Prescott (2026)
Understanding the monthly revenue variations for Airbnb listings in Prescott is key to maximizing your short term rental income potential. Seasonality significantly impacts earnings. Our analysis, based on data from the past 12 months, shows that the peak revenue month for STRs in Prescott is typically August, while February often presents the lowest earnings, highlighting opportunities for strategic pricing adjustments during shoulder and low seasons. Explore the typical Airbnb income in Prescott across different performance tiers:
- Best-in-class properties (Top 10%) achieve $6,023+ monthly, often utilizing dynamic pricing and superior guest experiences.
- Strong performing properties (Top 25%) earn $3,656 or more, indicating effective management and desirable locations/amenities.
- Typical properties (Median) generate around $2,164 per month, representing the average market performance.
- Entry-level properties (Bottom 25%) see earnings around $1,118, often with potential for optimization.
Average Monthly Airbnb Earnings Trend in Prescott
Prescott Airbnb Occupancy Rate Trends (2026)
Maximize your bookings by understanding the Prescott STR occupancy trends. Seasonal demand shifts significantly influence how often properties are booked. Typically, Julysees the highest demand (peak season occupancy), while December experiences the lowest (low season). Effective strategies, like adjusting minimum stays or offering promotions, can boost occupancy during slower periods. Here's how different property tiers perform in Prescott:
- Best-in-class properties (Top 10%) achieve 63%+ occupancy, indicating high desirability and potentially optimized availability.
- Strong performing properties (Top 25%) maintain 46% or higher occupancy, suggesting good market fit and guest satisfaction.
- Typical properties (Median) have an occupancy rate around 32%.
- Entry-level properties (Bottom 25%) average 20% occupancy, potentially facing higher vacancy.
Average Monthly Occupancy Rate Trend in Prescott
Average Daily Rate (ADR) Airbnb Trends in Prescott (2026)
Effective short term rental pricing strategy in Prescott involves understanding monthly ADR fluctuations. The Average Daily Rate (ADR) for Airbnb in Prescott typically peaks in December and dips lowest during February. Leveraging Airbnb dynamic pricing tools or strategies based on this seasonality can significantly boost revenue. Here's a look at the typical nightly rates achieved:
- Best-in-class properties (Top 10%) command rates of $427+ per night, often due to premium features or locations.
- Strong performing properties (Top 25%) achieve nightly rates of $211 or more.
- Typical properties (Median) charge around $178 per night.
- Entry-level properties (Bottom 25%) earn around $154 per night.
Average Daily Rate (ADR) Trend by Month in Prescott
Get Live Prescott Market Intelligence 👇

Explore Real-time Analytics
Airbnb Seasonality Analysis & Trends in Prescott (2026)
Peak Season (August, July, June)
- Revenue averages $4,982 per month
- Occupancy rates average 49.0%
- Daily rates average $271
Shoulder Season
- Revenue averages $3,450 per month
- Occupancy maintains around 32.1%
- Daily rates hold near $271
Low Season (February, March, November)
- Revenue drops to average $2,363 per month
- Occupancy decreases to average 29.0%
- Daily rates adjust to average $258
Seasonality Insights for Prescott
- The Airbnb seasonality in Prescott shows highly seasonal trends requiring careful strategy. While the sections above show seasonal averages, it's also insightful to look at the extremes:
- During the high season, the absolute peak month showcases Prescott's highest earning potential, with monthly revenues capable of climbing to $5,241, occupancy reaching a high of 53.6%, and ADRs peaking at $280.
- Conversely, the slowest single month of the year, typically falling within the low season, marks the market's lowest point. In this month, revenue might dip to $2,093, occupancy could drop to 21.9%, and ADRs may adjust down to $247.
- Understanding both the seasonal averages and these monthly peaks and troughs in revenue, occupancy, and ADR is crucial for maximizing your Airbnb profit potential in Prescott.
Seasonal Strategies for Maximizing Profit
- Peak Season: Maximize revenue through premium pricing and potentially longer minimum stays. Ensure high availability.
- Low Season: Offer competitive pricing, special promotions (e.g., extended stay discounts), and flexible cancellation policies. Target off-season travelers like remote workers or budget-conscious guests.
- Shoulder Seasons: Implement dynamic pricing that balances peak and low rates. Target weekend travelers or specific events. Offer slightly more flexible terms than peak season.
- Regularly analyze your own performance against these Prescott seasonality benchmarks and adjust your pricing and availability strategy accordingly.
Best Areas for Airbnb Investment in Prescott (2026)
Exploring the top neighborhoods for short-term rentals in Prescott? This section highlights key areas, outlining why they are attractive for hosts and guests, along with notable local attractions. Consider these locations based on your target guest profile and investment strategy.
| Neighborhood / Area | Why Host Here? (Target Guests & Appeal) | Key Attractions & Landmarks |
|---|---|---|
| Downtown Prescott | The heart of Prescott with charming streets, historic buildings, and a vibrant atmosphere. It's an ideal spot for guests who want to explore local shops, restaurants, and cultural events. | Whiskey Row, Prescott Courthouse Square, Sharlot Hall Museum, Prescott Arts and Humanities Council, The Palace Restaurant and Saloon |
| Peavine Trail | A scenic and popular trail area for hiking and biking, appealing to outdoor enthusiasts. This location offers access to the beautiful landscapes surrounding Prescott. | Peavine Trail, Watson Lake, Willow Lake, Granite Basin Lake, Biking and hiking activities |
| Thumb Butte | Famous for its beautiful hiking trails and panoramic views of the Prescott area. This location attracts those looking to immerse themselves in nature and enjoy outdoor activities. | Thumb Butte Trail, Granite Dells, Sierra Prieta Mountain, Nature trails, Wildlife viewing |
| Lynx Lake | A popular recreational area known for fishing, kayaking, and picnicking. Ideal for families and nature lovers looking for a peaceful getaway. | Lynx Lake, Lynx Lake Loop Trail, Fishing spots, Picnic areas, Boating opportunities |
| Antelope Hills | A residential area with close proximity to golf courses and outdoor spaces, appealing to guests wanting relaxation and recreational activities. | Antelope Hills Golf Course, Scenic views, Walking paths, Community parks, Proximity to amenities |
| Prescott Valley | A nearby growing community with shopping, dining, and family-friendly activities. This area is popular with visitors due to its proximity to Prescott itself. | Findlay Toyota Center, Prescott Valley Civic Center, Shopping centers, Restaurants, Nearby outdoor activities |
| Granite Dells | A stunning area of unique rock formations and natural beauty, perfect for guests looking for adventure and photography opportunities. | Granite Dells, Watson Lake, Hiking trails, Scenic views, Rock climbing |
| Dells Ranch | A more rural area that offers peace and tranquility, ideal for those looking to escape the hustle and bustle and enjoy nature. | Rural landscapes, Quiet atmosphere, Nature trails, Wildlife viewing, Farms and local produce |
Understanding Airbnb License Requirements & STR Laws in Prescott (2026)
While Prescott, Wisconsin, United States currently shows low STR regulations, specific Airbnb license requirements might still exist or change. Always verify the latest short term rental regulations and Airbnb license requirements directly with local government authorities for Prescott to ensure full compliance before hosting.
(Source: AirROI data, 2026, finding no licensed listings among those analyzed)
Top Performing Airbnb Properties in Prescott (2026)
Benchmark your potential! Explore examples of top-performing Airbnb properties in Prescottbased on Trailing Twelve Month (TTM) revenue. Analyze their characteristics, revenue, occupancy rate, and ADR to understand what drives success in this market.

Celebrate Downtown | Rooftop Patio | Arcade
Entire Place • 8 bedrooms
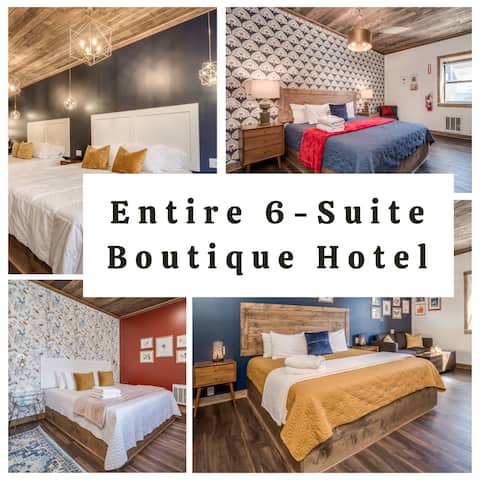
The Chapel House
Entire Place • 6 bedrooms

Bridal Party | Glam Room | Rooftop Patio & Arcade
Entire Place • 2 bedrooms

Walk Downtown | Rooftop Patio | Game Room
Entire Place • 3 bedrooms
Event-Approved | Sleeps 14 | 6 Private Suites w/Ba
Entire Place • 6 bedrooms

Gather Together | Rooftop Patio Retreat | Downtown
Entire Place • 2 bedrooms
Note: Performance varies based on location, size, amenities, seasonality, and management quality. Data reflects the past 12 months.
Top Performing Airbnb Hosts in Prescott (2026)
Learn from the best! This table showcases top-performing Airbnb hosts in Prescott based on the number of properties managed and estimated total revenue over the past year. Analyze their scale and performance metrics.
| Host Name | Properties | Grossing Revenue | Stay Reviews | Avg Rating |
|---|---|---|---|---|
| Megan | 27 | $870,667 | 698 | 4.92/5.0 |
| Ann & John | 1 | $106,823 | 8 | 5.00/5.0 |
| Jessica | 1 | $42,427 | 344 | 4.98/5.0 |
| Wendy | 1 | $31,403 | 99 | 4.92/5.0 |
| Sherri | 1 | $30,454 | 39 | 5.00/5.0 |
| Jilleen | 1 | $3,243 | 46 | 4.50/5.0 |
| Chad | 1 | $565 | 42 | 4.90/5.0 |
Analyzing the strategies of top hosts, such as their property selection, pricing, and guest communication, can offer valuable lessons for optimizing your own Airbnb operations in Prescott.
Dive Deeper: Advanced Prescott STR Market Data (2026)
Ready to unlock more insights? AirROI provides access to advanced metrics and comprehensive Airbnb data for Prescott. Explore detailed analytics beyond this report to refine your investment strategy, optimize pricing, and maximize your vacation rental profits.
Explore Advanced MetricsPrescott Short-Term Rental Market Composition (2026): Property & Room Types
Room Type Distribution
Property Type Distribution
Market Composition Insights for Prescott
- The Prescott Airbnb market composition is heavily skewed towards Entire Home/Apt listings, which make up 100% of the 33 active rentals. This indicates strong guest preference for privacy and space.
- Looking at the property type distribution in Prescott, Others properties are the most common (69.7%), reflecting the local real estate landscape.
Prescott Airbnb Room Capacity Analysis (2026): Bedroom Distribution
Distribution of Listings by Number of Bedrooms
Room Capacity Insights for Prescott
- The dominant room capacity in Prescott is 1 bedroom listings, making up 66.7% of the market. This suggests a strong demand for properties suitable for couples or solo travelers.
- Together, 1 bedroom and 2 bedrooms properties represent 78.8% of the active Airbnb listings in Prescott, indicating a high concentration in these sizes.
- With over half the market (66.7%) consisting of studios or 1-bedroom units, Prescott is particularly well-suited for individuals or couples.
Prescott Vacation Rental Guest Capacity Trends (2026)
Distribution of Listings by Guest Capacity
Guest Capacity Insights for Prescott
- The most common guest capacity trend in Prescott vacation rentals is listings accommodating 2 guests (57.6%). This suggests the primary traveler segment is likely couples or solo travelers.
- Properties designed for 2 guests and 6 guests dominate the Prescott STR market, accounting for 69.7% of listings.
- A significant 57.6% of listings cater specifically to 1-2 guests, highlighting strong demand from couples and solo travelers in Prescott.
- 27.2% of properties accommodate 6+ guests, serving the market segment for larger families or group travel in Prescott.
- On average, properties in Prescott are equipped to host 3.6 guests.
Prescott Airbnb Booking Patterns (2026): Available vs. Booked Days
Available Days Distribution
Booked Days Distribution
Booking Pattern Insights for Prescott
- The most common availability pattern in Prescott falls within the 181-270 days range, representing 51.5% of listings. This suggests many properties have significant open periods on their calendars.
- Approximately 90.9% of listings show high availability (181+ days open annually), indicating potential for increased bookings or specific owner usage patterns.
- For booked days, the 91-180 days range is most frequent in Prescott (54.5%), reflecting common guest stay durations or potential owner blocking patterns.
- A notable 9.1% of properties secure long booking periods (181+ days booked per year), highlighting successful long-term rental strategies or significant owner usage.
Prescott Airbnb Minimum Stay Requirements Analysis
Distribution of Listings by Minimum Night Requirement
1 Night
21 listings
63.6% of total
2 Nights
4 listings
12.1% of total
3 Nights
1 listings
3% of total
7-29 Nights
2 listings
6.1% of total
30+ Nights
5 listings
15.2% of total
Key Insights
- The most prevalent minimum stay requirement in Prescott is 1 Night, adopted by 63.6% of listings. This highlights the market's preference for shorter, flexible bookings.
- A strong majority (75.7%) of the Prescott Airbnb data shows acceptance of very short stays (1-2 nights), indicating a dynamic, high-turnover market.
- A significant segment (15.2%) caters to monthly stays (30+ nights) in Prescott, pointing to opportunities in the extended-stay market.
Recommendations
- Align with the market by considering a 1 Night minimum stay, as 63.6% of Prescott hosts use this setting.
- Explore offering discounts for stays of 30+ nights to attract the 15.2% of the market seeking extended stays.
- Adjust minimum nights based on seasonality – potentially shorter during low season and longer during peak demand periods in Prescott.
Prescott Airbnb Cancellation Policy Trends Analysis (2026)
Super Strict 60 Days
1 listings
3% of total
Limited
10 listings
30.3% of total
Moderate
16 listings
48.5% of total
Firm
4 listings
12.1% of total
Strict
2 listings
6.1% of total
Cancellation Policy Insights for Prescott
- The prevailing Airbnb cancellation policy trend in Prescott is Moderate, used by 48.5% of listings.
- There's a relatively balanced mix between guest-friendly (48.5%) and stricter (18.2%) policies, offering choices for different guest needs.
- Strict cancellation policies are quite rare (6.1%), potentially making listings with this policy less competitive unless justified by high demand or property type.
Recommendations for Hosts
- Consider adopting a Moderate policy to align with the 48.5% market standard in Prescott.
- Using a Strict policy might deter some guests, as only 6.1% of listings use it. Evaluate if potential revenue protection outweighs possible lower booking rates.
- Regularly review your cancellation policy against competitors and market demand shifts in Prescott.
Prescott STR Booking Lead Time Analysis (2026)
Average Booking Lead Time by Month
Booking Lead Time Insights for Prescott
- The overall average booking lead time for vacation rentals in Prescott is 35 days.
- Guests book furthest in advance for stays during September (average 62 days), likely coinciding with peak travel demand or local events.
- The shortest booking windows occur for stays in March (average 10 days), indicating more last-minute travel plans during this time.
- Seasonally, Summer (46 days avg.) sees the longest lead times, while Spring (25 days avg.) has the shortest, reflecting typical travel planning cycles.
Recommendations for Hosts
- Use the overall average lead time (35 days) as a baseline for your pricing and availability strategy in Prescott.
- For September stays, consider implementing length-of-stay discounts or slightly higher rates for bookings made less than 62 days out to capitalize on advance planning.
- During March, focus on last-minute booking availability and promotions, as guests book with very short notice (10 days avg.).
- Target marketing efforts for the Summer season well in advance (at least 46 days) to capture early planners.
- Monitor your own booking lead times against these Prescott averages to identify opportunities for dynamic pricing adjustments.
Popular & Essential Airbnb Amenities in Prescott (2026)
Amenity Prevalence
Amenity Insights for Prescott
- Essential amenities in Prescott that guests expect include: Air conditioning, Microwave, Smoke alarm, Bed linens, Heating, Hot water, Carbon monoxide alarm, Wifi, Iron, TV. Lacking these (any) could significantly impact bookings.
Recommendations for Hosts
- Ensure your listing includes all essential amenities for Prescott: Air conditioning, Microwave, Smoke alarm, Bed linens, Heating, Hot water, Carbon monoxide alarm, Wifi, Iron, TV.
- Prioritize adding missing essentials: Iron, TV.
- Highlight unique or less common amenities you offer (e.g., hot tub, dedicated workspace, EV charger) in your listing description and photos.
- Regularly check competitor amenities in Prescott to stay competitive.
Prescott Airbnb Guest Demographics & Profile Analysis (2026)
Guest Profile Summary for Prescott
- The typical guest profile for Airbnb in Prescott consists of primarily domestic travelers (99%), often arriving from nearby Minneapolis, typically belonging to the Post-2000s (Gen Z/Alpha) group (50%), primarily speaking English or Spanish.
- Domestic travelers account for 99.4% of guests.
- Key international markets include United States (99.4%) and Australia (0.6%).
- Top languages spoken are English (78.5%) followed by Spanish (13.8%).
- A significant demographic segment is the Post-2000s (Gen Z/Alpha) group, representing 50% of guests.
Recommendations for Hosts
- Target domestic marketing efforts towards travelers from Minneapolis and Saint Paul.
- Tailor amenities and listing descriptions to appeal to the dominant Post-2000s (Gen Z/Alpha) demographic (e.g., highlight fast WiFi, smart home features, local guides).
- Highlight unique local experiences or amenities relevant to the primary guest profile.
- Consider seasonal promotions aligned with peak travel times for key origin markets.
Nearby Short-Term Rental Market Comparison
How does the Prescott Airbnb market stack up against its neighbors? Compare key performance metrics like average monthly revenue, ADR, and occupancy rates in surrounding areas to understand the broader regional STR landscape.
| Market | Active Properties | Monthly Revenue | Daily Rate | Avg. Occupancy |
|---|---|---|---|---|
| Hastings | 14 | $6,579 | $481.32 | 46% |
| Shoreview | 12 | $5,525 | $470.30 | 56% |
| Forest Lake | 25 | $4,839 | $398.24 | 47% |
| Wayzata | 20 | $4,819 | $432.69 | 50% |
| Mound | 15 | $4,463 | $459.67 | 48% |
| Fridley | 26 | $4,404 | $294.56 | 54% |
| Scandia | 13 | $4,256 | $429.44 | 41% |
| Town of Anson | 10 | $4,205 | $355.03 | 47% |
| Town of Georgetown | 18 | $4,200 | $607.30 | 34% |
| Stillwater | 55 | $4,146 | $369.15 | 41% |