Milwaukee Airbnb Market Analysis 2026: Short Term Rental Data & Vacation Rental Statistics in Wisconsin, United States
Is Airbnb profitable in Milwaukee in 2026? Explore comprehensive Airbnb analytics for Milwaukee, Wisconsin, United States to uncover income potential. This 2026 STR market report for Milwaukee, based on AirROI data from February 2025 to January 2026, reveals key trends in the bustling market of 1,213 active listings.
Whether you're considering an Airbnb investment in Milwaukee, optimizing your existing vacation rental, or exploring rental arbitrage opportunities, understanding the Milwaukee Airbnb data is crucial. Leveraging the low regulation environment is key to maximizing your short term rental income potential. Let's dive into the specifics.
Key Milwaukee Airbnb Performance Metrics Overview
Monthly Airbnb Revenue Variations & Income Potential in Milwaukee (2026)
Understanding the monthly revenue variations for Airbnb listings in Milwaukee is key to maximizing your short term rental income potential. Seasonality significantly impacts earnings. Our analysis, based on data from the past 12 months, shows that the peak revenue month for STRs in Milwaukee is typically July, while February often presents the lowest earnings, highlighting opportunities for strategic pricing adjustments during shoulder and low seasons. Explore the typical Airbnb income in Milwaukee across different performance tiers:
- Best-in-class properties (Top 10%) achieve $5,991+ monthly, often utilizing dynamic pricing and superior guest experiences.
- Strong performing properties (Top 25%) earn $3,829 or more, indicating effective management and desirable locations/amenities.
- Typical properties (Median) generate around $2,211 per month, representing the average market performance.
- Entry-level properties (Bottom 25%) see earnings around $1,187, often with potential for optimization.
Average Monthly Airbnb Earnings Trend in Milwaukee
Milwaukee Airbnb Occupancy Rate Trends (2026)
Maximize your bookings by understanding the Milwaukee STR occupancy trends. Seasonal demand shifts significantly influence how often properties are booked. Typically, Julysees the highest demand (peak season occupancy), while January experiences the lowest (low season). Effective strategies, like adjusting minimum stays or offering promotions, can boost occupancy during slower periods. Here's how different property tiers perform in Milwaukee:
- Best-in-class properties (Top 10%) achieve 79%+ occupancy, indicating high desirability and potentially optimized availability.
- Strong performing properties (Top 25%) maintain 63% or higher occupancy, suggesting good market fit and guest satisfaction.
- Typical properties (Median) have an occupancy rate around 44%.
- Entry-level properties (Bottom 25%) average 25% occupancy, potentially facing higher vacancy.
Average Monthly Occupancy Rate Trend in Milwaukee
Average Daily Rate (ADR) Airbnb Trends in Milwaukee (2026)
Effective short term rental pricing strategy in Milwaukee involves understanding monthly ADR fluctuations. The Average Daily Rate (ADR) for Airbnb in Milwaukee typically peaks in July and dips lowest during February. Leveraging Airbnb dynamic pricing tools or strategies based on this seasonality can significantly boost revenue. Here's a look at the typical nightly rates achieved:
- Best-in-class properties (Top 10%) command rates of $384+ per night, often due to premium features or locations.
- Strong performing properties (Top 25%) achieve nightly rates of $245 or more.
- Typical properties (Median) charge around $157 per night.
- Entry-level properties (Bottom 25%) earn around $104 per night.
Average Daily Rate (ADR) Trend by Month in Milwaukee
Get Live Milwaukee Market Intelligence 👇

Explore Real-time Analytics
Airbnb Seasonality Analysis & Trends in Milwaukee (2026)
Peak Season (July, June, August)
- Revenue averages $4,343 per month
- Occupancy rates average 55.7%
- Daily rates average $231
Shoulder Season
- Revenue averages $2,761 per month
- Occupancy maintains around 43.3%
- Daily rates hold near $206
Low Season (January, February, April)
- Revenue drops to average $1,955 per month
- Occupancy decreases to average 37.5%
- Daily rates adjust to average $190
Seasonality Insights for Milwaukee
- The Airbnb seasonality in Milwaukee shows highly seasonal trends requiring careful strategy. While the sections above show seasonal averages, it's also insightful to look at the extremes:
- During the high season, the absolute peak month showcases Milwaukee's highest earning potential, with monthly revenues capable of climbing to $4,768, occupancy reaching a high of 58.0%, and ADRs peaking at $238.
- Conversely, the slowest single month of the year, typically falling within the low season, marks the market's lowest point. In this month, revenue might dip to $1,731, occupancy could drop to 30.9%, and ADRs may adjust down to $179.
- Understanding both the seasonal averages and these monthly peaks and troughs in revenue, occupancy, and ADR is crucial for maximizing your Airbnb profit potential in Milwaukee.
Seasonal Strategies for Maximizing Profit
- Peak Season: Maximize revenue through premium pricing and potentially longer minimum stays. Ensure high availability.
- Low Season: Offer competitive pricing, special promotions (e.g., extended stay discounts), and flexible cancellation policies. Target off-season travelers like remote workers or budget-conscious guests.
- Shoulder Seasons: Implement dynamic pricing that balances peak and low rates. Target weekend travelers or specific events. Offer slightly more flexible terms than peak season.
- Regularly analyze your own performance against these Milwaukee seasonality benchmarks and adjust your pricing and availability strategy accordingly.
Best Areas for Airbnb Investment in Milwaukee (2026)
Exploring the top neighborhoods for short-term rentals in Milwaukee? This section highlights key areas, outlining why they are attractive for hosts and guests, along with notable local attractions. Consider these locations based on your target guest profile and investment strategy.
| Neighborhood / Area | Why Host Here? (Target Guests & Appeal) | Key Attractions & Landmarks |
|---|---|---|
| East Side | A vibrant area known for its nightlife, dining, and proximity to Lake Michigan. Popular among young professionals, students, and tourists looking for a lively atmosphere with plenty of entertainment options. | University of Wisconsin-Milwaukee, Lake Park, North Avenue Beach, Locust Street, Brady Street |
| Third Ward | This artsy neighborhood features unique shops, galleries, and the historic Milwaukee Public Market. It's a cultural hub that attracts visitors for its creativity and community events. | Milwaukee Public Market, The Iron Market, Harley-Davidson Museum, Art galleries, Concerts in the park |
| Historic Third Ward | Known for its restored historic buildings and trendy lofts, this area offers a mix of dining, shopping, and arts that draws both locals and tourists alike. | Milwaukee Institute of Art & Design, The Milwaukee Plankinton Building, The Broadway Theatre, The Milwaukee Ballet, Riverwalk |
| Downtown Milwaukee | The city's central business district is bustling with activity, offering restaurants, nightlife, and easy access to major attractions, making it ideal for short-term stays. | Fiserv Forum, The Wisconsin Center, Pabst Theater, Discovery World, Milwaukee Art Museum |
| Bay View | A hip neighborhood known for its community feel, parks, and local breweries. It attracts a diverse crowd, especially younger residents and visitors looking for a laid-back vibe. | South Shore Park, Lake Michigan, Local breweries, Kayaking, Historic homes |
| Walker’s Point | This neighborhood is known for its LGBTQ+ friendly atmosphere, vibrant nightlife, and art scene, making it appealing to those seeking a unique urban experience. | Vennture Brew Company, The Buzzard Cage, Gallery Night, Local festivals, Food truck events |
| Shorewood | A suburban vibe with tree-lined streets and local shops, it's popular among families and offers a quieter environment with easy access to Milwaukee's attractions. | Shorewood Farmers Market, Lake Michigan shoreline, Atwater Park, Local cafes, Community events |
| South Milwaukee | An up-and-coming area that offers local charm and proximity to the lakefront, appealing to guests looking for a more suburban feel while being close to downtown. | Grant Park, Beverly Gardens Park, South Milwaukee Performing Arts Center, Local eateries, Historic downtown |
Understanding Airbnb License Requirements & STR Laws in Milwaukee (2026)
While Milwaukee, Wisconsin, United States currently shows low STR regulations, specific Airbnb license requirements might still exist or change. Always verify the latest short term rental regulations and Airbnb license requirements directly with local government authorities for Milwaukee to ensure full compliance before hosting.
(Source: AirROI data, 2026, based on 0% licensed listings)
Top Performing Airbnb Properties in Milwaukee (2026)
Benchmark your potential! Explore examples of top-performing Airbnb properties in Milwaukeebased on Trailing Twelve Month (TTM) revenue. Analyze their characteristics, revenue, occupancy rate, and ADR to understand what drives success in this market.
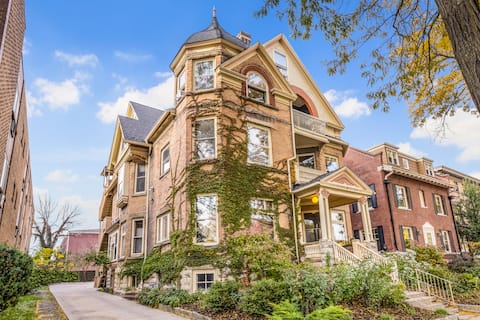
The Prospect Mansion & Loft
Entire Place • 10 bedrooms

Downtown-2 King Beds-hot tub-Double Shower-Parking
Entire Place • 3 bedrooms

Downtown Oasis: Hot Tub, Garage, 2 King Huge yard!
Entire Place • 3 bedrooms

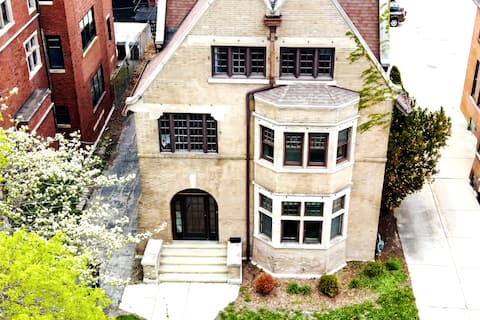
Upper East Side Victorian with 9 bedrooms!
Entire Place • 9 bedrooms
MKE Mansion. Ideal for large groups visiting MKE.
Entire Place • 6 bedrooms

Bayview Spacious Main House plus Guest House
Entire Place • 6 bedrooms
Note: Performance varies based on location, size, amenities, seasonality, and management quality. Data reflects the past 12 months.
Top Performing Airbnb Hosts in Milwaukee (2026)
Learn from the best! This table showcases top-performing Airbnb hosts in Milwaukee based on the number of properties managed and estimated total revenue over the past year. Analyze their scale and performance metrics.
| Host Name | Properties | Grossing Revenue | Stay Reviews | Avg Rating |
|---|---|---|---|---|
| Flexhome | 136 | $3,193,580 | 7239 | 4.70/5.0 |
| The Hosting Company | 36 | $1,785,959 | 3255 | 4.77/5.0 |
| Bradley | 11 | $1,097,814 | 1553 | 4.95/5.0 |
| Adam | 15 | $957,032 | 509 | 4.78/5.0 |
| Jake | 17 | $639,956 | 3642 | 4.80/5.0 |
| Lisa | 14 | $546,411 | 741 | 4.84/5.0 |
| Trina | 2 | $416,053 | 248 | 4.96/5.0 |
| Michael | 4 | $400,700 | 462 | 5.00/5.0 |
| Rebecca | 6 | $371,304 | 201 | 4.90/5.0 |
| Kayla & Mike | 7 | $332,618 | 280 | 4.97/5.0 |
Analyzing the strategies of top hosts, such as their property selection, pricing, and guest communication, can offer valuable lessons for optimizing your own Airbnb operations in Milwaukee.
Dive Deeper: Advanced Milwaukee STR Market Data (2026)
Ready to unlock more insights? AirROI provides access to advanced metrics and comprehensive Airbnb data for Milwaukee. Explore detailed analytics beyond this report to refine your investment strategy, optimize pricing, and maximize your vacation rental profits.
Explore Advanced MetricsMilwaukee Short-Term Rental Market Composition (2026): Property & Room Types
Room Type Distribution
Property Type Distribution
Market Composition Insights for Milwaukee
- The Milwaukee Airbnb market composition is heavily skewed towards Entire Home/Apt listings, which make up 88.8% of the 1,213 active rentals. This indicates strong guest preference for privacy and space.
- Looking at the property type distribution in Milwaukee, Apartment/Condo properties are the most common (48.6%), reflecting the local real estate landscape.
- Houses represent a significant 47.9% portion, catering likely to families or larger groups.
- Smaller segments like hotel/boutique, others, outdoor/unique (combined 3.6%) offer potential for unique stay experiences.
Milwaukee Airbnb Room Capacity Analysis (2026): Bedroom Distribution
Distribution of Listings by Number of Bedrooms
Room Capacity Insights for Milwaukee
- The dominant room capacity in Milwaukee is 2 bedrooms listings, making up 30.3% of the market. This suggests a strong demand for properties suitable for couples or solo travelers.
- Together, 2 bedrooms and 1 bedroom properties represent 55.5% of the active Airbnb listings in Milwaukee, indicating a high concentration in these sizes.
- A significant 31.6% of listings offer 3+ bedrooms, catering to larger groups and families seeking more space in Milwaukee.
Milwaukee Vacation Rental Guest Capacity Trends (2026)
Distribution of Listings by Guest Capacity
Guest Capacity Insights for Milwaukee
- The most common guest capacity trend in Milwaukee vacation rentals is listings accommodating 8+ guests (22.6%). This suggests the primary traveler segment is likely larger groups.
- Properties designed for 8+ guests and 4 guests dominate the Milwaukee STR market, accounting for 40.9% of listings.
- 39.7% of properties accommodate 6+ guests, serving the market segment for larger families or group travel in Milwaukee.
- On average, properties in Milwaukee are equipped to host 4.6 guests.
Milwaukee Airbnb Booking Patterns (2026): Available vs. Booked Days
Available Days Distribution
Booked Days Distribution
Booking Pattern Insights for Milwaukee
- The most common availability pattern in Milwaukee falls within the 271-366 days range, representing 38.5% of listings. This suggests many properties have significant open periods on their calendars.
- Approximately 75.8% of listings show high availability (181+ days open annually), indicating potential for increased bookings or specific owner usage patterns.
- For booked days, the 91-180 days range is most frequent in Milwaukee (37.3%), reflecting common guest stay durations or potential owner blocking patterns.
- A notable 25.7% of properties secure long booking periods (181+ days booked per year), highlighting successful long-term rental strategies or significant owner usage.
Milwaukee Airbnb Minimum Stay Requirements Analysis
Distribution of Listings by Minimum Night Requirement
1 Night
362 listings
29.8% of total
2 Nights
310 listings
25.6% of total
3 Nights
48 listings
4% of total
4-6 Nights
42 listings
3.5% of total
7-29 Nights
56 listings
4.6% of total
30+ Nights
395 listings
32.6% of total
Key Insights
- The most prevalent minimum stay requirement in Milwaukee is 30+ Nights, adopted by 32.6% of listings. This highlights the market's preference for longer commitments.
- A significant segment (32.6%) caters to monthly stays (30+ nights) in Milwaukee, pointing to opportunities in the extended-stay market.
Recommendations
- Align with the market by considering a 30+ Nights minimum stay, as 32.6% of Milwaukee hosts use this setting.
- If feasible, allowing 1-night stays, especially midweek or during low season, could capture last-minute bookings, as only 29.8% currently do.
- Explore offering discounts for stays of 30+ nights to attract the 32.6% of the market seeking extended stays.
- Adjust minimum nights based on seasonality – potentially shorter during low season and longer during peak demand periods in Milwaukee.
Milwaukee Airbnb Cancellation Policy Trends Analysis (2026)
Super Strict 30 Days
18 listings
1.5% of total
Super Strict 60 Days
11 listings
0.9% of total
Limited
12 listings
1% of total
Flexible
230 listings
19% of total
Moderate
450 listings
37.2% of total
Firm
346 listings
28.6% of total
Strict
144 listings
11.9% of total
Cancellation Policy Insights for Milwaukee
- The prevailing Airbnb cancellation policy trend in Milwaukee is Moderate, used by 37.2% of listings.
- There's a relatively balanced mix between guest-friendly (56.2%) and stricter (40.5%) policies, offering choices for different guest needs.
Recommendations for Hosts
- Consider adopting a Moderate policy to align with the 37.2% market standard in Milwaukee.
- Using a Strict policy might deter some guests, as only 11.9% of listings use it. Evaluate if potential revenue protection outweighs possible lower booking rates.
- Regularly review your cancellation policy against competitors and market demand shifts in Milwaukee.
Milwaukee STR Booking Lead Time Analysis (2026)
Average Booking Lead Time by Month
Booking Lead Time Insights for Milwaukee
- The overall average booking lead time for vacation rentals in Milwaukee is 41 days.
- Guests book furthest in advance for stays during July (average 64 days), likely coinciding with peak travel demand or local events.
- The shortest booking windows occur for stays in February (average 23 days), indicating more last-minute travel plans during this time.
- Seasonally, Summer (56 days avg.) sees the longest lead times, while Winter (27 days avg.) has the shortest, reflecting typical travel planning cycles.
Recommendations for Hosts
- Use the overall average lead time (41 days) as a baseline for your pricing and availability strategy in Milwaukee.
- For July stays, consider implementing length-of-stay discounts or slightly higher rates for bookings made less than 64 days out to capitalize on advance planning.
- Target marketing efforts for the Summer season well in advance (at least 56 days) to capture early planners.
- Monitor your own booking lead times against these Milwaukee averages to identify opportunities for dynamic pricing adjustments.
Popular & Essential Airbnb Amenities in Milwaukee (2026)
Amenity Prevalence
Amenity Insights for Milwaukee
- Essential amenities in Milwaukee that guests expect include: Smoke alarm, Wifi, Kitchen, Carbon monoxide alarm, Heating, TV, Air conditioning. Lacking these (any) could significantly impact bookings.
- Popular amenities like Hot water, Dishes and silverware, Refrigerator are common but not universal. Offering these can provide a competitive edge.
Recommendations for Hosts
- Ensure your listing includes all essential amenities for Milwaukee: Smoke alarm, Wifi, Kitchen, Carbon monoxide alarm, Heating, TV, Air conditioning.
- Prioritize adding missing essentials: Smoke alarm, Wifi, Kitchen, Carbon monoxide alarm, Heating, TV, Air conditioning.
- Consider adding popular differentiators like Hot water or Dishes and silverware to increase appeal.
- Highlight unique or less common amenities you offer (e.g., hot tub, dedicated workspace, EV charger) in your listing description and photos.
- Regularly check competitor amenities in Milwaukee to stay competitive.
Milwaukee Airbnb Guest Demographics & Profile Analysis (2026)
Guest Profile Summary for Milwaukee
- The typical guest profile for Airbnb in Milwaukee consists of primarily domestic travelers (96%), often arriving from nearby Chicago, typically belonging to the Post-2000s (Gen Z/Alpha) group (50%), primarily speaking English or Spanish.
- Domestic travelers account for 95.7% of guests.
- Key international markets include United States (95.7%) and Canada (0.8%).
- Top languages spoken are English (70.7%) followed by Spanish (13.8%).
- A significant demographic segment is the Post-2000s (Gen Z/Alpha) group, representing 50% of guests.
Recommendations for Hosts
- Target domestic marketing efforts towards travelers from Chicago and Milwaukee.
- Tailor amenities and listing descriptions to appeal to the dominant Post-2000s (Gen Z/Alpha) demographic (e.g., highlight fast WiFi, smart home features, local guides).
- Highlight unique local experiences or amenities relevant to the primary guest profile.
- Consider seasonal promotions aligned with peak travel times for key origin markets.
Nearby Short-Term Rental Market Comparison
How does the Milwaukee Airbnb market stack up against its neighbors? Compare key performance metrics like average monthly revenue, ADR, and occupancy rates in surrounding areas to understand the broader regional STR landscape.
| Market | Active Properties | Monthly Revenue | Daily Rate | Avg. Occupancy |
|---|---|---|---|---|
| Town of Sugar Creek | 18 | $9,830 | $662.90 | 53% |
| Town of Newton | 11 | $6,557 | $770.72 | 42% |
| Town of Wilson | 16 | $6,450 | $620.70 | 43% |
| Twin Lakes | 35 | $6,152 | $547.54 | 43% |
| Laketown Township | 59 | $6,112 | $529.59 | 44% |
| Port Sheldon Township | 26 | $6,015 | $566.98 | 47% |
| Ganges Township | 69 | $5,687 | $636.25 | 38% |
| Town of Jacksonport | 13 | $5,677 | $517.68 | 44% |
| Saugatuck Township | 141 | $5,627 | $508.58 | 43% |
| Lake Geneva | 209 | $5,014 | $473.36 | 41% |