Lake Delton Airbnb Market Analysis 2026: Short Term Rental Data & Vacation Rental Statistics in Wisconsin, United States
Is Airbnb profitable in Lake Delton in 2026? Explore comprehensive Airbnb analytics for Lake Delton, Wisconsin, United States to uncover income potential. This 2026 STR market report for Lake Delton, based on AirROI data from February 2025 to January 2026, reveals key trends in the market of 325 active listings.
Whether you're considering an Airbnb investment in Lake Delton, optimizing your existing vacation rental, or exploring rental arbitrage opportunities, understanding the Lake Delton Airbnb data is crucial. Leveraging the low regulation environment is key to maximizing your short term rental income potential. Let's dive into the specifics.
Key Lake Delton Airbnb Performance Metrics Overview
Monthly Airbnb Revenue Variations & Income Potential in Lake Delton (2026)
Understanding the monthly revenue variations for Airbnb listings in Lake Delton is key to maximizing your short term rental income potential. Seasonality significantly impacts earnings. Our analysis, based on data from the past 12 months, shows that the peak revenue month for STRs in Lake Delton is typically July, while February often presents the lowest earnings, highlighting opportunities for strategic pricing adjustments during shoulder and low seasons. Explore the typical Airbnb income in Lake Delton across different performance tiers:
- Best-in-class properties (Top 10%) achieve $8,287+ monthly, often utilizing dynamic pricing and superior guest experiences.
- Strong performing properties (Top 25%) earn $5,417 or more, indicating effective management and desirable locations/amenities.
- Typical properties (Median) generate around $3,182 per month, representing the average market performance.
- Entry-level properties (Bottom 25%) see earnings around $1,410, often with potential for optimization.
Average Monthly Airbnb Earnings Trend in Lake Delton
Lake Delton Airbnb Occupancy Rate Trends (2026)
Maximize your bookings by understanding the Lake Delton STR occupancy trends. Seasonal demand shifts significantly influence how often properties are booked. Typically, Julysees the highest demand (peak season occupancy), while January experiences the lowest (low season). Effective strategies, like adjusting minimum stays or offering promotions, can boost occupancy during slower periods. Here's how different property tiers perform in Lake Delton:
- Best-in-class properties (Top 10%) achieve 66%+ occupancy, indicating high desirability and potentially optimized availability.
- Strong performing properties (Top 25%) maintain 49% or higher occupancy, suggesting good market fit and guest satisfaction.
- Typical properties (Median) have an occupancy rate around 31%.
- Entry-level properties (Bottom 25%) average 14% occupancy, potentially facing higher vacancy.
Average Monthly Occupancy Rate Trend in Lake Delton
Average Daily Rate (ADR) Airbnb Trends in Lake Delton (2026)
Effective short term rental pricing strategy in Lake Delton involves understanding monthly ADR fluctuations. The Average Daily Rate (ADR) for Airbnb in Lake Delton typically peaks in July and dips lowest during February. Leveraging Airbnb dynamic pricing tools or strategies based on this seasonality can significantly boost revenue. Here's a look at the typical nightly rates achieved:
- Best-in-class properties (Top 10%) command rates of $699+ per night, often due to premium features or locations.
- Strong performing properties (Top 25%) achieve nightly rates of $435 or more.
- Typical properties (Median) charge around $280 per night.
- Entry-level properties (Bottom 25%) earn around $197 per night.
Average Daily Rate (ADR) Trend by Month in Lake Delton
Get Live Lake Delton Market Intelligence 👇

Explore Real-time Analytics
Airbnb Seasonality Analysis & Trends in Lake Delton (2026)
Peak Season (July, August, June)
- Revenue averages $6,906 per month
- Occupancy rates average 50.3%
- Daily rates average $396
Shoulder Season
- Revenue averages $3,210 per month
- Occupancy maintains around 29.0%
- Daily rates hold near $353
Low Season (February, April, November)
- Revenue drops to average $2,482 per month
- Occupancy decreases to average 27.8%
- Daily rates adjust to average $327
Seasonality Insights for Lake Delton
- The Airbnb seasonality in Lake Delton shows highly seasonal trends requiring careful strategy. While the sections above show seasonal averages, it's also insightful to look at the extremes:
- During the high season, the absolute peak month showcases Lake Delton's highest earning potential, with monthly revenues capable of climbing to $8,621, occupancy reaching a high of 58.9%, and ADRs peaking at $411.
- Conversely, the slowest single month of the year, typically falling within the low season, marks the market's lowest point. In this month, revenue might dip to $2,244, occupancy could drop to 23.4%, and ADRs may adjust down to $311.
- Understanding both the seasonal averages and these monthly peaks and troughs in revenue, occupancy, and ADR is crucial for maximizing your Airbnb profit potential in Lake Delton.
Seasonal Strategies for Maximizing Profit
- Peak Season: Maximize revenue through premium pricing and potentially longer minimum stays. Ensure high availability.
- Low Season: Offer competitive pricing, special promotions (e.g., extended stay discounts), and flexible cancellation policies. Target off-season travelers like remote workers or budget-conscious guests.
- Shoulder Seasons: Implement dynamic pricing that balances peak and low rates. Target weekend travelers or specific events. Offer slightly more flexible terms than peak season.
- Regularly analyze your own performance against these Lake Delton seasonality benchmarks and adjust your pricing and availability strategy accordingly.
Best Areas for Airbnb Investment in Lake Delton (2026)
Exploring the top neighborhoods for short-term rentals in Lake Delton? This section highlights key areas, outlining why they are attractive for hosts and guests, along with notable local attractions. Consider these locations based on your target guest profile and investment strategy.
| Neighborhood / Area | Why Host Here? (Target Guests & Appeal) | Key Attractions & Landmarks |
|---|---|---|
| Lake Delton | A popular destination known for its beautiful lakes and recreational activities. Ideal for families and holidaymakers seeking outdoor adventures and relaxation. | Wisconsin Dells, Dell Creek, Lake Delton Waterpark, Kalahari Resort, Indoor Waterparks, Mini Golf Courses |
| Wisconsin Dells | Famous for its water parks and entertaining attractions, this area draws tourists year-round for family fun and adventure. | Noah's Ark Waterpark, Mount Olympus, The Dells Boat Tours, Ripley's Believe It or Not!, Wizard Quest, Dells Mining Co. |
| Devil's Lake State Park | A stunning natural park with hiking, swimming, and scenic views, ideal for nature lovers and outdoor enthusiasts. | Devil's Lake, Hiking Trails, Swimming Beaches, Picnic Areas, Rock Climbing, Wildlife Viewing |
| Baraboo | A quaint town with a rich circus history and cultural attractions, close to key points of interest and outdoor activities. | Circus World, Devil's Lake, Al. Ringling Theatre, Baraboo Arts and Crafts Fair, Historic downtown |
| Spring Green | Known for its beautiful landscapes and cultural sites, including the Frank Lloyd Wright home, attracting visitors interested in arts and nature. | Taliesin, Frank Lloyd Wright Visitor Center, American Players Theatre, Wisconsin River, Spring Green Preserve |
| Reedsburg | A charming small town offering local shops, outdoor recreation, and proximity to various recreational activities in the area. | Reedsburg History Museum, Trails for biking and hiking, Nearby state parks, Local festivals, Cultural events |
| Portage | A historic city at the confluence of the Fox and Wisconsin Rivers with a vibrant community and access to outdoor activities. | Historic Downtown, Portage Canal, Parks and Recreation Areas, Public Arts, Nearby walking trails |
| Lake Redstone | A serene lake community perfect for fishing, boating, and relaxing getaways, catering to visitors seeking tranquility and nature. | Fishing and Boating, Lakefront picnics, Camping Sites, Nature Trails, Wildlife |
Understanding Airbnb License Requirements & STR Laws in Lake Delton (2026)
While Lake Delton, Wisconsin, United States currently shows low STR regulations, specific Airbnb license requirements might still exist or change. Always verify the latest short term rental regulations and Airbnb license requirements directly with local government authorities for Lake Delton to ensure full compliance before hosting.
(Source: AirROI data, 2026, based on 0% licensed listings)
Top Performing Airbnb Properties in Lake Delton (2026)
Benchmark your potential! Explore examples of top-performing Airbnb properties in Lake Deltonbased on Trailing Twelve Month (TTM) revenue. Analyze their characteristics, revenue, occupancy rate, and ADR to understand what drives success in this market.

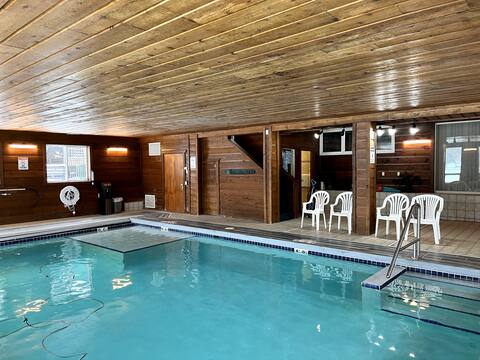
19 ppl | Sauna. Theater. Games. SpeakEasy
Entire Place • 6 bedrooms

16 ppl | Sauna. Theater. Games. Spa bath & more
Entire Place • 6 bedrooms
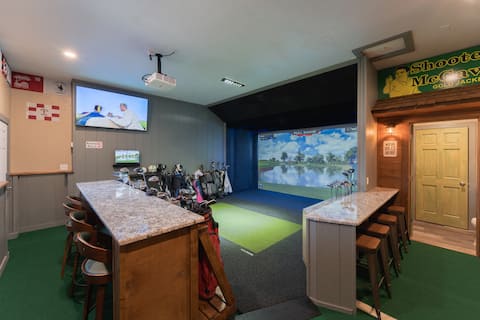
First Class FORE-Golf Simulator- Putting Green
Entire Place • 6 bedrooms

Hines Inn - Heart of the Dells!
Entire Place • 5 bedrooms

Red Oak Lodge @ Spring Brook Resort
Entire Place • 6 bedrooms
All Inclusive Getaway
Entire Place • 5 bedrooms
Note: Performance varies based on location, size, amenities, seasonality, and management quality. Data reflects the past 12 months.
Top Performing Airbnb Hosts in Lake Delton (2026)
Learn from the best! This table showcases top-performing Airbnb hosts in Lake Delton based on the number of properties managed and estimated total revenue over the past year. Analyze their scale and performance metrics.
| Host Name | Properties | Grossing Revenue | Stay Reviews | Avg Rating |
|---|---|---|---|---|
| Spring Brook Resort | 105 | $3,853,969 | 1565 | 4.71/5.0 |
| Destination Dells | 42 | $2,256,151 | 3693 | 4.90/5.0 |
| Jeremy | 3 | $483,840 | 800 | 4.94/5.0 |
| Kyla | 4 | $428,454 | 326 | 4.89/5.0 |
| Sand County Service Company | 11 | $352,515 | 244 | 4.57/5.0 |
| Chad | 5 | $344,475 | 273 | 4.91/5.0 |
| Anna | 6 | $336,194 | 455 | 4.92/5.0 |
| Resort | 5 | $316,055 | 1396 | 4.85/5.0 |
| Dellsvacations Club | 6 | $231,436 | 411 | 4.86/5.0 |
| Clement | 12 | $170,025 | 91 | 4.25/5.0 |
Analyzing the strategies of top hosts, such as their property selection, pricing, and guest communication, can offer valuable lessons for optimizing your own Airbnb operations in Lake Delton.
Dive Deeper: Advanced Lake Delton STR Market Data (2026)
Ready to unlock more insights? AirROI provides access to advanced metrics and comprehensive Airbnb data for Lake Delton. Explore detailed analytics beyond this report to refine your investment strategy, optimize pricing, and maximize your vacation rental profits.
Explore Advanced MetricsLake Delton Short-Term Rental Market Composition (2026): Property & Room Types
Room Type Distribution
Property Type Distribution
Market Composition Insights for Lake Delton
- The Lake Delton Airbnb market composition is heavily skewed towards Entire Home/Apt listings, which make up 86.2% of the 325 active rentals. This indicates strong guest preference for privacy and space.
- Looking at the property type distribution in Lake Delton, Apartment/Condo properties are the most common (44.9%), reflecting the local real estate landscape.
- Houses represent a significant 36.3% portion, catering likely to families or larger groups.
- The presence of 13.8% Hotel/Boutique listings indicates integration with traditional hospitality.
- Smaller segments like outdoor/unique, others, unique stays (combined 4.9%) offer potential for unique stay experiences.
Lake Delton Airbnb Room Capacity Analysis (2026): Bedroom Distribution
Distribution of Listings by Number of Bedrooms
Room Capacity Insights for Lake Delton
- The dominant room capacity in Lake Delton is 2 bedrooms listings, making up 32.9% of the market. This suggests a strong demand for properties suitable for couples or solo travelers.
- Together, 2 bedrooms and 1 bedroom properties represent 53.5% of the active Airbnb listings in Lake Delton, indicating a high concentration in these sizes.
- A significant 43.4% of listings offer 3+ bedrooms, catering to larger groups and families seeking more space in Lake Delton.
Lake Delton Vacation Rental Guest Capacity Trends (2026)
Distribution of Listings by Guest Capacity
Guest Capacity Insights for Lake Delton
- The most common guest capacity trend in Lake Delton vacation rentals is listings accommodating 8+ guests (53.8%). This suggests the primary traveler segment is likely larger groups.
- Properties designed for 8+ guests and 6 guests dominate the Lake Delton STR market, accounting for 77.5% of listings.
- 77.8% of properties accommodate 6+ guests, serving the market segment for larger families or group travel in Lake Delton.
- On average, properties in Lake Delton are equipped to host 6.6 guests.
Lake Delton Airbnb Booking Patterns (2026): Available vs. Booked Days
Available Days Distribution
Booked Days Distribution
Booking Pattern Insights for Lake Delton
- The most common availability pattern in Lake Delton falls within the 271-366 days range, representing 62.2% of listings. This suggests many properties have significant open periods on their calendars.
- Approximately 86.8% of listings show high availability (181+ days open annually), indicating potential for increased bookings or specific owner usage patterns.
- For booked days, the 31-90 days range is most frequent in Lake Delton (40.3%), reflecting common guest stay durations or potential owner blocking patterns.
- A notable 14.7% of properties secure long booking periods (181+ days booked per year), highlighting successful long-term rental strategies or significant owner usage.
Lake Delton Airbnb Minimum Stay Requirements Analysis
Distribution of Listings by Minimum Night Requirement
1 Night
60 listings
18.5% of total
2 Nights
69 listings
21.2% of total
3 Nights
2 listings
0.6% of total
4-6 Nights
2 listings
0.6% of total
7-29 Nights
3 listings
0.9% of total
30+ Nights
189 listings
58.2% of total
Key Insights
- The most prevalent minimum stay requirement in Lake Delton is 30+ Nights, adopted by 58.2% of listings. This highlights the market's preference for longer commitments.
- A significant segment (58.2%) caters to monthly stays (30+ nights) in Lake Delton, pointing to opportunities in the extended-stay market.
Recommendations
- Align with the market by considering a 30+ Nights minimum stay, as 58.2% of Lake Delton hosts use this setting.
- If feasible, allowing 1-night stays, especially midweek or during low season, could capture last-minute bookings, as only 18.5% currently do.
- Explore offering discounts for stays of 30+ nights to attract the 58.2% of the market seeking extended stays.
- Adjust minimum nights based on seasonality – potentially shorter during low season and longer during peak demand periods in Lake Delton.
Lake Delton Airbnb Cancellation Policy Trends Analysis (2026)
Limited
43 listings
13.2% of total
Super Strict 30 Days
23 listings
7.1% of total
Flexible
17 listings
5.2% of total
Moderate
27 listings
8.3% of total
Firm
165 listings
50.8% of total
Strict
50 listings
15.4% of total
Cancellation Policy Insights for Lake Delton
- The prevailing Airbnb cancellation policy trend in Lake Delton is Firm, used by 50.8% of listings.
- A majority (66.2%) of hosts in Lake Delton utilize Firm or Strict policies, indicating a market where hosts prioritize booking security.
Recommendations for Hosts
- Consider adopting a Firm policy to align with the 50.8% market standard in Lake Delton.
- Regularly review your cancellation policy against competitors and market demand shifts in Lake Delton.
Lake Delton STR Booking Lead Time Analysis (2026)
Average Booking Lead Time by Month
Booking Lead Time Insights for Lake Delton
- The overall average booking lead time for vacation rentals in Lake Delton is 66 days.
- Guests book furthest in advance for stays during July (average 102 days), likely coinciding with peak travel demand or local events.
- The shortest booking windows occur for stays in March (average 35 days), indicating more last-minute travel plans during this time.
- Seasonally, Summer (92 days avg.) sees the longest lead times, while Winter (43 days avg.) has the shortest, reflecting typical travel planning cycles.
Recommendations for Hosts
- Use the overall average lead time (66 days) as a baseline for your pricing and availability strategy in Lake Delton.
- For July stays, consider implementing length-of-stay discounts or slightly higher rates for bookings made less than 102 days out to capitalize on advance planning.
- Target marketing efforts for the Summer season well in advance (at least 92 days) to capture early planners.
- Monitor your own booking lead times against these Lake Delton averages to identify opportunities for dynamic pricing adjustments.
Popular & Essential Airbnb Amenities in Lake Delton (2026)
Amenity Prevalence
Amenity Insights for Lake Delton
- Essential amenities in Lake Delton that guests expect include: Wifi, Smoke alarm, TV, Free parking on premises, Air conditioning, Heating, Carbon monoxide alarm. Lacking these (any) could significantly impact bookings.
- Popular amenities like Kitchen, Microwave, Coffee maker are common but not universal. Offering these can provide a competitive edge.
Recommendations for Hosts
- Ensure your listing includes all essential amenities for Lake Delton: Wifi, Smoke alarm, TV, Free parking on premises, Air conditioning, Heating, Carbon monoxide alarm.
- Prioritize adding missing essentials: Smoke alarm, TV, Free parking on premises, Air conditioning, Heating, Carbon monoxide alarm.
- Consider adding popular differentiators like Kitchen or Microwave to increase appeal.
- Highlight unique or less common amenities you offer (e.g., hot tub, dedicated workspace, EV charger) in your listing description and photos.
- Regularly check competitor amenities in Lake Delton to stay competitive.
Lake Delton Airbnb Guest Demographics & Profile Analysis (2026)
Guest Profile Summary for Lake Delton
- The typical guest profile for Airbnb in Lake Delton consists of primarily domestic travelers (99%), often arriving from nearby Chicago, typically belonging to the Post-2000s (Gen Z/Alpha) group (50%), primarily speaking English or Spanish.
- Domestic travelers account for 98.7% of guests.
- Key international markets include United States (98.7%) and Mexico (0.3%).
- Top languages spoken are English (72.8%) followed by Spanish (16.3%).
- A significant demographic segment is the Post-2000s (Gen Z/Alpha) group, representing 50% of guests.
Recommendations for Hosts
- Target domestic marketing efforts towards travelers from Chicago and Milwaukee.
- Tailor amenities and listing descriptions to appeal to the dominant Post-2000s (Gen Z/Alpha) demographic (e.g., highlight fast WiFi, smart home features, local guides).
- Highlight unique local experiences or amenities relevant to the primary guest profile.
- Consider seasonal promotions aligned with peak travel times for key origin markets.
Nearby Short-Term Rental Market Comparison
How does the Lake Delton Airbnb market stack up against its neighbors? Compare key performance metrics like average monthly revenue, ADR, and occupancy rates in surrounding areas to understand the broader regional STR landscape.
| Market | Active Properties | Monthly Revenue | Daily Rate | Avg. Occupancy |
|---|---|---|---|---|
| Town of Sugar Creek | 18 | $9,830 | $662.90 | 53% |
| Monona | 29 | $6,957 | $648.65 | 49% |
| Town of Newton | 11 | $6,557 | $770.72 | 42% |
| Town of Wilson | 16 | $6,450 | $620.70 | 43% |
| Twin Lakes | 35 | $6,152 | $547.54 | 43% |
| Town of Germantown | 66 | $5,208 | $527.82 | 37% |
| Lake Geneva | 209 | $5,014 | $473.36 | 41% |
| Town of Geneva | 63 | $5,012 | $448.89 | 43% |
| McHenry | 32 | $4,982 | $463.12 | 44% |
| Suamico | 13 | $4,905 | $473.88 | 44% |