Ellison Bay Airbnb Market Analysis 2026: Short Term Rental Data & Vacation Rental Statistics in Wisconsin, United States
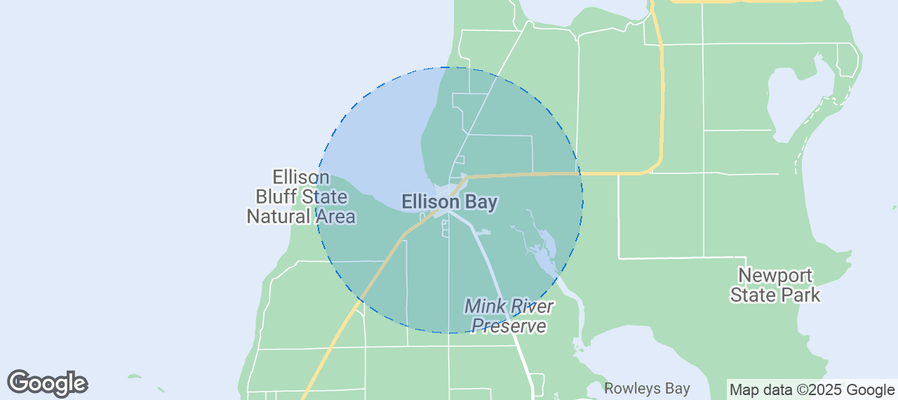
Is Airbnb profitable in Ellison Bay in 2026? Explore comprehensive Airbnb analytics for Ellison Bay, Wisconsin, United States to uncover income potential. This 2026 STR market report for Ellison Bay, based on AirROI data from February 2025 to January 2026, reveals key trends in the niche market of 23 active listings.
Whether you're considering an Airbnb investment in Ellison Bay, optimizing your existing vacation rental, or exploring rental arbitrage opportunities, understanding the Ellison Bay Airbnb data is crucial. Leveraging the low regulation environment is key to maximizing your short term rental income potential. Let's dive into the specifics.
Key Ellison Bay Airbnb Performance Metrics Overview
Monthly Airbnb Revenue Variations & Income Potential in Ellison Bay (2026)
Understanding the monthly revenue variations for Airbnb listings in Ellison Bay is key to maximizing your short term rental income potential. Seasonality significantly impacts earnings. Our analysis, based on data from the past 12 months, shows that the peak revenue month for STRs in Ellison Bay is typically July, while April often presents the lowest earnings, highlighting opportunities for strategic pricing adjustments during shoulder and low seasons. Explore the typical Airbnb income in Ellison Bay across different performance tiers:
- Best-in-class properties (Top 10%) achieve $10,890+ monthly, often utilizing dynamic pricing and superior guest experiences.
- Strong performing properties (Top 25%) earn $7,099 or more, indicating effective management and desirable locations/amenities.
- Typical properties (Median) generate around $4,665 per month, representing the average market performance.
- Entry-level properties (Bottom 25%) see earnings around $2,292, often with potential for optimization.
Average Monthly Airbnb Earnings Trend in Ellison Bay
Ellison Bay Airbnb Occupancy Rate Trends (2026)
Maximize your bookings by understanding the Ellison Bay STR occupancy trends. Seasonal demand shifts significantly influence how often properties are booked. Typically, Julysees the highest demand (peak season occupancy), while April experiences the lowest (low season). Effective strategies, like adjusting minimum stays or offering promotions, can boost occupancy during slower periods. Here's how different property tiers perform in Ellison Bay:
- Best-in-class properties (Top 10%) achieve 71%+ occupancy, indicating high desirability and potentially optimized availability.
- Strong performing properties (Top 25%) maintain 61% or higher occupancy, suggesting good market fit and guest satisfaction.
- Typical properties (Median) have an occupancy rate around 41%.
- Entry-level properties (Bottom 25%) average 24% occupancy, potentially facing higher vacancy.
Average Monthly Occupancy Rate Trend in Ellison Bay
Average Daily Rate (ADR) Airbnb Trends in Ellison Bay (2026)
Effective short term rental pricing strategy in Ellison Bay involves understanding monthly ADR fluctuations. The Average Daily Rate (ADR) for Airbnb in Ellison Bay typically peaks in July and dips lowest during February. Leveraging Airbnb dynamic pricing tools or strategies based on this seasonality can significantly boost revenue. Here's a look at the typical nightly rates achieved:
- Best-in-class properties (Top 10%) command rates of $593+ per night, often due to premium features or locations.
- Strong performing properties (Top 25%) achieve nightly rates of $484 or more.
- Typical properties (Median) charge around $325 per night.
- Entry-level properties (Bottom 25%) earn around $229 per night.
Average Daily Rate (ADR) Trend by Month in Ellison Bay
Get Live Ellison Bay Market Intelligence 👇
Explore Real-time Analytics
Airbnb Seasonality Analysis & Trends in Ellison Bay (2026)
Peak Season (July, August, June)
- Revenue averages $8,705 per month
- Occupancy rates average 56.9%
- Daily rates average $427
Shoulder Season
- Revenue averages $4,953 per month
- Occupancy maintains around 42.5%
- Daily rates hold near $369
Low Season (February, April, December)
- Revenue drops to average $2,986 per month
- Occupancy decreases to average 31.5%
- Daily rates adjust to average $346
Seasonality Insights for Ellison Bay
- The Airbnb seasonality in Ellison Bay shows highly seasonal trends requiring careful strategy. While the sections above show seasonal averages, it's also insightful to look at the extremes:
- During the high season, the absolute peak month showcases Ellison Bay's highest earning potential, with monthly revenues capable of climbing to $10,103, occupancy reaching a high of 64.2%, and ADRs peaking at $439.
- Conversely, the slowest single month of the year, typically falling within the low season, marks the market's lowest point. In this month, revenue might dip to $2,342, occupancy could drop to 25.6%, and ADRs may adjust down to $314.
- Understanding both the seasonal averages and these monthly peaks and troughs in revenue, occupancy, and ADR is crucial for maximizing your Airbnb profit potential in Ellison Bay.
Seasonal Strategies for Maximizing Profit
- Peak Season: Maximize revenue through premium pricing and potentially longer minimum stays. Ensure high availability.
- Low Season: Offer competitive pricing, special promotions (e.g., extended stay discounts), and flexible cancellation policies. Target off-season travelers like remote workers or budget-conscious guests.
- Shoulder Seasons: Implement dynamic pricing that balances peak and low rates. Target weekend travelers or specific events. Offer slightly more flexible terms than peak season.
- Regularly analyze your own performance against these Ellison Bay seasonality benchmarks and adjust your pricing and availability strategy accordingly.
Best Areas for Airbnb Investment in Ellison Bay (2026)
Exploring the top neighborhoods for short-term rentals in Ellison Bay? This section highlights key areas, outlining why they are attractive for hosts and guests, along with notable local attractions. Consider these locations based on your target guest profile and investment strategy.
| Neighborhood / Area | Why Host Here? (Target Guests & Appeal) | Key Attractions & Landmarks |
|---|---|---|
| Ellison Bay Waterfront | Beautiful waterfront area ideal for relaxation and outdoor activities. Close to natural attractions and scenic views, making it perfect for vacationers. | Ellison Bay Marina, Newport State Park, Door Bluff Headlands Park, Sailing and boating, Fishing and kayaking |
| Sister Bay | Neighboring Sister Bay is known for its family-friendly atmosphere and various events. A popular spot for tourists looking for a vibrant community feel and easy access to amenities. | Sister Bay Beach, Waterfront Park, Gills Rock, Shopping and dining, Live music events |
| Hatchery Park Area | Nestled close to Hatchery Park, this area offers nature trails and recreational activities. It appeals to those who enjoy outdoor adventures while being close to the village. | Hatchery Park trails, Wildlife viewing, Picnic areas, Access to biking trails |
| Bayview Lane | A quiet, charming area that offers tranquility and views of the bay. It's attractive for guests seeking a peaceful retreat with easy access to local attractions. | Bayview Park, Scenic views, Local shops, Fishing spots |
| The Orchard | This area is known for its orchards and farms, perfect for tourists wanting to experience local produce and the natural beauty of Door County. | Apple picking, Farmers markets, Cycling routes, Seasonal festivals |
| Ellison Bay Village Center | The center of the village with shops, restaurants, and cultural activities. Great for tourists wanting to immerse themselves in local life and conveniences. | Dining options, Local art galleries, Shops and boutiques, Cultural events |
| Northport | A quaint area known for its ferry access to Washington Island. Appeals to adventurous visitors looking to explore the surrounding islands. | Northport Ferry, Island exploration, Scenic views, Quiet beaches |
| Cave Point County Park | Known for its natural beauty and stunning views of the water, it's a favorite among nature lovers and those looking for outdoor activities. | Cave Point trails, Cliff views, Swimming spots, Snorkeling areas |
Understanding Airbnb License Requirements & STR Laws in Ellison Bay (2026)
While Ellison Bay, Wisconsin, United States currently shows low STR regulations, specific Airbnb license requirements might still exist or change. Always verify the latest short term rental regulations and Airbnb license requirements directly with local government authorities for Ellison Bay to ensure full compliance before hosting.
(Source: AirROI data, 2026, finding no licensed listings among those analyzed)
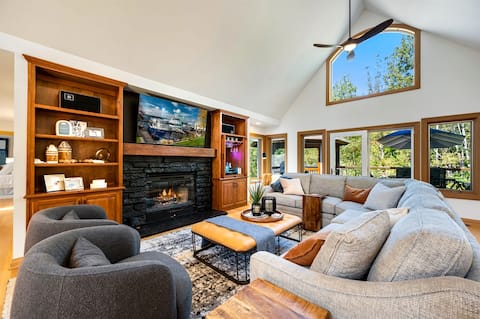
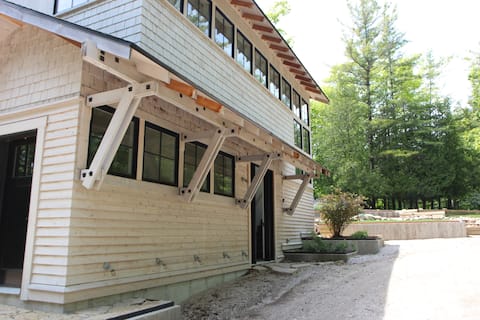
Top Performing Airbnb Properties in Ellison Bay (2026)
Benchmark your potential! Explore examples of top-performing Airbnb properties in Ellison Baybased on Trailing Twelve Month (TTM) revenue. Analyze their characteristics, revenue, occupancy rate, and ADR to understand what drives success in this market.

Ellison Bay Family Retreat! 8 bed/6 bath/20 acres
Entire Place • 8 bedrooms

Insta-worthy Waterfront Cottage with Hot Tub
Entire Place • 3 bedrooms
Birch Grove: 4 Bed, 3 Bath, Large Deck on 5 Acres
Entire Place • 4 bedrooms
Ellison Bay Eclectic Style Cottage
Entire Place • 3 bedrooms
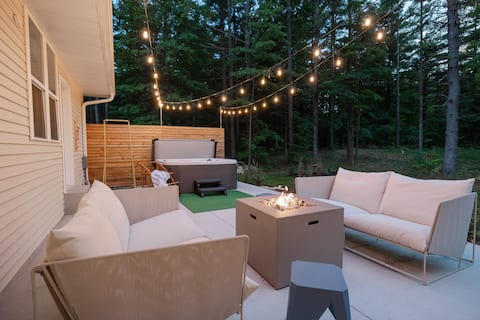
Wooded Retreat-Hot Tub-Fireplace Near Sister Bay
Entire Place • 3 bedrooms
Gigi's Place…. Wooded Waterfront sleeps 13
Entire Place • 4 bedrooms
Note: Performance varies based on location, size, amenities, seasonality, and management quality. Data reflects the past 12 months.
Top Performing Airbnb Hosts in Ellison Bay (2026)
Learn from the best! This table showcases top-performing Airbnb hosts in Ellison Bay based on the number of properties managed and estimated total revenue over the past year. Analyze their scale and performance metrics.
| Host Name | Properties | Grossing Revenue | Stay Reviews | Avg Rating |
|---|---|---|---|---|
| Tim | 2 | $250,356 | 441 | 4.84/5.0 |
| Kayla & Mike | 1 | $138,022 | 80 | 4.96/5.0 |
| Birch Grove | 1 | $85,943 | 7 | 5.00/5.0 |
| Nate And Laura | 1 | $77,910 | 57 | 4.96/5.0 |
| Gail | 1 | $64,530 | 8 | 5.00/5.0 |
| Emily | 1 | $60,997 | 47 | 4.98/5.0 |
| RentDoorCounty | 2 | $59,989 | 113 | 4.73/5.0 |
| Kate | 1 | $51,687 | 57 | 4.77/5.0 |
| Gregg | 1 | $50,443 | 63 | 5.00/5.0 |
| Lundquist Realty And Vacation | 1 | $45,039 | 2 | Not Rated |
Analyzing the strategies of top hosts, such as their property selection, pricing, and guest communication, can offer valuable lessons for optimizing your own Airbnb operations in Ellison Bay.
Dive Deeper: Advanced Ellison Bay STR Market Data (2026)
Ready to unlock more insights? AirROI provides access to advanced metrics and comprehensive Airbnb data for Ellison Bay. Explore detailed analytics beyond this report to refine your investment strategy, optimize pricing, and maximize your vacation rental profits.
Explore Advanced MetricsEllison Bay Short-Term Rental Market Composition (2026): Property & Room Types
Room Type Distribution
Property Type Distribution
Market Composition Insights for Ellison Bay
- The Ellison Bay Airbnb market composition is heavily skewed towards Entire Home/Apt listings, which make up 91.3% of the 23 active rentals. This indicates strong guest preference for privacy and space.
- Looking at the property type distribution in Ellison Bay, House properties are the most common (78.3%), reflecting the local real estate landscape.
- Houses represent a significant 78.3% portion, catering likely to families or larger groups.
- The presence of 8.7% Hotel/Boutique listings indicates integration with traditional hospitality.
- Smaller segments like apartment/condo (combined 4.3%) offer potential for unique stay experiences.
Ellison Bay Airbnb Room Capacity Analysis (2026): Bedroom Distribution
Distribution of Listings by Number of Bedrooms
Room Capacity Insights for Ellison Bay
- The dominant room capacity in Ellison Bay is 3 bedrooms listings, making up 39.1% of the market. This suggests a strong demand for properties suitable for families or small groups.
- Together, 3 bedrooms and 2 bedrooms properties represent 69.5% of the active Airbnb listings in Ellison Bay, indicating a high concentration in these sizes.
- A significant 56.4% of listings offer 3+ bedrooms, catering to larger groups and families seeking more space in Ellison Bay.
Ellison Bay Vacation Rental Guest Capacity Trends (2026)
Distribution of Listings by Guest Capacity
Guest Capacity Insights for Ellison Bay
- The most common guest capacity trend in Ellison Bay vacation rentals is listings accommodating 6 guests (43.5%). This suggests the primary traveler segment is likely larger groups.
- Properties designed for 6 guests and 8+ guests dominate the Ellison Bay STR market, accounting for 69.6% of listings.
- 69.6% of properties accommodate 6+ guests, serving the market segment for larger families or group travel in Ellison Bay.
- On average, properties in Ellison Bay are equipped to host 5.7 guests.
Ellison Bay Airbnb Booking Patterns (2026): Available vs. Booked Days
Available Days Distribution
Booked Days Distribution
Booking Pattern Insights for Ellison Bay
- The most common availability pattern in Ellison Bay falls within the 181-270 days range, representing 47.8% of listings. This suggests many properties have significant open periods on their calendars.
- Approximately 86.9% of listings show high availability (181+ days open annually), indicating potential for increased bookings or specific owner usage patterns.
- For booked days, the 91-180 days range is most frequent in Ellison Bay (47.8%), reflecting common guest stay durations or potential owner blocking patterns.
- A notable 13.0% of properties secure long booking periods (181+ days booked per year), highlighting successful long-term rental strategies or significant owner usage.
Ellison Bay Airbnb Minimum Stay Requirements Analysis
Distribution of Listings by Minimum Night Requirement
2 Nights
4 listings
17.4% of total
3 Nights
2 listings
8.7% of total
4-6 Nights
3 listings
13% of total
30+ Nights
14 listings
60.9% of total
Key Insights
- The most prevalent minimum stay requirement in Ellison Bay is 30+ Nights, adopted by 60.9% of listings. This highlights the market's preference for longer commitments.
- Very short stays (1-2 nights) are less common (17.4%), suggesting hosts prefer slightly longer bookings to optimize turnover.
- A significant segment (60.9%) caters to monthly stays (30+ nights) in Ellison Bay, pointing to opportunities in the extended-stay market.
Recommendations
- Align with the market by considering a 30+ Nights minimum stay, as 60.9% of Ellison Bay hosts use this setting.
- Explore offering discounts for stays of 30+ nights to attract the 60.9% of the market seeking extended stays.
- Adjust minimum nights based on seasonality – potentially shorter during low season and longer during peak demand periods in Ellison Bay.
Ellison Bay Airbnb Cancellation Policy Trends Analysis (2026)
Limited
1 listings
4.3% of total
Super Strict 30 Days
1 listings
4.3% of total
Super Strict 60 Days
1 listings
4.3% of total
Flexible
3 listings
13% of total
Moderate
3 listings
13% of total
Firm
12 listings
52.2% of total
Strict
2 listings
8.7% of total
Cancellation Policy Insights for Ellison Bay
- The prevailing Airbnb cancellation policy trend in Ellison Bay is Firm, used by 52.2% of listings.
- A majority (60.9%) of hosts in Ellison Bay utilize Firm or Strict policies, indicating a market where hosts prioritize booking security.
- Strict cancellation policies are quite rare (8.7%), potentially making listings with this policy less competitive unless justified by high demand or property type.
Recommendations for Hosts
- Consider adopting a Firm policy to align with the 52.2% market standard in Ellison Bay.
- Using a Strict policy might deter some guests, as only 8.7% of listings use it. Evaluate if potential revenue protection outweighs possible lower booking rates.
- Regularly review your cancellation policy against competitors and market demand shifts in Ellison Bay.
Ellison Bay STR Booking Lead Time Analysis (2026)
Average Booking Lead Time by Month
Booking Lead Time Insights for Ellison Bay
- The overall average booking lead time for vacation rentals in Ellison Bay is 81 days.
- Guests book furthest in advance for stays during May (average 114 days), likely coinciding with peak travel demand or local events.
- The shortest booking windows occur for stays in January (average 22 days), indicating more last-minute travel plans during this time.
- Seasonally, Summer (105 days avg.) sees the longest lead times, while Winter (25 days avg.) has the shortest, reflecting typical travel planning cycles.
Recommendations for Hosts
- Use the overall average lead time (81 days) as a baseline for your pricing and availability strategy in Ellison Bay.
- For May stays, consider implementing length-of-stay discounts or slightly higher rates for bookings made less than 114 days out to capitalize on advance planning.
- Target marketing efforts for the Summer season well in advance (at least 105 days) to capture early planners.
- Monitor your own booking lead times against these Ellison Bay averages to identify opportunities for dynamic pricing adjustments.
Popular & Essential Airbnb Amenities in Ellison Bay (2026)
Amenity Prevalence
Amenity Insights for Ellison Bay
- Essential amenities in Ellison Bay that guests expect include: Carbon monoxide alarm, Air conditioning, TV, Free parking on premises. Lacking these (any) could significantly impact bookings.
- Popular amenities like Wifi, Smoke alarm, Microwave are common but not universal. Offering these can provide a competitive edge.
- Warning: Wifi is not universally provided but is considered essential globally. Ensure reliable Wifi is offered.
Recommendations for Hosts
- Ensure your listing includes all essential amenities for Ellison Bay: Carbon monoxide alarm, Air conditioning, TV, Free parking on premises.
- Prioritize adding missing essentials: Carbon monoxide alarm, Air conditioning, TV, Free parking on premises.
- Consider adding popular differentiators like Wifi or Smoke alarm to increase appeal.
- Highlight unique or less common amenities you offer (e.g., hot tub, dedicated workspace, EV charger) in your listing description and photos.
- Regularly check competitor amenities in Ellison Bay to stay competitive.
Ellison Bay Airbnb Guest Demographics & Profile Analysis (2026)
Guest Profile Summary for Ellison Bay
- The typical guest profile for Airbnb in Ellison Bay consists of primarily domestic travelers (99%), often arriving from nearby Chicago, typically belonging to the Post-2000s (Gen Z/Alpha) group (50%), primarily speaking English or Spanish.
- Domestic travelers account for 98.5% of guests.
- Key international markets include United States (98.5%) and Panama (0.7%).
- Top languages spoken are English (74.1%) followed by Spanish (10.3%).
- A significant demographic segment is the Post-2000s (Gen Z/Alpha) group, representing 50% of guests.
Recommendations for Hosts
- Target domestic marketing efforts towards travelers from Chicago and Madison.
- Tailor amenities and listing descriptions to appeal to the dominant Post-2000s (Gen Z/Alpha) demographic (e.g., highlight fast WiFi, smart home features, local guides).
- Highlight unique local experiences or amenities relevant to the primary guest profile.
- Consider seasonal promotions aligned with peak travel times for key origin markets.
Nearby Short-Term Rental Market Comparison
How does the Ellison Bay Airbnb market stack up against its neighbors? Compare key performance metrics like average monthly revenue, ADR, and occupancy rates in surrounding areas to understand the broader regional STR landscape.
| Market | Active Properties | Monthly Revenue | Daily Rate | Avg. Occupancy |
|---|---|---|---|---|
| Town of Newton | 11 | $6,557 | $770.72 | 42% |
| Town of Wilson | 16 | $6,450 | $620.70 | 43% |
| Town of Jacksonport | 13 | $5,677 | $517.68 | 44% |
| Rowleys Bay | 19 | $5,182 | $416.60 | 48% |
| Suamico | 13 | $4,905 | $473.88 | 44% |
| Town of Nasewaupee | 34 | $4,843 | $412.94 | 46% |
| Town of Sturgeon Bay | 17 | $4,833 | $437.66 | 49% |
| Town of Liberty Grove | 55 | $4,774 | $402.24 | 50% |
| Sister Bay | 97 | $4,681 | $428.67 | 45% |
| Town of Egg Harbor | 41 | $4,616 | $362.18 | 45% |