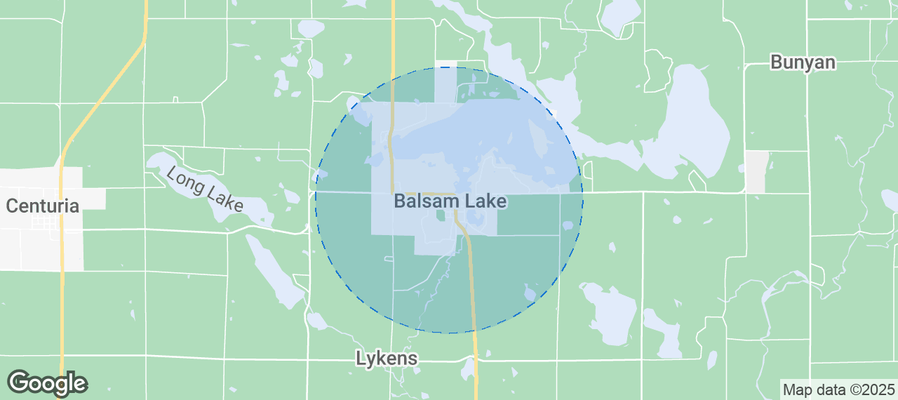
Balsam Lake Airbnb Market Analysis 2026: Short Term Rental Data & Vacation Rental Statistics in Wisconsin, United States
Is Airbnb profitable in Balsam Lake in 2026? Explore comprehensive Airbnb analytics for Balsam Lake, Wisconsin, United States to uncover income potential. This 2026 STR market report for Balsam Lake, based on AirROI data from February 2025 to January 2026, reveals key trends in the niche market of 25 active listings.
Whether you're considering an Airbnb investment in Balsam Lake, optimizing your existing vacation rental, or exploring rental arbitrage opportunities, understanding the Balsam Lake Airbnb data is crucial. Leveraging the low regulation environment is key to maximizing your short term rental income potential. Let's dive into the specifics.
Key Balsam Lake Airbnb Performance Metrics Overview
Monthly Airbnb Revenue Variations & Income Potential in Balsam Lake (2026)
Understanding the monthly revenue variations for Airbnb listings in Balsam Lake is key to maximizing your short term rental income potential. Seasonality significantly impacts earnings. Our analysis, based on data from the past 12 months, shows that the peak revenue month for STRs in Balsam Lake is typically July, while January often presents the lowest earnings, highlighting opportunities for strategic pricing adjustments during shoulder and low seasons. Explore the typical Airbnb income in Balsam Lake across different performance tiers:
- Best-in-class properties (Top 10%) achieve $4,947+ monthly, often utilizing dynamic pricing and superior guest experiences.
- Strong performing properties (Top 25%) earn $2,474 or more, indicating effective management and desirable locations/amenities.
- Typical properties (Median) generate around $1,033 per month, representing the average market performance.
- Entry-level properties (Bottom 25%) see earnings around $492, often with potential for optimization.
Average Monthly Airbnb Earnings Trend in Balsam Lake
Balsam Lake Airbnb Occupancy Rate Trends (2026)
Maximize your bookings by understanding the Balsam Lake STR occupancy trends. Seasonal demand shifts significantly influence how often properties are booked. Typically, Novembersees the highest demand (peak season occupancy), while January experiences the lowest (low season). Effective strategies, like adjusting minimum stays or offering promotions, can boost occupancy during slower periods. Here's how different property tiers perform in Balsam Lake:
- Best-in-class properties (Top 10%) achieve 50%+ occupancy, indicating high desirability and potentially optimized availability.
- Strong performing properties (Top 25%) maintain 35% or higher occupancy, suggesting good market fit and guest satisfaction.
- Typical properties (Median) have an occupancy rate around 17%.
- Entry-level properties (Bottom 25%) average 9% occupancy, potentially facing higher vacancy.
Average Monthly Occupancy Rate Trend in Balsam Lake
Average Daily Rate (ADR) Airbnb Trends in Balsam Lake (2026)
Effective short term rental pricing strategy in Balsam Lake involves understanding monthly ADR fluctuations. The Average Daily Rate (ADR) for Airbnb in Balsam Lake typically peaks in July and dips lowest during March. Leveraging Airbnb dynamic pricing tools or strategies based on this seasonality can significantly boost revenue. Here's a look at the typical nightly rates achieved:
- Best-in-class properties (Top 10%) command rates of $472+ per night, often due to premium features or locations.
- Strong performing properties (Top 25%) achieve nightly rates of $239 or more.
- Typical properties (Median) charge around $177 per night.
- Entry-level properties (Bottom 25%) earn around $155 per night.
Average Daily Rate (ADR) Trend by Month in Balsam Lake
Get Live Balsam Lake Market Intelligence 👇
Explore Real-time Analytics
Airbnb Seasonality Analysis & Trends in Balsam Lake (2026)
Peak Season (July, June, August)
- Revenue averages $3,404 per month
- Occupancy rates average 30.7%
- Daily rates average $293
Shoulder Season
- Revenue averages $1,576 per month
- Occupancy maintains around 23.2%
- Daily rates hold near $273
Low Season (January, February, March)
- Revenue drops to average $1,027 per month
- Occupancy decreases to average 18.6%
- Daily rates adjust to average $262
Seasonality Insights for Balsam Lake
- The Airbnb seasonality in Balsam Lake shows highly seasonal trends requiring careful strategy. While the sections above show seasonal averages, it's also insightful to look at the extremes:
- During the high season, the absolute peak month showcases Balsam Lake's highest earning potential, with monthly revenues capable of climbing to $3,785, occupancy reaching a high of 35.0%, and ADRs peaking at $300.
- Conversely, the slowest single month of the year, typically falling within the low season, marks the market's lowest point. In this month, revenue might dip to $790, occupancy could drop to 14.3%, and ADRs may adjust down to $256.
- Understanding both the seasonal averages and these monthly peaks and troughs in revenue, occupancy, and ADR is crucial for maximizing your Airbnb profit potential in Balsam Lake.
Seasonal Strategies for Maximizing Profit
- Peak Season: Maximize revenue through premium pricing and potentially longer minimum stays. Ensure high availability.
- Low Season: Offer competitive pricing, special promotions (e.g., extended stay discounts), and flexible cancellation policies. Target off-season travelers like remote workers or budget-conscious guests.
- Shoulder Seasons: Implement dynamic pricing that balances peak and low rates. Target weekend travelers or specific events. Offer slightly more flexible terms than peak season.
- Regularly analyze your own performance against these Balsam Lake seasonality benchmarks and adjust your pricing and availability strategy accordingly.
Best Areas for Airbnb Investment in Balsam Lake (2026)
Exploring the top neighborhoods for short-term rentals in Balsam Lake? This section highlights key areas, outlining why they are attractive for hosts and guests, along with notable local attractions. Consider these locations based on your target guest profile and investment strategy.
| Neighborhood / Area | Why Host Here? (Target Guests & Appeal) | Key Attractions & Landmarks |
|---|---|---|
| Balsam Lake Village | Charming small town atmosphere near beautiful lakes, perfect for families and individuals looking for a peaceful getaway. | Balsam Lake, Wild River State Park, Balsam Lake Park, Local shops and restaurants |
| Milltown | A quaint village surrounded by nature, appealing to those looking for a rustic retreat with outdoor activities available nearby. | Milltown Park, Fishing spots, Hiking trails, Local festivals |
| Lancaster | Rich in history and surrounded by natural beauty, it offers a great backdrop for outdoor and historical tourism. | Historical society museums, Bird watching spots, Lakes and fishing |
| Luck | Known for its friendly community and events, ideal for travelers seeking local culture and scenic views. | Luck Golf Course, Local artisan shops, Annual festivals and fairs |
| Trade Lake | A secluded area with stunning lake views, attracting those looking for peace and tranquility. | Trade Lake, Fishing, Kayaking opportunities |
| Shell Lake | A beautiful lakeside town popular for summer vacations, ideal for water activities and relaxation. | Shell Lake, Water sports, Local dining, Art galleries |
| Star Prairie | A small village with a close-knit community, appealing to visitors looking for downtime and natural surroundings. | Local parks, River hiking, Community events |
| Route 8 Recreation Area | A popular spot for outdoor enthusiasts with multiple recreational activities available year-round, perfect for active travelers. | Hiking trails, Biking paths, Fishing spots, Camping areas |
Understanding Airbnb License Requirements & STR Laws in Balsam Lake (2026)
While Balsam Lake, Wisconsin, United States currently shows low STR regulations, specific Airbnb license requirements might still exist or change. Always verify the latest short term rental regulations and Airbnb license requirements directly with local government authorities for Balsam Lake to ensure full compliance before hosting.
(Source: AirROI data, 2026, finding no licensed listings among those analyzed)
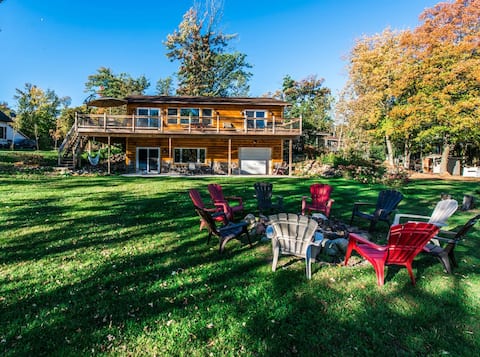
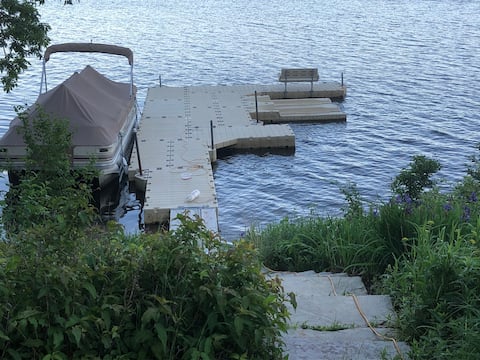
Top Performing Airbnb Properties in Balsam Lake (2026)
Benchmark your potential! Explore examples of top-performing Airbnb properties in Balsam Lakebased on Trailing Twelve Month (TTM) revenue. Analyze their characteristics, revenue, occupancy rate, and ADR to understand what drives success in this market.
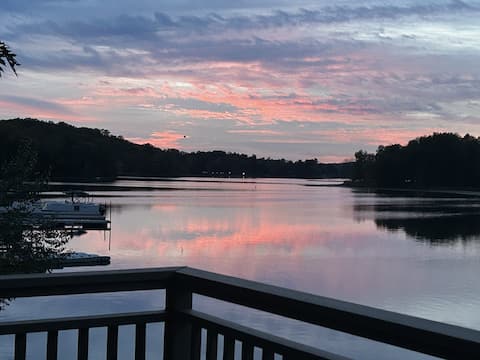
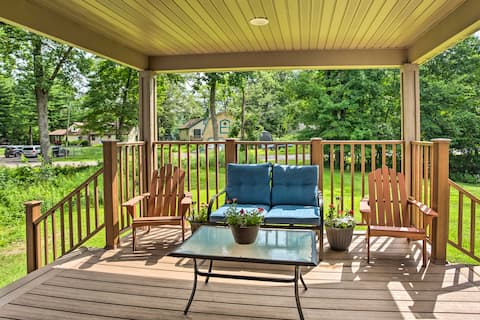
Woodsy Waterfront Retreat on Beautiful Balsam Lake
Entire Place • 3 bedrooms
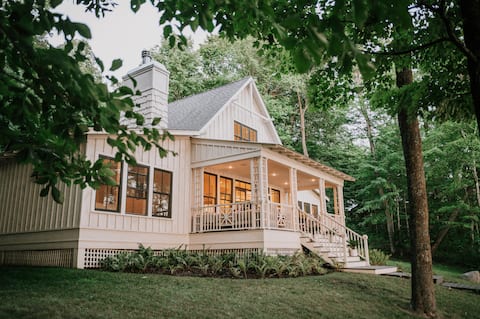
The Island House - Balsam Lake
Entire Place • 4 bedrooms
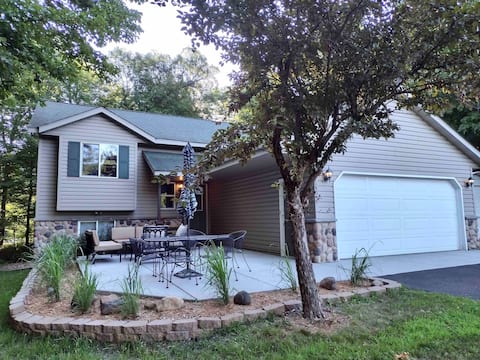
Bring Your Problems to Prettier Places
Entire Place • 4 bedrooms
Cabin w/ Dock & Porch Across from Balsam Lake
Entire Place • 6 bedrooms
Swim-Friendly Lakefront Cabin on Big Blake | Flat
Entire Place • 3 bedrooms
Lakefront Year-Round House on Balsam Lake
Entire Place • 3 bedrooms
Note: Performance varies based on location, size, amenities, seasonality, and management quality. Data reflects the past 12 months.
Top Performing Airbnb Hosts in Balsam Lake (2026)
Learn from the best! This table showcases top-performing Airbnb hosts in Balsam Lake based on the number of properties managed and estimated total revenue over the past year. Analyze their scale and performance metrics.
| Host Name | Properties | Grossing Revenue | Stay Reviews | Avg Rating |
|---|---|---|---|---|
| Lumberjill Lodge | 16 | $77,794 | 82 | 4.74/5.0 |
| Erin | 1 | $76,380 | 8 | 5.00/5.0 |
| Courtney | 1 | $44,561 | 14 | 5.00/5.0 |
| Anne | 1 | $43,327 | 44 | 4.98/5.0 |
| Evolve | 1 | $37,523 | 28 | 4.82/5.0 |
| Joseph | 1 | $36,506 | 67 | 4.76/5.0 |
| Deborah | 1 | $28,868 | 2 | Not Rated |
| Josephine | 1 | $24,454 | 30 | 4.87/5.0 |
| Tareh | 1 | $10,047 | 90 | 4.59/5.0 |
| Holly | 1 | $8,393 | 5 | 5.00/5.0 |
Analyzing the strategies of top hosts, such as their property selection, pricing, and guest communication, can offer valuable lessons for optimizing your own Airbnb operations in Balsam Lake.
Dive Deeper: Advanced Balsam Lake STR Market Data (2026)
Ready to unlock more insights? AirROI provides access to advanced metrics and comprehensive Airbnb data for Balsam Lake. Explore detailed analytics beyond this report to refine your investment strategy, optimize pricing, and maximize your vacation rental profits.
Explore Advanced MetricsBalsam Lake Short-Term Rental Market Composition (2026): Property & Room Types
Room Type Distribution
Property Type Distribution
Market Composition Insights for Balsam Lake
- The Balsam Lake Airbnb market composition is heavily skewed towards Private Room listings, which make up 64% of the 25 active rentals. This indicates strong guest preference for privacy and space.
- Looking at the property type distribution in Balsam Lake, Hotel/Boutique properties are the most common (64%), reflecting the local real estate landscape.
- Houses represent a significant 16% portion, catering likely to families or larger groups.
- The presence of 64% Hotel/Boutique listings indicates integration with traditional hospitality.
- Smaller segments like apartment/condo (combined 4.0%) offer potential for unique stay experiences.
Balsam Lake Airbnb Room Capacity Analysis (2026): Bedroom Distribution
Distribution of Listings by Number of Bedrooms
Room Capacity Insights for Balsam Lake
- The dominant room capacity in Balsam Lake is 1 bedroom listings, making up 64% of the market. This suggests a strong demand for properties suitable for couples or solo travelers.
- Together, 1 bedroom and 2 bedrooms properties represent 76.0% of the active Airbnb listings in Balsam Lake, indicating a high concentration in these sizes.
- With over half the market (64%) consisting of studios or 1-bedroom units, Balsam Lake is particularly well-suited for individuals or couples.
- A significant 24.0% of listings offer 3+ bedrooms, catering to larger groups and families seeking more space in Balsam Lake.
Balsam Lake Vacation Rental Guest Capacity Trends (2026)
Distribution of Listings by Guest Capacity
Guest Capacity Insights for Balsam Lake
- The most common guest capacity trend in Balsam Lake vacation rentals is listings accommodating 2 guests (36%). This suggests the primary traveler segment is likely couples or solo travelers.
- Properties designed for 2 guests and 4 guests dominate the Balsam Lake STR market, accounting for 68.0% of listings.
- 32.0% of properties accommodate 6+ guests, serving the market segment for larger families or group travel in Balsam Lake.
- On average, properties in Balsam Lake are equipped to host 4.5 guests.
Balsam Lake Airbnb Booking Patterns (2026): Available vs. Booked Days
Available Days Distribution
Booked Days Distribution
Booking Pattern Insights for Balsam Lake
- The most common availability pattern in Balsam Lake falls within the 271-366 days range, representing 84% of listings. This suggests many properties have significant open periods on their calendars.
- Approximately 96.0% of listings show high availability (181+ days open annually), indicating potential for increased bookings or specific owner usage patterns.
- For booked days, the 31-90 days range is most frequent in Balsam Lake (44%), reflecting common guest stay durations or potential owner blocking patterns.
- A notable 4.0% of properties secure long booking periods (181+ days booked per year), highlighting successful long-term rental strategies or significant owner usage.
Balsam Lake Airbnb Minimum Stay Requirements Analysis
Distribution of Listings by Minimum Night Requirement
1 Night
18 listings
72% of total
2 Nights
2 listings
8% of total
3 Nights
2 listings
8% of total
4-6 Nights
1 listings
4% of total
30+ Nights
2 listings
8% of total
Key Insights
- The most prevalent minimum stay requirement in Balsam Lake is 1 Night, adopted by 72% of listings. This highlights the market's preference for shorter, flexible bookings.
- A strong majority (80.0%) of the Balsam Lake Airbnb data shows acceptance of very short stays (1-2 nights), indicating a dynamic, high-turnover market.
Recommendations
- Align with the market by considering a 1 Night minimum stay, as 72% of Balsam Lake hosts use this setting.
- Explore offering discounts for stays of 30+ nights to attract the 8% of the market seeking extended stays.
- Adjust minimum nights based on seasonality – potentially shorter during low season and longer during peak demand periods in Balsam Lake.
Balsam Lake Airbnb Cancellation Policy Trends Analysis (2026)
Moderate
19 listings
76% of total
Firm
5 listings
20% of total
Strict
1 listings
4% of total
Cancellation Policy Insights for Balsam Lake
- The prevailing Airbnb cancellation policy trend in Balsam Lake is Moderate, used by 76% of listings.
- The market strongly favors guest-friendly terms, with 76.0% of listings offering Flexible or Moderate policies. This suggests guests in Balsam Lake may expect booking flexibility.
- Strict cancellation policies are quite rare (4%), potentially making listings with this policy less competitive unless justified by high demand or property type.
Recommendations for Hosts
- Consider adopting a Moderate policy to align with the 76% market standard in Balsam Lake.
- Using a Strict policy might deter some guests, as only 4% of listings use it. Evaluate if potential revenue protection outweighs possible lower booking rates.
- Regularly review your cancellation policy against competitors and market demand shifts in Balsam Lake.
Balsam Lake STR Booking Lead Time Analysis (2026)
Average Booking Lead Time by Month
Booking Lead Time Insights for Balsam Lake
- The overall average booking lead time for vacation rentals in Balsam Lake is 44 days.
- Guests book furthest in advance for stays during May (average 70 days), likely coinciding with peak travel demand or local events.
- The shortest booking windows occur for stays in November (average 11 days), indicating more last-minute travel plans during this time.
- Seasonally, Summer (58 days avg.) sees the longest lead times, while Winter (21 days avg.) has the shortest, reflecting typical travel planning cycles.
Recommendations for Hosts
- Use the overall average lead time (44 days) as a baseline for your pricing and availability strategy in Balsam Lake.
- For May stays, consider implementing length-of-stay discounts or slightly higher rates for bookings made less than 70 days out to capitalize on advance planning.
- During November, focus on last-minute booking availability and promotions, as guests book with very short notice (11 days avg.).
- Target marketing efforts for the Summer season well in advance (at least 58 days) to capture early planners.
- Monitor your own booking lead times against these Balsam Lake averages to identify opportunities for dynamic pricing adjustments.
Popular & Essential Airbnb Amenities in Balsam Lake (2026)
Amenity Prevalence
Amenity Insights for Balsam Lake
- Essential amenities in Balsam Lake that guests expect include: TV, Smoke alarm, Fire pit, Free parking on premises, Air conditioning, Wifi, Bed linens, Hot water, Heating, Fire extinguisher. Lacking these (any) could significantly impact bookings.
Recommendations for Hosts
- Ensure your listing includes all essential amenities for Balsam Lake: TV, Smoke alarm, Fire pit, Free parking on premises, Air conditioning, Wifi, Bed linens, Hot water, Heating, Fire extinguisher.
- Prioritize adding missing essentials: Bed linens, Hot water, Heating, Fire extinguisher.
- Highlight unique or less common amenities you offer (e.g., hot tub, dedicated workspace, EV charger) in your listing description and photos.
- Regularly check competitor amenities in Balsam Lake to stay competitive.
Balsam Lake Airbnb Guest Demographics & Profile Analysis (2026)
Guest Profile Summary for Balsam Lake
- The typical guest profile for Airbnb in Balsam Lake consists of primarily domestic travelers (100%), often arriving from nearby Minneapolis, typically belonging to the Post-2000s (Gen Z/Alpha) group (50%), primarily speaking English or Japanese.
- Domestic travelers account for 100.0% of guests.
- Top languages spoken are English (90.9%) followed by Japanese (9.1%).
- A significant demographic segment is the Post-2000s (Gen Z/Alpha) group, representing 50% of guests.
Recommendations for Hosts
- Target domestic marketing efforts towards travelers from Minneapolis and Hinckley.
- Tailor amenities and listing descriptions to appeal to the dominant Post-2000s (Gen Z/Alpha) demographic (e.g., highlight fast WiFi, smart home features, local guides).
- Highlight unique local experiences or amenities relevant to the primary guest profile.
- Consider seasonal promotions aligned with peak travel times for key origin markets.
Nearby Short-Term Rental Market Comparison
How does the Balsam Lake Airbnb market stack up against its neighbors? Compare key performance metrics like average monthly revenue, ADR, and occupancy rates in surrounding areas to understand the broader regional STR landscape.
| Market | Active Properties | Monthly Revenue | Daily Rate | Avg. Occupancy |
|---|---|---|---|---|
| Hastings | 14 | $6,579 | $481.32 | 46% |
| Town of Minong | 21 | $5,818 | $576.90 | 41% |
| Shoreview | 12 | $5,525 | $470.30 | 56% |
| Town of Clover | 13 | $5,047 | $303.16 | 53% |
| Forest Lake | 25 | $4,839 | $398.24 | 47% |
| Grand Lake Township | 11 | $4,834 | $345.41 | 46% |
| Wayzata | 20 | $4,819 | $432.69 | 50% |
| Silver Creek Township | 19 | $4,600 | $348.22 | 53% |
| Hillman | 10 | $4,599 | $424.33 | 40% |
| Mound | 15 | $4,463 | $459.67 | 48% |