Woodinville Airbnb Market Analysis 2026: Short Term Rental Data & Vacation Rental Statistics in Washington, United States
Is Airbnb profitable in Woodinville in 2026? Explore comprehensive Airbnb analytics for Woodinville, Washington, United States to uncover income potential. This 2026 STR market report for Woodinville, based on AirROI data from February 2025 to January 2026, reveals key trends in the niche market of 35 active listings.
Whether you're considering an Airbnb investment in Woodinville, optimizing your existing vacation rental, or exploring rental arbitrage opportunities, understanding the Woodinville Airbnb data is crucial. Leveraging the low regulation environment is key to maximizing your short term rental income potential. Let's dive into the specifics.
Key Woodinville Airbnb Performance Metrics Overview
Monthly Airbnb Revenue Variations & Income Potential in Woodinville (2026)
Understanding the monthly revenue variations for Airbnb listings in Woodinville is key to maximizing your short term rental income potential. Seasonality significantly impacts earnings. Our analysis, based on data from the past 12 months, shows that the peak revenue month for STRs in Woodinville is typically July, while February often presents the lowest earnings, highlighting opportunities for strategic pricing adjustments during shoulder and low seasons. Explore the typical Airbnb income in Woodinville across different performance tiers:
- Best-in-class properties (Top 10%) achieve $11,174+ monthly, often utilizing dynamic pricing and superior guest experiences.
- Strong performing properties (Top 25%) earn $6,795 or more, indicating effective management and desirable locations/amenities.
- Typical properties (Median) generate around $3,365 per month, representing the average market performance.
- Entry-level properties (Bottom 25%) see earnings around $1,878, often with potential for optimization.
Average Monthly Airbnb Earnings Trend in Woodinville
Woodinville Airbnb Occupancy Rate Trends (2026)
Maximize your bookings by understanding the Woodinville STR occupancy trends. Seasonal demand shifts significantly influence how often properties are booked. Typically, Junesees the highest demand (peak season occupancy), while January experiences the lowest (low season). Effective strategies, like adjusting minimum stays or offering promotions, can boost occupancy during slower periods. Here's how different property tiers perform in Woodinville:
- Best-in-class properties (Top 10%) achieve 86%+ occupancy, indicating high desirability and potentially optimized availability.
- Strong performing properties (Top 25%) maintain 73% or higher occupancy, suggesting good market fit and guest satisfaction.
- Typical properties (Median) have an occupancy rate around 53%.
- Entry-level properties (Bottom 25%) average 30% occupancy, potentially facing higher vacancy.
Average Monthly Occupancy Rate Trend in Woodinville
Average Daily Rate (ADR) Airbnb Trends in Woodinville (2026)
Effective short term rental pricing strategy in Woodinville involves understanding monthly ADR fluctuations. The Average Daily Rate (ADR) for Airbnb in Woodinville typically peaks in September and dips lowest during February. Leveraging Airbnb dynamic pricing tools or strategies based on this seasonality can significantly boost revenue. Here's a look at the typical nightly rates achieved:
- Best-in-class properties (Top 10%) command rates of $666+ per night, often due to premium features or locations.
- Strong performing properties (Top 25%) achieve nightly rates of $352 or more.
- Typical properties (Median) charge around $233 per night.
- Entry-level properties (Bottom 25%) earn around $142 per night.
Average Daily Rate (ADR) Trend by Month in Woodinville
Get Live Woodinville Market Intelligence 👇

Explore Real-time Analytics
Airbnb Seasonality Analysis & Trends in Woodinville (2026)
Peak Season (July, June, August)
- Revenue averages $7,470 per month
- Occupancy rates average 62.6%
- Daily rates average $349
Shoulder Season
- Revenue averages $5,345 per month
- Occupancy maintains around 50.4%
- Daily rates hold near $324
Low Season (January, February, March)
- Revenue drops to average $3,668 per month
- Occupancy decreases to average 44.1%
- Daily rates adjust to average $295
Seasonality Insights for Woodinville
- The Airbnb seasonality in Woodinville shows highly seasonal trends requiring careful strategy. While the sections above show seasonal averages, it's also insightful to look at the extremes:
- During the high season, the absolute peak month showcases Woodinville's highest earning potential, with monthly revenues capable of climbing to $8,110, occupancy reaching a high of 65.3%, and ADRs peaking at $360.
- Conversely, the slowest single month of the year, typically falling within the low season, marks the market's lowest point. In this month, revenue might dip to $3,256, occupancy could drop to 38.4%, and ADRs may adjust down to $290.
- Understanding both the seasonal averages and these monthly peaks and troughs in revenue, occupancy, and ADR is crucial for maximizing your Airbnb profit potential in Woodinville.
Seasonal Strategies for Maximizing Profit
- Peak Season: Maximize revenue through premium pricing and potentially longer minimum stays. Ensure high availability.
- Low Season: Offer competitive pricing, special promotions (e.g., extended stay discounts), and flexible cancellation policies. Target off-season travelers like remote workers or budget-conscious guests.
- Shoulder Seasons: Implement dynamic pricing that balances peak and low rates. Target weekend travelers or specific events. Offer slightly more flexible terms than peak season.
- Regularly analyze your own performance against these Woodinville seasonality benchmarks and adjust your pricing and availability strategy accordingly.
Best Areas for Airbnb Investment in Woodinville (2026)
Exploring the top neighborhoods for short-term rentals in Woodinville? This section highlights key areas, outlining why they are attractive for hosts and guests, along with notable local attractions. Consider these locations based on your target guest profile and investment strategy.
| Neighborhood / Area | Why Host Here? (Target Guests & Appeal) | Key Attractions & Landmarks |
|---|---|---|
| Downtown Woodinville | The central hub of Woodinville, known for its wineries, restaurants, and proximity to parks. Ideal for tourists wanting to experience local vineyards and shops. | Woodinville Wine Country, Hollywood Hill, Maltby Cafe, Woodinville State Park, Columbia Winery |
| Hollywood District | A vibrant neighborhood filled with a mix of residential and commercial spaces. Attracts visitors for its close-knit community feel and local businesses. | Hollywood Schoolhouse, Redhook Brewery, Tasting Room, Hollywood Park, Shepherd of the Hills Lutheran Church |
| North Creek | A rapidly growing area with family-friendly amenities. Popular among those visiting for family events and activities. | North Creek Park, Maltby Park, Northshore YMCA, Alderwood Mall, Thompson Park |
| Woodinville Wine Country | Famous for its numerous wineries and tasting rooms, attracting wine enthusiasts and tourists looking for unique experiences. | Chateau Ste. Michelle, Columbia Winery, DeLille Cellars, Novelty Hill-Januik Winery, Woodinville Lavender |
| Westhill | Known for its scenic views and residential neighborhoods. Offers a quiet retreat close to nature, perfect for travelers seeking peace. | Bridle Trails State Park, Woodinville Heritage Museum, Woodinville Park, Snohomish River, Cottage Lake Park |
| East Woodinville | A suburban feel with access to parks and outdoor activities. Great for families and nature lovers. | Snoqualmie River Park, Northshore School District, Woodinville Sports Club, Eastside Rail Corridor, Cottage Lake |
| Bothell | Just a short distance from Woodinville, Bothell offers additional dining and shopping experiences. Popular with those looking for a more bustling atmosphere. | Bothell Landing, Cascadia College, Park at Bothell Landing, Cascadia Art Museum, McMenamins Anderson School |
| Nearby Seattle | Being close to Seattle opens up opportunities for Airbnb guests to explore the city while enjoying the quieter atmosphere of Woodinville. | Pike Place Market, Seattle Center, Space Needle, Chihuly Garden and Glass, Museum of Pop Culture |
Understanding Airbnb License Requirements & STR Laws in Woodinville (2026)
While Woodinville, Washington, United States currently shows low STR regulations, specific Airbnb license requirements might still exist or change. Always verify the latest short term rental regulations and Airbnb license requirements directly with local government authorities for Woodinville to ensure full compliance before hosting.
(Source: AirROI data, 2026, finding no licensed listings among those analyzed)
Top Performing Airbnb Properties in Woodinville (2026)
Benchmark your potential! Explore examples of top-performing Airbnb properties in Woodinvillebased on Trailing Twelve Month (TTM) revenue. Analyze their characteristics, revenue, occupancy rate, and ADR to understand what drives success in this market.
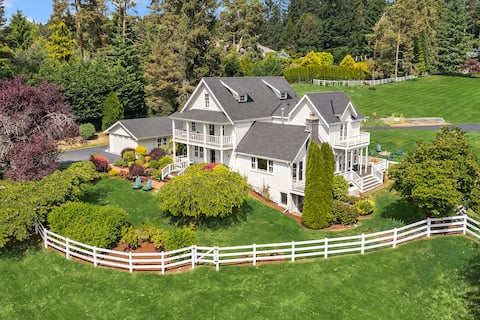
Storybook Farmhouse Estate
Entire Place • 6 bedrooms
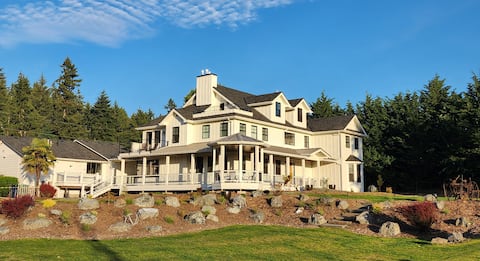
Hollywood Manor in Woodinville Tourist District
Entire Place • 5 bedrooms

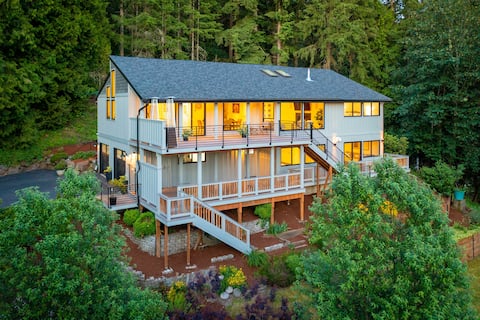
Beautiful Wine Country Home w/ Hot Tub & Lake View
Entire Place • 4 bedrooms

Remodeled Home in Wine District/4BR-3BA/GameRoom
Entire Place • 4 bedrooms
Walk to Wine Tasting House w/ View 4BD/3.5BA
Entire Place • 4 bedrooms

Valley View Wine
Entire Place • 4 bedrooms
Note: Performance varies based on location, size, amenities, seasonality, and management quality. Data reflects the past 12 months.
Top Performing Airbnb Hosts in Woodinville (2026)
Learn from the best! This table showcases top-performing Airbnb hosts in Woodinville based on the number of properties managed and estimated total revenue over the past year. Analyze their scale and performance metrics.
| Host Name | Properties | Grossing Revenue | Stay Reviews | Avg Rating |
|---|---|---|---|---|
| Brett & Carley | 1 | $354,236 | 63 | 5.00/5.0 |
| Evolve | 2 | $231,714 | 186 | 4.92/5.0 |
| Michael | 1 | $153,398 | 7 | 5.00/5.0 |
| Kyleah | 1 | $106,070 | 33 | 5.00/5.0 |
| Amazing | 1 | $105,301 | 57 | 4.89/5.0 |
| Perch Vacations & Homes | 1 | $100,645 | 52 | 5.00/5.0 |
| Kit | 1 | $90,218 | 19 | 5.00/5.0 |
| Wendy | 1 | $76,684 | 82 | 4.96/5.0 |
| Simon | 1 | $55,048 | 3 | 5.00/5.0 |
| Rebecca | 1 | $49,136 | 90 | 4.92/5.0 |
Analyzing the strategies of top hosts, such as their property selection, pricing, and guest communication, can offer valuable lessons for optimizing your own Airbnb operations in Woodinville.
Dive Deeper: Advanced Woodinville STR Market Data (2026)
Ready to unlock more insights? AirROI provides access to advanced metrics and comprehensive Airbnb data for Woodinville. Explore detailed analytics beyond this report to refine your investment strategy, optimize pricing, and maximize your vacation rental profits.
Explore Advanced MetricsWoodinville Short-Term Rental Market Composition (2026): Property & Room Types
Room Type Distribution
Property Type Distribution
Market Composition Insights for Woodinville
- The Woodinville Airbnb market composition is heavily skewed towards Entire Home/Apt listings, which make up 85.7% of the 35 active rentals. This indicates strong guest preference for privacy and space.
- Looking at the property type distribution in Woodinville, House properties are the most common (68.6%), reflecting the local real estate landscape.
- Houses represent a significant 68.6% portion, catering likely to families or larger groups.
- The presence of 11.4% Hotel/Boutique listings indicates integration with traditional hospitality.
- Smaller segments like outdoor/unique, apartment/condo (combined 5.8%) offer potential for unique stay experiences.
Woodinville Airbnb Room Capacity Analysis (2026): Bedroom Distribution
Distribution of Listings by Number of Bedrooms
Room Capacity Insights for Woodinville
- The dominant room capacity in Woodinville is 1 bedroom listings, making up 28.6% of the market. This suggests a strong demand for properties suitable for couples or solo travelers.
- Together, 1 bedroom and 3 bedrooms properties represent 48.6% of the active Airbnb listings in Woodinville, indicating a high concentration in these sizes.
- A significant 42.9% of listings offer 3+ bedrooms, catering to larger groups and families seeking more space in Woodinville.
Woodinville Vacation Rental Guest Capacity Trends (2026)
Distribution of Listings by Guest Capacity
Guest Capacity Insights for Woodinville
- The most common guest capacity trend in Woodinville vacation rentals is listings accommodating 8+ guests (25.7%). This suggests the primary traveler segment is likely larger groups.
- Properties designed for 8+ guests and 3 guests dominate the Woodinville STR market, accounting for 42.8% of listings.
- 34.3% of properties accommodate 6+ guests, serving the market segment for larger families or group travel in Woodinville.
- On average, properties in Woodinville are equipped to host 4.5 guests.
Woodinville Airbnb Booking Patterns (2026): Available vs. Booked Days
Available Days Distribution
Booked Days Distribution
Booking Pattern Insights for Woodinville
- The most common availability pattern in Woodinville falls within the 271-366 days range, representing 31.4% of listings. This suggests many properties have significant open periods on their calendars.
- Approximately 62.8% of listings show high availability (181+ days open annually), indicating potential for increased bookings or specific owner usage patterns.
- For booked days, the 91-180 days range is most frequent in Woodinville (31.4%), reflecting common guest stay durations or potential owner blocking patterns.
- A notable 40.0% of properties secure long booking periods (181+ days booked per year), highlighting successful long-term rental strategies or significant owner usage.
Woodinville Airbnb Minimum Stay Requirements Analysis
Distribution of Listings by Minimum Night Requirement
1 Night
7 listings
20% of total
2 Nights
13 listings
37.1% of total
3 Nights
1 listings
2.9% of total
4-6 Nights
2 listings
5.7% of total
7-29 Nights
3 listings
8.6% of total
30+ Nights
9 listings
25.7% of total
Key Insights
- The most prevalent minimum stay requirement in Woodinville is 2 Nights, adopted by 37.1% of listings. This highlights the market's preference for shorter, flexible bookings.
- A significant segment (25.7%) caters to monthly stays (30+ nights) in Woodinville, pointing to opportunities in the extended-stay market.
Recommendations
- Align with the market by considering a 2 Nights minimum stay, as 37.1% of Woodinville hosts use this setting.
- If feasible, allowing 1-night stays, especially midweek or during low season, could capture last-minute bookings, as only 20% currently do.
- Explore offering discounts for stays of 30+ nights to attract the 25.7% of the market seeking extended stays.
- Adjust minimum nights based on seasonality – potentially shorter during low season and longer during peak demand periods in Woodinville.
Woodinville Airbnb Cancellation Policy Trends Analysis (2026)
Super Strict 30 Days
1 listings
2.9% of total
Flexible
6 listings
17.1% of total
Moderate
8 listings
22.9% of total
Firm
15 listings
42.9% of total
Strict
5 listings
14.3% of total
Cancellation Policy Insights for Woodinville
- The prevailing Airbnb cancellation policy trend in Woodinville is Firm, used by 42.9% of listings.
- A majority (57.2%) of hosts in Woodinville utilize Firm or Strict policies, indicating a market where hosts prioritize booking security.
Recommendations for Hosts
- Consider adopting a Firm policy to align with the 42.9% market standard in Woodinville.
- Using a Strict policy might deter some guests, as only 14.3% of listings use it. Evaluate if potential revenue protection outweighs possible lower booking rates.
- Regularly review your cancellation policy against competitors and market demand shifts in Woodinville.
Woodinville STR Booking Lead Time Analysis (2026)
Average Booking Lead Time by Month
Booking Lead Time Insights for Woodinville
- The overall average booking lead time for vacation rentals in Woodinville is 56 days.
- Guests book furthest in advance for stays during July (average 96 days), likely coinciding with peak travel demand or local events.
- The shortest booking windows occur for stays in February (average 25 days), indicating more last-minute travel plans during this time.
- Seasonally, Summer (82 days avg.) sees the longest lead times, while Spring (41 days avg.) has the shortest, reflecting typical travel planning cycles.
Recommendations for Hosts
- Use the overall average lead time (56 days) as a baseline for your pricing and availability strategy in Woodinville.
- For July stays, consider implementing length-of-stay discounts or slightly higher rates for bookings made less than 96 days out to capitalize on advance planning.
- Target marketing efforts for the Summer season well in advance (at least 82 days) to capture early planners.
- Monitor your own booking lead times against these Woodinville averages to identify opportunities for dynamic pricing adjustments.
Popular & Essential Airbnb Amenities in Woodinville (2026)
Amenity Prevalence
Amenity Insights for Woodinville
- Essential amenities in Woodinville that guests expect include: TV, Heating, Free parking on premises, Smoke alarm, Wifi. Lacking these (any) could significantly impact bookings.
- Popular amenities like Carbon monoxide alarm, Hot water, Fire extinguisher are common but not universal. Offering these can provide a competitive edge.
Recommendations for Hosts
- Ensure your listing includes all essential amenities for Woodinville: TV, Heating, Free parking on premises, Smoke alarm, Wifi.
- Consider adding popular differentiators like Carbon monoxide alarm or Hot water to increase appeal.
- Highlight unique or less common amenities you offer (e.g., hot tub, dedicated workspace, EV charger) in your listing description and photos.
- Regularly check competitor amenities in Woodinville to stay competitive.
Woodinville Airbnb Guest Demographics & Profile Analysis (2026)
Guest Profile Summary for Woodinville
- The typical guest profile for Airbnb in Woodinville consists of primarily domestic travelers (94%), often arriving from nearby Seattle, typically belonging to the Post-2000s (Gen Z/Alpha) group (50%), primarily speaking English or Spanish.
- Domestic travelers account for 93.5% of guests.
- Key international markets include United States (93.5%) and Canada (1.8%).
- Top languages spoken are English (68%) followed by Spanish (12.4%).
- A significant demographic segment is the Post-2000s (Gen Z/Alpha) group, representing 50% of guests.
Recommendations for Hosts
- Target domestic marketing efforts towards travelers from Seattle and Portland.
- Tailor amenities and listing descriptions to appeal to the dominant Post-2000s (Gen Z/Alpha) demographic (e.g., highlight fast WiFi, smart home features, local guides).
- Highlight unique local experiences or amenities relevant to the primary guest profile.
- Consider seasonal promotions aligned with peak travel times for key origin markets.
Nearby Short-Term Rental Market Comparison
How does the Woodinville Airbnb market stack up against its neighbors? Compare key performance metrics like average monthly revenue, ADR, and occupancy rates in surrounding areas to understand the broader regional STR landscape.
| Market | Active Properties | Monthly Revenue | Daily Rate | Avg. Occupancy |
|---|---|---|---|---|
| Erlands Point-Kitsap Lake | 12 | $5,285 | $366.41 | 47% |
| North Bend | 51 | $5,073 | $352.89 | 57% |
| Olalla | 13 | $4,868 | $334.79 | 49% |
| Sudden Valley | 63 | $4,821 | $324.44 | 51% |
| Warm Beach | 10 | $4,811 | $319.50 | 43% |
| Verlot | 11 | $4,608 | $314.03 | 49% |
| Canyon Creek | 13 | $4,568 | $301.22 | 51% |
| Ronald | 153 | $4,567 | $456.22 | 35% |
| Sultan | 17 | $4,436 | $300.44 | 51% |
| Amanda Park | 11 | $4,328 | $447.54 | 40% |