Walla Walla Airbnb Market Analysis 2026: Short Term Rental Data & Vacation Rental Statistics in Washington, United States
Is Airbnb profitable in Walla Walla in 2026? Explore comprehensive Airbnb analytics for Walla Walla, Washington, United States to uncover income potential. This 2026 STR market report for Walla Walla, based on AirROI data from February 2025 to January 2026, reveals key trends in the market of 242 active listings.
Whether you're considering an Airbnb investment in Walla Walla, optimizing your existing vacation rental, or exploring rental arbitrage opportunities, understanding the Walla Walla Airbnb data is crucial. Leveraging the low regulation environment is key to maximizing your short term rental income potential. Let's dive into the specifics.
Key Walla Walla Airbnb Performance Metrics Overview
Monthly Airbnb Revenue Variations & Income Potential in Walla Walla (2026)
Understanding the monthly revenue variations for Airbnb listings in Walla Walla is key to maximizing your short term rental income potential. Seasonality significantly impacts earnings. Our analysis, based on data from the past 12 months, shows that the peak revenue month for STRs in Walla Walla is typically June, while January often presents the lowest earnings, highlighting opportunities for strategic pricing adjustments during shoulder and low seasons. Explore the typical Airbnb income in Walla Walla across different performance tiers:
- Best-in-class properties (Top 10%) achieve $7,583+ monthly, often utilizing dynamic pricing and superior guest experiences.
- Strong performing properties (Top 25%) earn $4,734 or more, indicating effective management and desirable locations/amenities.
- Typical properties (Median) generate around $2,871 per month, representing the average market performance.
- Entry-level properties (Bottom 25%) see earnings around $1,778, often with potential for optimization.
Average Monthly Airbnb Earnings Trend in Walla Walla
Walla Walla Airbnb Occupancy Rate Trends (2026)
Maximize your bookings by understanding the Walla Walla STR occupancy trends. Seasonal demand shifts significantly influence how often properties are booked. Typically, Junesees the highest demand (peak season occupancy), while January experiences the lowest (low season). Effective strategies, like adjusting minimum stays or offering promotions, can boost occupancy during slower periods. Here's how different property tiers perform in Walla Walla:
- Best-in-class properties (Top 10%) achieve 70%+ occupancy, indicating high desirability and potentially optimized availability.
- Strong performing properties (Top 25%) maintain 53% or higher occupancy, suggesting good market fit and guest satisfaction.
- Typical properties (Median) have an occupancy rate around 36%.
- Entry-level properties (Bottom 25%) average 22% occupancy, potentially facing higher vacancy.
Average Monthly Occupancy Rate Trend in Walla Walla
Average Daily Rate (ADR) Airbnb Trends in Walla Walla (2026)
Effective short term rental pricing strategy in Walla Walla involves understanding monthly ADR fluctuations. The Average Daily Rate (ADR) for Airbnb in Walla Walla typically peaks in June and dips lowest during February. Leveraging Airbnb dynamic pricing tools or strategies based on this seasonality can significantly boost revenue. Here's a look at the typical nightly rates achieved:
- Best-in-class properties (Top 10%) command rates of $579+ per night, often due to premium features or locations.
- Strong performing properties (Top 25%) achieve nightly rates of $392 or more.
- Typical properties (Median) charge around $249 per night.
- Entry-level properties (Bottom 25%) earn around $164 per night.
Average Daily Rate (ADR) Trend by Month in Walla Walla
Get Live Walla Walla Market Intelligence 👇

Explore Real-time Analytics
Airbnb Seasonality Analysis & Trends in Walla Walla (2026)
Peak Season (June, May, September)
- Revenue averages $5,208 per month
- Occupancy rates average 49.1%
- Daily rates average $342
Shoulder Season
- Revenue averages $3,981 per month
- Occupancy maintains around 40.5%
- Daily rates hold near $314
Low Season (January, February, December)
- Revenue drops to average $2,216 per month
- Occupancy decreases to average 27.1%
- Daily rates adjust to average $295
Seasonality Insights for Walla Walla
- The Airbnb seasonality in Walla Walla shows highly seasonal trends requiring careful strategy. While the sections above show seasonal averages, it's also insightful to look at the extremes:
- During the high season, the absolute peak month showcases Walla Walla's highest earning potential, with monthly revenues capable of climbing to $5,306, occupancy reaching a high of 49.4%, and ADRs peaking at $346.
- Conversely, the slowest single month of the year, typically falling within the low season, marks the market's lowest point. In this month, revenue might dip to $1,811, occupancy could drop to 20.8%, and ADRs may adjust down to $262.
- Understanding both the seasonal averages and these monthly peaks and troughs in revenue, occupancy, and ADR is crucial for maximizing your Airbnb profit potential in Walla Walla.
Seasonal Strategies for Maximizing Profit
- Peak Season: Maximize revenue through premium pricing and potentially longer minimum stays. Ensure high availability.
- Low Season: Offer competitive pricing, special promotions (e.g., extended stay discounts), and flexible cancellation policies. Target off-season travelers like remote workers or budget-conscious guests.
- Shoulder Seasons: Implement dynamic pricing that balances peak and low rates. Target weekend travelers or specific events. Offer slightly more flexible terms than peak season.
- Regularly analyze your own performance against these Walla Walla seasonality benchmarks and adjust your pricing and availability strategy accordingly.
Best Areas for Airbnb Investment in Walla Walla (2026)
Exploring the top neighborhoods for short-term rentals in Walla Walla? This section highlights key areas, outlining why they are attractive for hosts and guests, along with notable local attractions. Consider these locations based on your target guest profile and investment strategy.
| Neighborhood / Area | Why Host Here? (Target Guests & Appeal) | Key Attractions & Landmarks |
|---|---|---|
| Downtown Walla Walla | Vibrant center of Walla Walla with shops, restaurants, and cultural attractions. Ideal for travelers wanting to experience the local flavor and attend events. | Walla Walla Foundry, Gesa Power House Theatre, local wineries and tasting rooms, Historic downtown shops and cafes, Plaza Theatre |
| College Place | Home to Walla Walla University, this area attracts families and educational visitors. Great for hosting visiting relatives and students. | Walla Walla University, Pioneer Park, local eateries, College Place Farmers Market, Reid Campus Center |
| South Walla Walla | Quieter residential area that offers beautiful views and access to outdoor activities, ideal for families and those looking for a relaxing stay. | Mill Creek Trail, Fort Walla Walla Park, local parks, Walla Walla River, nearby wineries |
| Walla Walla Valley | Famous wine region known for its vineyards and tasting rooms. Perfect for wine enthusiasts and tourists looking to explore local wineries. | Local wineries, Wine tasting tours, Walla Walla Wine Alliance, Annual wine events and festivals |
| East Walla Walla | Emerging area with great access to local parks and nature, offering a blend of suburban comfort and adventure opportunities. | Bennington Lake, Magic Mile Mountain Bike Trail, Community parks, Eastside Marketplace |
| West Walla Walla | A residential area with proximity to outdoor activities and small shopping centers. Favored for longer stays with families. | Sunset Park, local grocery stores, scenic views, hiking trails nearby |
| North Walla Walla | A mostly residential area providing a peaceful getaway while still close to the action of downtown, suited for both short and long-term guests. | local parks, Walla Walla Golf Club, vintage shops, easy access to highways |
| Walla Walla Historic District | Rich in history, with charming architecture and historical homes. Great for culture seekers and those wanting a unique travel experience. | Historic homes tour, Baker Boyer Bank, Whitman Mission National Historic Site, local museums, Old Walla Walla Outdoor |
Understanding Airbnb License Requirements & STR Laws in Walla Walla (2026)
While Walla Walla, Washington, United States currently shows low STR regulations, specific Airbnb license requirements might still exist or change. Always verify the latest short term rental regulations and Airbnb license requirements directly with local government authorities for Walla Walla to ensure full compliance before hosting.
(Source: AirROI data, 2026, finding no licensed listings among those analyzed)
Top Performing Airbnb Properties in Walla Walla (2026)
Benchmark your potential! Explore examples of top-performing Airbnb properties in Walla Wallabased on Trailing Twelve Month (TTM) revenue. Analyze their characteristics, revenue, occupancy rate, and ADR to understand what drives success in this market.
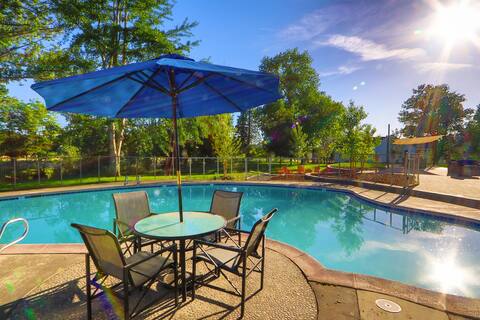
Book NOW for Pool Season!
Entire Place • 8 bedrooms

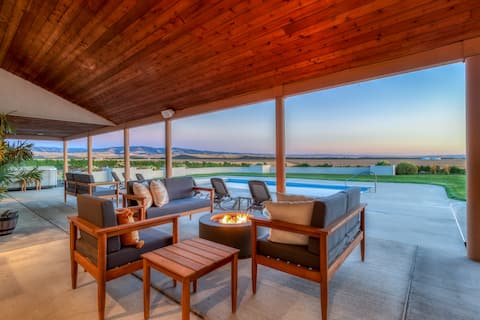
Fountain Hills Vineyard Estate
Entire Place • 6 bedrooms
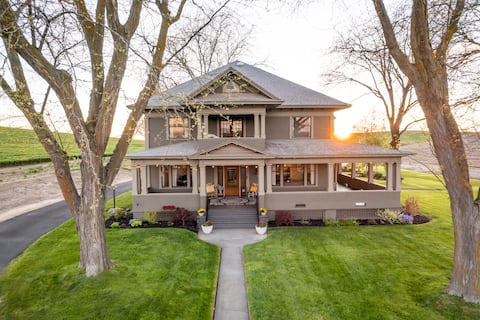
Wheat Ridge Vineyard Estate
Entire Place • 6 bedrooms
The Farmhouse
Entire Place • 8 bedrooms

The Oasis Luxury Home Downtown with pool
Entire Place • 3 bedrooms

Spacious retreat w/ Heated Pool & Hot Tub
Entire Place • 5 bedrooms
Note: Performance varies based on location, size, amenities, seasonality, and management quality. Data reflects the past 12 months.
Top Performing Airbnb Hosts in Walla Walla (2026)
Learn from the best! This table showcases top-performing Airbnb hosts in Walla Walla based on the number of properties managed and estimated total revenue over the past year. Analyze their scale and performance metrics.
| Host Name | Properties | Grossing Revenue | Stay Reviews | Avg Rating |
|---|---|---|---|---|
| Alexa | 54 | $2,892,704 | 3567 | 4.93/5.0 |
| Patty | 10 | $703,075 | 2464 | 4.94/5.0 |
| Chérie | 5 | $410,202 | 378 | 4.97/5.0 |
| The Haven Collection | 9 | $300,454 | 593 | 4.86/5.0 |
| Alex | 1 | $264,989 | 7 | 5.00/5.0 |
| David | 9 | $184,529 | 730 | 4.92/5.0 |
| Ryan | 9 | $155,145 | 274 | 4.83/5.0 |
| Evolve | 3 | $142,398 | 113 | 4.79/5.0 |
| Nick | 2 | $114,970 | 223 | 4.99/5.0 |
| Lynette | 1 | $112,990 | 19 | 5.00/5.0 |
Analyzing the strategies of top hosts, such as their property selection, pricing, and guest communication, can offer valuable lessons for optimizing your own Airbnb operations in Walla Walla.
Dive Deeper: Advanced Walla Walla STR Market Data (2026)
Ready to unlock more insights? AirROI provides access to advanced metrics and comprehensive Airbnb data for Walla Walla. Explore detailed analytics beyond this report to refine your investment strategy, optimize pricing, and maximize your vacation rental profits.
Explore Advanced MetricsWalla Walla Short-Term Rental Market Composition (2026): Property & Room Types
Room Type Distribution
Property Type Distribution
Market Composition Insights for Walla Walla
- The Walla Walla Airbnb market composition is heavily skewed towards Entire Home/Apt listings, which make up 91.3% of the 242 active rentals. This indicates strong guest preference for privacy and space.
- Looking at the property type distribution in Walla Walla, House properties are the most common (60.3%), reflecting the local real estate landscape.
- Houses represent a significant 60.3% portion, catering likely to families or larger groups.
- The presence of 13.6% Hotel/Boutique listings indicates integration with traditional hospitality.
- Smaller segments like unique stays (combined 0.8%) offer potential for unique stay experiences.
Walla Walla Airbnb Room Capacity Analysis (2026): Bedroom Distribution
Distribution of Listings by Number of Bedrooms
Room Capacity Insights for Walla Walla
- The dominant room capacity in Walla Walla is 1 bedroom listings, making up 24.4% of the market. This suggests a strong demand for properties suitable for couples or solo travelers.
- Together, 1 bedroom and 3 bedrooms properties represent 47.5% of the active Airbnb listings in Walla Walla, indicating a high concentration in these sizes.
- A significant 46.2% of listings offer 3+ bedrooms, catering to larger groups and families seeking more space in Walla Walla.
Walla Walla Vacation Rental Guest Capacity Trends (2026)
Distribution of Listings by Guest Capacity
Guest Capacity Insights for Walla Walla
- The most common guest capacity trend in Walla Walla vacation rentals is listings accommodating 8+ guests (28.5%). This suggests the primary traveler segment is likely larger groups.
- Properties designed for 8+ guests and 6 guests dominate the Walla Walla STR market, accounting for 50.4% of listings.
- 51.2% of properties accommodate 6+ guests, serving the market segment for larger families or group travel in Walla Walla.
- On average, properties in Walla Walla are equipped to host 5.1 guests.
Walla Walla Airbnb Booking Patterns (2026): Available vs. Booked Days
Available Days Distribution
Booked Days Distribution
Booking Pattern Insights for Walla Walla
- The most common availability pattern in Walla Walla falls within the 181-270 days range, representing 50% of listings. This suggests many properties have significant open periods on their calendars.
- Approximately 84.7% of listings show high availability (181+ days open annually), indicating potential for increased bookings or specific owner usage patterns.
- For booked days, the 91-180 days range is most frequent in Walla Walla (52.9%), reflecting common guest stay durations or potential owner blocking patterns.
- A notable 15.7% of properties secure long booking periods (181+ days booked per year), highlighting successful long-term rental strategies or significant owner usage.
Walla Walla Airbnb Minimum Stay Requirements Analysis
Distribution of Listings by Minimum Night Requirement
1 Night
45 listings
18.6% of total
2 Nights
148 listings
61.2% of total
3 Nights
5 listings
2.1% of total
7-29 Nights
1 listings
0.4% of total
30+ Nights
43 listings
17.8% of total
Key Insights
- The most prevalent minimum stay requirement in Walla Walla is 2 Nights, adopted by 61.2% of listings. This highlights the market's preference for shorter, flexible bookings.
- A strong majority (79.8%) of the Walla Walla Airbnb data shows acceptance of very short stays (1-2 nights), indicating a dynamic, high-turnover market.
- A significant segment (17.8%) caters to monthly stays (30+ nights) in Walla Walla, pointing to opportunities in the extended-stay market.
Recommendations
- Align with the market by considering a 2 Nights minimum stay, as 61.2% of Walla Walla hosts use this setting.
- If feasible, allowing 1-night stays, especially midweek or during low season, could capture last-minute bookings, as only 18.6% currently do.
- A 2-night minimum appears standard (61.2%). Consider this for weekends or peak periods.
- Explore offering discounts for stays of 30+ nights to attract the 17.8% of the market seeking extended stays.
- Adjust minimum nights based on seasonality – potentially shorter during low season and longer during peak demand periods in Walla Walla.
Walla Walla Airbnb Cancellation Policy Trends Analysis (2026)
Limited
1 listings
0.4% of total
Super Strict 30 Days
2 listings
0.8% of total
Flexible
30 listings
12.4% of total
Moderate
50 listings
20.7% of total
Firm
143 listings
59.1% of total
Strict
16 listings
6.6% of total
Cancellation Policy Insights for Walla Walla
- The prevailing Airbnb cancellation policy trend in Walla Walla is Firm, used by 59.1% of listings.
- A majority (65.7%) of hosts in Walla Walla utilize Firm or Strict policies, indicating a market where hosts prioritize booking security.
- Strict cancellation policies are quite rare (6.6%), potentially making listings with this policy less competitive unless justified by high demand or property type.
Recommendations for Hosts
- Consider adopting a Firm policy to align with the 59.1% market standard in Walla Walla.
- Using a Strict policy might deter some guests, as only 6.6% of listings use it. Evaluate if potential revenue protection outweighs possible lower booking rates.
- Regularly review your cancellation policy against competitors and market demand shifts in Walla Walla.
Walla Walla STR Booking Lead Time Analysis (2026)
Average Booking Lead Time by Month
Booking Lead Time Insights for Walla Walla
- The overall average booking lead time for vacation rentals in Walla Walla is 66 days.
- Guests book furthest in advance for stays during May (average 101 days), likely coinciding with peak travel demand or local events.
- The shortest booking windows occur for stays in January (average 37 days), indicating more last-minute travel plans during this time.
- Seasonally, Fall (71 days avg.) sees the longest lead times, while Winter (42 days avg.) has the shortest, reflecting typical travel planning cycles.
Recommendations for Hosts
- Use the overall average lead time (66 days) as a baseline for your pricing and availability strategy in Walla Walla.
- For May stays, consider implementing length-of-stay discounts or slightly higher rates for bookings made less than 101 days out to capitalize on advance planning.
- Target marketing efforts for the Fall season well in advance (at least 71 days) to capture early planners.
- Monitor your own booking lead times against these Walla Walla averages to identify opportunities for dynamic pricing adjustments.
Popular & Essential Airbnb Amenities in Walla Walla (2026)
Amenity Prevalence
Amenity Insights for Walla Walla
- Essential amenities in Walla Walla that guests expect include: Free parking on premises, Smoke alarm, Air conditioning, Heating, Wifi. Lacking these (any) could significantly impact bookings.
- Popular amenities like Hot water, Fire extinguisher, Essentials are common but not universal. Offering these can provide a competitive edge.
Recommendations for Hosts
- Ensure your listing includes all essential amenities for Walla Walla: Free parking on premises, Smoke alarm, Air conditioning, Heating, Wifi.
- Prioritize adding missing essentials: Free parking on premises, Smoke alarm, Air conditioning, Heating, Wifi.
- Consider adding popular differentiators like Hot water or Fire extinguisher to increase appeal.
- Highlight unique or less common amenities you offer (e.g., hot tub, dedicated workspace, EV charger) in your listing description and photos.
- Regularly check competitor amenities in Walla Walla to stay competitive.
Walla Walla Airbnb Guest Demographics & Profile Analysis (2026)
Guest Profile Summary for Walla Walla
- The typical guest profile for Airbnb in Walla Walla consists of primarily domestic travelers (99%), often arriving from nearby Seattle, typically belonging to the Post-2000s (Gen Z/Alpha) group (50%), primarily speaking English or Spanish.
- Domestic travelers account for 98.5% of guests.
- Key international markets include United States (98.5%) and Canada (0.4%).
- Top languages spoken are English (75%) followed by Spanish (11.2%).
- A significant demographic segment is the Post-2000s (Gen Z/Alpha) group, representing 50% of guests.
Recommendations for Hosts
- Target domestic marketing efforts towards travelers from Seattle and Portland.
- Tailor amenities and listing descriptions to appeal to the dominant Post-2000s (Gen Z/Alpha) demographic (e.g., highlight fast WiFi, smart home features, local guides).
- Highlight unique local experiences or amenities relevant to the primary guest profile.
- Consider seasonal promotions aligned with peak travel times for key origin markets.
Nearby Short-Term Rental Market Comparison
How does the Walla Walla Airbnb market stack up against its neighbors? Compare key performance metrics like average monthly revenue, ADR, and occupancy rates in surrounding areas to understand the broader regional STR landscape.
| Market | Active Properties | Monthly Revenue | Daily Rate | Avg. Occupancy |
|---|---|---|---|---|
| Fairwood | 17 | $3,631 | $273.53 | 47% |
| Benton City | 20 | $3,206 | $321.46 | 41% |
| Moses Lake | 95 | $2,869 | $295.85 | 42% |
| College Place | 61 | $2,803 | $261.62 | 41% |
| Nine Mile Falls | 24 | $2,726 | $278.02 | 38% |
| Pullman | 112 | $2,653 | $285.44 | 38% |
| Colbert | 27 | $2,645 | $218.12 | 41% |
| La Grande | 81 | $2,590 | $172.69 | 50% |
| Country Homes | 16 | $2,462 | $151.29 | 57% |
| Desert Aire | 40 | $2,408 | $335.89 | 35% |