Shoreline Airbnb Market Analysis 2026: Short Term Rental Data & Vacation Rental Statistics in Washington, United States
Is Airbnb profitable in Shoreline in 2026? Explore comprehensive Airbnb analytics for Shoreline, Washington, United States to uncover income potential. This 2026 STR market report for Shoreline, based on AirROI data from February 2025 to January 2026, reveals key trends in the niche market of 181 active listings.
Whether you're considering an Airbnb investment in Shoreline, optimizing your existing vacation rental, or exploring rental arbitrage opportunities, understanding the Shoreline Airbnb data is crucial. Leveraging the low regulation environment is key to maximizing your short term rental income potential. Let's dive into the specifics.
Key Shoreline Airbnb Performance Metrics Overview
Monthly Airbnb Revenue Variations & Income Potential in Shoreline (2026)
Understanding the monthly revenue variations for Airbnb listings in Shoreline is key to maximizing your short term rental income potential. Seasonality significantly impacts earnings. Our analysis, based on data from the past 12 months, shows that the peak revenue month for STRs in Shoreline is typically July, while January often presents the lowest earnings, highlighting opportunities for strategic pricing adjustments during shoulder and low seasons. Explore the typical Airbnb income in Shoreline across different performance tiers:
- Best-in-class properties (Top 10%) achieve $5,609+ monthly, often utilizing dynamic pricing and superior guest experiences.
- Strong performing properties (Top 25%) earn $3,614 or more, indicating effective management and desirable locations/amenities.
- Typical properties (Median) generate around $2,127 per month, representing the average market performance.
- Entry-level properties (Bottom 25%) see earnings around $1,095, often with potential for optimization.
Average Monthly Airbnb Earnings Trend in Shoreline
Shoreline Airbnb Occupancy Rate Trends (2026)
Maximize your bookings by understanding the Shoreline STR occupancy trends. Seasonal demand shifts significantly influence how often properties are booked. Typically, Julysees the highest demand (peak season occupancy), while January experiences the lowest (low season). Effective strategies, like adjusting minimum stays or offering promotions, can boost occupancy during slower periods. Here's how different property tiers perform in Shoreline:
- Best-in-class properties (Top 10%) achieve 86%+ occupancy, indicating high desirability and potentially optimized availability.
- Strong performing properties (Top 25%) maintain 70% or higher occupancy, suggesting good market fit and guest satisfaction.
- Typical properties (Median) have an occupancy rate around 51%.
- Entry-level properties (Bottom 25%) average 29% occupancy, potentially facing higher vacancy.
Average Monthly Occupancy Rate Trend in Shoreline
Average Daily Rate (ADR) Airbnb Trends in Shoreline (2026)
Effective short term rental pricing strategy in Shoreline involves understanding monthly ADR fluctuations. The Average Daily Rate (ADR) for Airbnb in Shoreline typically peaks in July and dips lowest during February. Leveraging Airbnb dynamic pricing tools or strategies based on this seasonality can significantly boost revenue. Here's a look at the typical nightly rates achieved:
- Best-in-class properties (Top 10%) command rates of $331+ per night, often due to premium features or locations.
- Strong performing properties (Top 25%) achieve nightly rates of $211 or more.
- Typical properties (Median) charge around $126 per night.
- Entry-level properties (Bottom 25%) earn around $73 per night.
Average Daily Rate (ADR) Trend by Month in Shoreline
Get Live Shoreline Market Intelligence 👇

Explore Real-time Analytics
Airbnb Seasonality Analysis & Trends in Shoreline (2026)
Peak Season (July, June, August)
- Revenue averages $4,024 per month
- Occupancy rates average 63.8%
- Daily rates average $186
Shoulder Season
- Revenue averages $2,580 per month
- Occupancy maintains around 49.0%
- Daily rates hold near $163
Low Season (January, February, April)
- Revenue drops to average $1,773 per month
- Occupancy decreases to average 41.4%
- Daily rates adjust to average $154
Seasonality Insights for Shoreline
- The Airbnb seasonality in Shoreline shows highly seasonal trends requiring careful strategy. While the sections above show seasonal averages, it's also insightful to look at the extremes:
- During the high season, the absolute peak month showcases Shoreline's highest earning potential, with monthly revenues capable of climbing to $4,316, occupancy reaching a high of 67.1%, and ADRs peaking at $188.
- Conversely, the slowest single month of the year, typically falling within the low season, marks the market's lowest point. In this month, revenue might dip to $1,485, occupancy could drop to 30.4%, and ADRs may adjust down to $149.
- Understanding both the seasonal averages and these monthly peaks and troughs in revenue, occupancy, and ADR is crucial for maximizing your Airbnb profit potential in Shoreline.
Seasonal Strategies for Maximizing Profit
- Peak Season: Maximize revenue through premium pricing and potentially longer minimum stays. Ensure high availability.
- Low Season: Offer competitive pricing, special promotions (e.g., extended stay discounts), and flexible cancellation policies. Target off-season travelers like remote workers or budget-conscious guests.
- Shoulder Seasons: Implement dynamic pricing that balances peak and low rates. Target weekend travelers or specific events. Offer slightly more flexible terms than peak season.
- Regularly analyze your own performance against these Shoreline seasonality benchmarks and adjust your pricing and availability strategy accordingly.
Best Areas for Airbnb Investment in Shoreline (2026)
Exploring the top neighborhoods for short-term rentals in Shoreline? This section highlights key areas, outlining why they are attractive for hosts and guests, along with notable local attractions. Consider these locations based on your target guest profile and investment strategy.
| Neighborhood / Area | Why Host Here? (Target Guests & Appeal) | Key Attractions & Landmarks |
|---|---|---|
| Richmond Beach | A serene neighborhood with stunning views of the Puget Sound and easy access to beach parks. Ideal for those looking for a peaceful retreat while still being close to urban amenities. | Richmond Beach Saltwater Park, Einstein Bros. Bagels, Kauai Family Restaurant, Richmond Beach Community Park, Boeing Creek Park |
| Shoreline Center | The hub of activity in Shoreline, including shopping, recreation, and dining. Perfect for families and visitors looking for convenience and accessibility. | Shoreline Community College, Shoreline Center, Krause Center, Shoreline Park, The Shoreline Farmers Market |
| Echo Lake | A quieter residential area with a lovely park, perfect for families and those looking to escape the hustle of the city while remaining near Seattle. | Echo Lake Park, Shoreline Historical Museum, Burke-Gilman Trail, Haller Lake, Northwest Metro Park |
| North City | An up-and-coming area with unique dining options and local shops. Ideal for guests wanting to experience local culture and convenience to the city. | Alderwood Mall, North City Water District, Dunn Gardens, Mountlake Terrace Library, Cinebarre Mountlake Terrace |
| Ballinger | A suburban area known for its parks and access to Lake Ballinger. Great choice for outdoor enthusiasts and families. | Lake Ballinger Park, Ballinger Park, Shoreline Golf Course, Shoreline Lake Forest Park, Sammamish River Trail |
| Lake Forest Park | A beautiful area with access to parks and nature trails, offering a peaceful environment close to Seattle attractions. | Lake Forest Park Town Center, Third Place Books, Burke-Gilman Trail, Ballinger Park, Richmond Beach Saltwater Park |
| Briarcrest | A quiet community that offers a suburban feel and access to various amenities, making it suitable for families and longer stays. | Briarcrest Park, Echo Lake Park, Shoreline Golf Course, Remington Park, Kauai Family Restaurants |
| Shoreline Historic District | Rich in history and culture, this area features charming parks and historic buildings, attracting visitors interested in local history and architecture. | Shoreline Historical Museum, Boeing Creek Park, Krause Center, Historic Shoreline Park, Shorewood High School |
Understanding Airbnb License Requirements & STR Laws in Shoreline (2026)
While Shoreline, Washington, United States currently shows low STR regulations, specific Airbnb license requirements might still exist or change. Always verify the latest short term rental regulations and Airbnb license requirements directly with local government authorities for Shoreline to ensure full compliance before hosting.
(Source: AirROI data, 2026, based on 2% licensed listings)
Top Performing Airbnb Properties in Shoreline (2026)
Benchmark your potential! Explore examples of top-performing Airbnb properties in Shorelinebased on Trailing Twelve Month (TTM) revenue. Analyze their characteristics, revenue, occupancy rate, and ADR to understand what drives success in this market.
ADA/King Beds/BBQ/Fire Pit/4,400 sqft/Game Room
Entire Place • 9 bedrooms

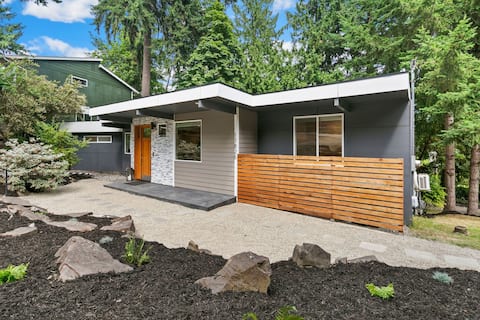
Mid-Century Marvel: Fire Pit, BBQ, Tesla Charger
Entire Place • 4 bedrooms

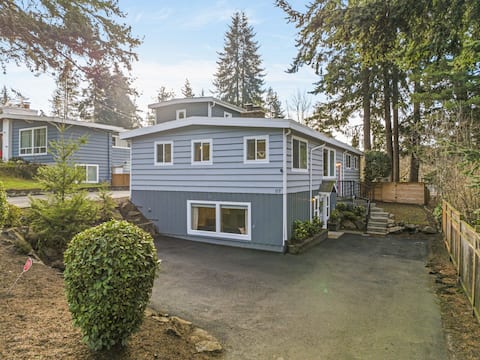
Mid-Century Modern Retreat with Incredible Views!
Entire Place • 4 bedrooms
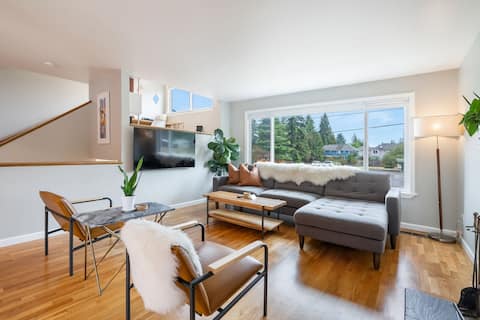
4BR/3Bath Tranquil Home- 1 mi to light rail!
Entire Place • 4 bedrooms
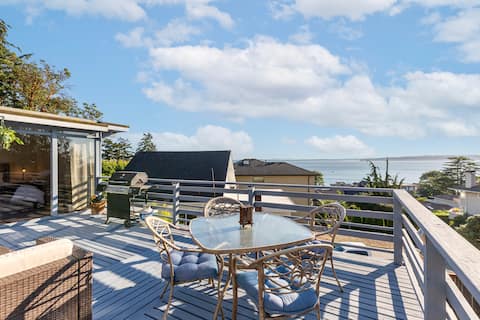
Stunning Ocean View Home walking to Richmond Beach
Entire Place • 3 bedrooms
Gathering Spot: Spacious 5BR home in Shoreline
Entire Place • 5 bedrooms
Note: Performance varies based on location, size, amenities, seasonality, and management quality. Data reflects the past 12 months.
Top Performing Airbnb Hosts in Shoreline (2026)
Learn from the best! This table showcases top-performing Airbnb hosts in Shoreline based on the number of properties managed and estimated total revenue over the past year. Analyze their scale and performance metrics.
| Host Name | Properties | Grossing Revenue | Stay Reviews | Avg Rating |
|---|---|---|---|---|
| Allen | 9 | $234,101 | 1244 | 4.53/5.0 |
| Nick | 4 | $230,641 | 105 | 4.94/5.0 |
| Allen Lu | 4 | $196,062 | 278 | 4.76/5.0 |
| Shawn | 3 | $176,399 | 54 | 4.85/5.0 |
| The Vaisberg | 4 | $119,497 | 75 | 4.67/5.0 |
| 2plus Llc | 2 | $118,104 | 82 | 4.67/5.0 |
| Katherine | 3 | $99,313 | 135 | 4.94/5.0 |
| Bill | 1 | $96,659 | 110 | 4.95/5.0 |
| Plushy | 1 | $92,345 | 9 | 4.67/5.0 |
| Vagner | 3 | $86,143 | 461 | 4.82/5.0 |
Analyzing the strategies of top hosts, such as their property selection, pricing, and guest communication, can offer valuable lessons for optimizing your own Airbnb operations in Shoreline.
Dive Deeper: Advanced Shoreline STR Market Data (2026)
Ready to unlock more insights? AirROI provides access to advanced metrics and comprehensive Airbnb data for Shoreline. Explore detailed analytics beyond this report to refine your investment strategy, optimize pricing, and maximize your vacation rental profits.
Explore Advanced MetricsShoreline Short-Term Rental Market Composition (2026): Property & Room Types
Room Type Distribution
Property Type Distribution
Market Composition Insights for Shoreline
- The Shoreline Airbnb market composition is heavily skewed towards Entire Home/Apt listings, which make up 66.3% of the 181 active rentals. This indicates strong guest preference for privacy and space.
- However, a notable 33.7% share for Private Rooms suggests opportunities for budget-conscious travelers or hosts renting out spare rooms.
- Looking at the property type distribution in Shoreline, House properties are the most common (71.8%), reflecting the local real estate landscape.
- Houses represent a significant 71.8% portion, catering likely to families or larger groups.
- The presence of 8.8% Hotel/Boutique listings indicates integration with traditional hospitality.
Shoreline Airbnb Room Capacity Analysis (2026): Bedroom Distribution
Distribution of Listings by Number of Bedrooms
Room Capacity Insights for Shoreline
- The dominant room capacity in Shoreline is 1 bedroom listings, making up 23.2% of the market. This suggests a strong demand for properties suitable for couples or solo travelers.
- Together, 1 bedroom and 2 bedrooms properties represent 38.7% of the active Airbnb listings in Shoreline, indicating a high concentration in these sizes.
- A significant 25.4% of listings offer 3+ bedrooms, catering to larger groups and families seeking more space in Shoreline.
Shoreline Vacation Rental Guest Capacity Trends (2026)
Distribution of Listings by Guest Capacity
Guest Capacity Insights for Shoreline
- The most common guest capacity trend in Shoreline vacation rentals is listings accommodating 4 guests (14.9%). This suggests the primary traveler segment is likely small families or groups.
- Properties designed for 4 guests and 8+ guests dominate the Shoreline STR market, accounting for 28.2% of listings.
- 29.4% of properties accommodate 6+ guests, serving the market segment for larger families or group travel in Shoreline.
- On average, properties in Shoreline are equipped to host 3.3 guests.
Shoreline Airbnb Booking Patterns (2026): Available vs. Booked Days
Available Days Distribution
Booked Days Distribution
Booking Pattern Insights for Shoreline
- The most common availability pattern in Shoreline falls within the 181-270 days range, representing 36.5% of listings. This suggests many properties have significant open periods on their calendars.
- Approximately 66.3% of listings show high availability (181+ days open annually), indicating potential for increased bookings or specific owner usage patterns.
- For booked days, the 91-180 days range is most frequent in Shoreline (35.9%), reflecting common guest stay durations or potential owner blocking patterns.
- A notable 35.4% of properties secure long booking periods (181+ days booked per year), highlighting successful long-term rental strategies or significant owner usage.
Shoreline Airbnb Minimum Stay Requirements Analysis
Distribution of Listings by Minimum Night Requirement
1 Night
30 listings
16.6% of total
2 Nights
34 listings
18.8% of total
3 Nights
16 listings
8.8% of total
4-6 Nights
13 listings
7.2% of total
7-29 Nights
24 listings
13.3% of total
30+ Nights
64 listings
35.4% of total
Key Insights
- The most prevalent minimum stay requirement in Shoreline is 30+ Nights, adopted by 35.4% of listings. This highlights the market's preference for longer commitments.
- A significant segment (35.4%) caters to monthly stays (30+ nights) in Shoreline, pointing to opportunities in the extended-stay market.
Recommendations
- Align with the market by considering a 30+ Nights minimum stay, as 35.4% of Shoreline hosts use this setting.
- If feasible, allowing 1-night stays, especially midweek or during low season, could capture last-minute bookings, as only 16.6% currently do.
- Explore offering discounts for stays of 30+ nights to attract the 35.4% of the market seeking extended stays.
- Adjust minimum nights based on seasonality – potentially shorter during low season and longer during peak demand periods in Shoreline.
Shoreline Airbnb Cancellation Policy Trends Analysis (2026)
Limited
5 listings
2.8% of total
Super Strict 30 Days
3 listings
1.7% of total
Super Strict 60 Days
2 listings
1.1% of total
Flexible
37 listings
20.4% of total
Moderate
49 listings
27.1% of total
Firm
66 listings
36.5% of total
Strict
19 listings
10.5% of total
Cancellation Policy Insights for Shoreline
- The prevailing Airbnb cancellation policy trend in Shoreline is Firm, used by 36.5% of listings.
- There's a relatively balanced mix between guest-friendly (47.5%) and stricter (47.0%) policies, offering choices for different guest needs.
Recommendations for Hosts
- Consider adopting a Firm policy to align with the 36.5% market standard in Shoreline.
- Using a Strict policy might deter some guests, as only 10.5% of listings use it. Evaluate if potential revenue protection outweighs possible lower booking rates.
- Regularly review your cancellation policy against competitors and market demand shifts in Shoreline.
Shoreline STR Booking Lead Time Analysis (2026)
Average Booking Lead Time by Month
Booking Lead Time Insights for Shoreline
- The overall average booking lead time for vacation rentals in Shoreline is 33 days.
- Guests book furthest in advance for stays during July (average 50 days), likely coinciding with peak travel demand or local events.
- The shortest booking windows occur for stays in February (average 21 days), indicating more last-minute travel plans during this time.
- Seasonally, Summer (45 days avg.) sees the longest lead times, while Winter (26 days avg.) has the shortest, reflecting typical travel planning cycles.
Recommendations for Hosts
- Use the overall average lead time (33 days) as a baseline for your pricing and availability strategy in Shoreline.
- For July stays, consider implementing length-of-stay discounts or slightly higher rates for bookings made less than 50 days out to capitalize on advance planning.
- Target marketing efforts for the Summer season well in advance (at least 45 days) to capture early planners.
- Monitor your own booking lead times against these Shoreline averages to identify opportunities for dynamic pricing adjustments.
Popular & Essential Airbnb Amenities in Shoreline (2026)
Amenity Prevalence
Amenity Insights for Shoreline
- Essential amenities in Shoreline that guests expect include: Wifi, Heating, Hot water, Smoke alarm. Lacking these (any) could significantly impact bookings.
- Popular amenities like Carbon monoxide alarm, Kitchen, Free parking on premises are common but not universal. Offering these can provide a competitive edge.
Recommendations for Hosts
- Ensure your listing includes all essential amenities for Shoreline: Wifi, Heating, Hot water, Smoke alarm.
- Prioritize adding missing essentials: Heating, Hot water, Smoke alarm.
- Consider adding popular differentiators like Carbon monoxide alarm or Kitchen to increase appeal.
- Highlight unique or less common amenities you offer (e.g., hot tub, dedicated workspace, EV charger) in your listing description and photos.
- Regularly check competitor amenities in Shoreline to stay competitive.
Shoreline Airbnb Guest Demographics & Profile Analysis (2026)
Guest Profile Summary for Shoreline
- The typical guest profile for Airbnb in Shoreline consists of primarily domestic travelers (92%), often arriving from nearby Seattle, typically belonging to the Post-2000s (Gen Z/Alpha) group (50%), primarily speaking English or Spanish.
- Domestic travelers account for 91.7% of guests.
- Key international markets include United States (91.7%) and Canada (2.5%).
- Top languages spoken are English (65.5%) followed by Spanish (12.8%).
- A significant demographic segment is the Post-2000s (Gen Z/Alpha) group, representing 50% of guests.
Recommendations for Hosts
- Target domestic marketing efforts towards travelers from Seattle and Portland.
- Tailor amenities and listing descriptions to appeal to the dominant Post-2000s (Gen Z/Alpha) demographic (e.g., highlight fast WiFi, smart home features, local guides).
- Highlight unique local experiences or amenities relevant to the primary guest profile.
- Consider seasonal promotions aligned with peak travel times for key origin markets.
Nearby Short-Term Rental Market Comparison
How does the Shoreline Airbnb market stack up against its neighbors? Compare key performance metrics like average monthly revenue, ADR, and occupancy rates in surrounding areas to understand the broader regional STR landscape.
| Market | Active Properties | Monthly Revenue | Daily Rate | Avg. Occupancy |
|---|---|---|---|---|
| Erlands Point-Kitsap Lake | 12 | $5,285 | $366.41 | 47% |
| North Bend | 51 | $5,073 | $352.89 | 57% |
| Olalla | 13 | $4,868 | $334.79 | 49% |
| Sudden Valley | 63 | $4,821 | $324.44 | 51% |
| Warm Beach | 10 | $4,811 | $319.50 | 43% |
| Verlot | 11 | $4,608 | $314.03 | 49% |
| Canyon Creek | 13 | $4,568 | $301.22 | 51% |
| Ronald | 153 | $4,567 | $456.22 | 35% |
| Sultan | 17 | $4,436 | $300.44 | 51% |
| Woodinville | 35 | $4,409 | $340.44 | 51% |